Line Management Jobs in the UK excluding London

Line Management
UK > UK excluding London

The table below provides summary statistics for permanent job vacancies advertised in the UK excluding London requiring Line Management skills. It includes a benchmarking guide to the annual salaries offered in vacancies that cited Line Management over the 6 months leading up to 21 August 2025, comparing them to the same period in the previous two years.

6 months to
21 Aug 2025
Same period 2024 Same period 2023
Rank 45 130 126
Rank change year-on-year +85 -4 -31
DemandTrendPermanent jobs citing Line Management 2,028 1,241 1,136
As % of all permanent jobs advertised in the UK excluding London 4.55% 1.98% 2.62%
As % of the Processes & Methodologies category 5.22% 2.50% 2.75%
Number of salaries quoted 510 558 620
10th Percentile £25,313 £27,117 £31,901
25th Percentile £33,125 £36,250 £42,500
Median annual salary (50th Percentile) £52,600 £48,750 £55,181
Median % change year-on-year +7.90% -11.65% +10.36%
75th Percentile £67,500 £65,000 £72,500
90th Percentile £82,500 £75,000 £85,000
UK median annual salary £55,000 £58,900 £65,000
% change year-on-year -6.62% -9.38% +8.33%

All Process and Methodology Skills
UK excluding London

Line Management falls under the Processes and Methodologies category. For comparison with the information above, the following table provides summary statistics for all permanent job vacancies requiring process or methodology skills in the UK excluding London.

DemandTrendPermanent vacancies with a requirement for process or methodology skills 38,824 49,608 41,344
As % of all permanent jobs advertised in the UK excluding London 87.02% 79.24% 95.37%
Number of salaries quoted 20,121 29,141 25,178
10th Percentile £25,313 £29,750 £30,000
25th Percentile £32,500 £38,750 £40,000
Median annual salary (50th Percentile) £50,000 £50,000 £55,000
Median % change year-on-year - -9.09% +4.76%
75th Percentile £65,000 £65,000 £68,750
90th Percentile £79,000 £80,000 £81,250
UK median annual salary £55,000 £55,000 £60,055
% change year-on-year - -8.42% +0.09%

Line Management
Job Vacancy Trend in the UK excluding London

Job postings citing Line Management as a proportion of all IT jobs advertised in the UK excluding London.
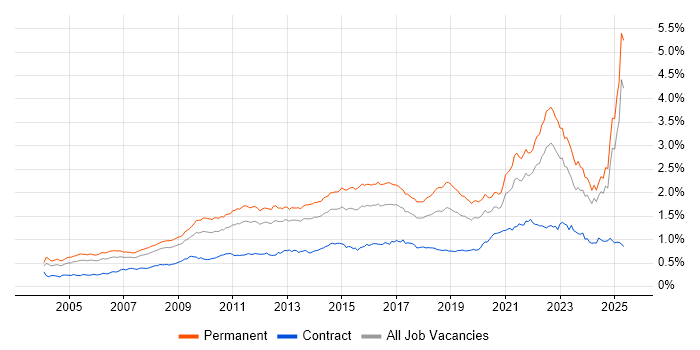
Job vacancy trend for Line Management in the UK excluding London

Line Management
Salary Trend in the UK excluding London

Salary distribution trend for jobs in the UK excluding London citing Line Management.

Salary distribution trend for jobs in the UK excluding London citing Line Management

Line Management
Salary Histogram in the UK excluding London

Salary distribution for jobs citing Line Management in the UK excluding London over the 6 months to 21 August 2025.

Salary histogram for Line Management in the UK excluding London

Line Management
Job Locations in the UK excluding London

The table below looks at the demand and provides a guide to the median salaries quoted in IT jobs citing Line Management within the UK excluding London region over the 6 months to 21 August 2025. The 'Rank Change' column provides an indication of the change in demand within each location based on the same 6 month period last year.

Location Rank Change
on Same Period
Last Year
Matching
DemandTrendPermanent
IT Job Ads
Median Salary
Past 6 Months
Median Salary
% Change
on Same Period
Last Year
Live
Jobs
North of England +107 1,349 £47,683 -4.63% 193
North West +101 939 £50,890 +1.78% 101
Yorkshire +83 399 £30,000 -42.86% 77
South East +34 305 £55,000 +10.01% 245
South West +38 125 £52,600 +7.28% 93
Midlands -17 124 £52,149 +4.30% 108
East of England -46 67 £62,000 +128.64% 73
West Midlands +12 63 £41,500 -26.26% 63
East Midlands -10 60 £65,000 +62.50% 44
Scotland -36 33 £50,957 +7.28% 48
Wales -1 26 £62,000 +19.24% 38
North East -12 11 £45,000 +7.72% 17
Line Management
UK

Line Management
Co-occurring Skills and Capabilities in the UK excluding London by Category

The follow tables expand on the table above by listing co-occurrences grouped by category. The same employment type, locality and period is covered with up to 20 co-occurrences shown in each of the following categories:

Application Platforms
1 21 (1.04%) SharePoint
2 17 (0.84%) Microsoft Exchange
3 4 (0.20%) Confluence
4 3 (0.15%) SharePoint Server
5 2 (0.099%) ColdFusion
5 2 (0.099%) MTS
6 1 (0.049%) Apache
6 1 (0.049%) Apache Airflow
6 1 (0.049%) CMS
6 1 (0.049%) Exchange Server 2003
6 1 (0.049%) WordPress
Applications
1 406 (20.02%) Microsoft Excel
2 89 (4.39%) Microsoft Office
3 15 (0.74%) Simulink
4 8 (0.39%) Microsoft PowerPoint
5 4 (0.20%) MS Visio
6 2 (0.099%) Spreadsheet
7 1 (0.049%) Microsoft Project
7 1 (0.049%) Trello
Business Applications
1 8 (0.39%) Magento
1 8 (0.39%) Shopify
2 6 (0.30%) Remedy ITSM
3 4 (0.20%) Oracle ERP
3 4 (0.20%) SAP S/4HANA
4 3 (0.15%) Maximo
4 3 (0.15%) SAP IBP
4 3 (0.15%) Sparx Enterprise Architect
5 2 (0.099%) Dynamics CRM
5 2 (0.099%) Infor M3
6 1 (0.049%) assyst
6 1 (0.049%) NetSuite
6 1 (0.049%) SAP Business One
Cloud Services
1 95 (4.68%) Azure
2 70 (3.45%) AWS
3 50 (2.47%) SaaS
4 43 (2.12%) Microsoft 365
5 37 (1.82%) Amazon EKS
5 37 (1.82%) AWS CloudFormation
6 18 (0.89%) Entra ID
7 15 (0.74%) Serverless
8 14 (0.69%) Amazon CloudWatch
8 14 (0.69%) Amazon EventBridge
8 14 (0.69%) Amazon SQS
8 14 (0.69%) AWS CodeBuild
8 14 (0.69%) AWS CodeDeploy
8 14 (0.69%) AWS CodePipeline
8 14 (0.69%) AWS Lambda
8 14 (0.69%) AWS Step Functions
8 14 (0.69%) Boomi
8 14 (0.69%) Salsify
9 12 (0.59%) OneDrive
9 12 (0.59%) Power Platform
Communications & Networking
1 672 (33.14%) VPN
2 407 (20.07%) DNS
3 260 (12.82%) Cisco IOS
4 20 (0.99%) LAN
5 15 (0.74%) DHCP
6 13 (0.64%) Network Security
6 13 (0.64%) Wireless
7 12 (0.59%) Firewall
7 12 (0.59%) WAN
8 9 (0.44%) Intranet
8 9 (0.44%) TCP/IP
9 8 (0.39%) SMTP
10 7 (0.35%) FTP
10 7 (0.35%) HTTP
10 7 (0.35%) Internet
11 6 (0.30%) Wi-Fi
12 4 (0.20%) OSPF
13 3 (0.15%) RIP
14 2 (0.099%) BGP
14 2 (0.099%) SNMP
Database & Business Intelligence
1 36 (1.78%) Elasticsearch
2 20 (0.99%) Metadata
3 16 (0.79%) Big Data
4 14 (0.69%) Relational Database
5 10 (0.49%) SQL Server
6 8 (0.39%) Power BI
7 7 (0.35%) PostgreSQL
8 4 (0.20%) MySQL
9 3 (0.15%) Amazon Aurora
9 3 (0.15%) CockroachDB
9 3 (0.15%) RDBMS
10 2 (0.099%) Data Warehouse
11 1 (0.049%) BusinessObjects
11 1 (0.049%) DTS
11 1 (0.049%) MongoDB
11 1 (0.049%) NoSQL
11 1 (0.049%) Oracle Database 10g
11 1 (0.049%) QlikView
11 1 (0.049%) SQL Server Integration Services
11 1 (0.049%) Tableau
Development Applications
1 48 (2.37%) Rational DOORS
2 17 (0.84%) JIRA
3 7 (0.35%) GitLab
4 4 (0.20%) Balsamiq
4 4 (0.20%) Git
5 3 (0.15%) ERwin
5 3 (0.15%) WaveMaker
6 1 (0.049%) Bitbucket
6 1 (0.049%) Jenkins
6 1 (0.049%) Snyk
6 1 (0.049%) Visual Studio
General
1 978 (48.22%) Inclusion and Diversity
2 752 (37.08%) Analytical Skills
3 618 (30.47%) Finance
4 595 (29.34%) Social Skills
5 388 (19.13%) Electronics
6 377 (18.59%) Marketing
7 354 (17.46%) Manufacturing
8 318 (15.68%) Law
9 275 (13.56%) Legal
10 87 (4.29%) Organisational Skills
11 60 (2.96%) Banking
12 45 (2.22%) Esports
12 45 (2.22%) Retail
13 35 (1.73%) Financial Institution
14 33 (1.63%) Public Sector
15 26 (1.28%) Telecoms
16 19 (0.94%) Police
17 16 (0.79%) Aerospace
18 13 (0.64%) Local Government
19 8 (0.39%) Military
Job Titles
1 451 (22.24%) Developer
2 437 (21.55%) Software Developer
3 272 (13.41%) Infrastructure Engineer
4 157 (7.74%) Senior
5 134 (6.61%) Lead
6 110 (5.42%) Systems Engineer
7 105 (5.18%) Senior Systems Engineer
8 96 (4.73%) Coordinator
9 47 (2.32%) Team Leader
10 38 (1.87%) Analyst
11 35 (1.73%) Administrator
12 32 (1.58%) Operations Support Specialist
12 32 (1.58%) Support Specialist
13 29 (1.43%) Technical Support
14 28 (1.38%) Logistics Coordinator
14 28 (1.38%) Product Manager
14 28 (1.38%) Senior Manager
15 27 (1.33%) Software Team Leader
16 26 (1.28%) Delivery Manager
17 21 (1.04%) Support Engineer
Libraries, Frameworks & Software Standards
1 260 (12.82%) Elastic Stack
2 58 (2.86%) .NET
3 40 (1.97%) Node.js
3 40 (1.97%) Software Packaging
4 36 (1.78%) Pandas
5 18 (0.89%) RESTful
6 14 (0.69%) HTML
6 14 (0.69%) JWT
6 14 (0.69%) OAuth
7 13 (0.64%) React
8 12 (0.59%) .NET Core
9 7 (0.35%) AngularJS
9 7 (0.35%) LDAP
10 6 (0.30%) CSS
11 5 (0.25%) ASP.NET
11 5 (0.25%) EDI
12 4 (0.20%) ASP.NET Web Forms
12 4 (0.20%) Kafka
12 4 (0.20%) Lambda Expressions
12 4 (0.20%) Oracle Fusion
Miscellaneous
1 923 (45.51%) Cyberattack
2 69 (3.40%) Social Media
3 54 (2.66%) Self-Motivation
4 50 (2.47%) Algorithms
5 47 (2.32%) Management Information System
6 43 (2.12%) Product Ownership
7 20 (0.99%) Credit Risk
7 20 (0.99%) FMCG
8 18 (0.89%) Data Protection Act
8 18 (0.89%) Onboarding
9 17 (0.84%) Cloud Native
9 17 (0.84%) PMI
10 15 (0.74%) NHS
11 14 (0.69%) Taxonomies
12 11 (0.54%) Driving Licence
13 9 (0.44%) Security Operations Centre
14 8 (0.39%) EPoS
15 7 (0.35%) Client/Server
16 6 (0.30%) Analytical Mindset
17 5 (0.25%) Virtual Team
Operating Systems
1 693 (34.17%) Linux
2 688 (33.93%) Android
3 331 (16.32%) Windows
4 45 (2.22%) Windows Vista
5 5 (0.25%) Windows Server
5 5 (0.25%) Windows Server 2019
6 3 (0.15%) Unix
6 3 (0.15%) Windows 10
6 3 (0.15%) Windows Server 2016
7 2 (0.099%) Apple iOS
7 2 (0.099%) Mac OS
8 1 (0.049%) HPUX
8 1 (0.049%) Robot Operating System
8 1 (0.049%) Solaris
8 1 (0.049%) Windows Server 2003
Processes & Methodologies
1 791 (39.00%) Mathematics
2 611 (30.13%) Agile
3 430 (21.20%) OO
4 429 (21.15%) Design Patterns
5 427 (21.06%) Android Development
5 427 (21.06%) OOP
6 362 (17.85%) CRM
7 352 (17.36%) Problem-Solving
8 342 (16.86%) Data Entry
9 335 (16.52%) Supply Chain Management
10 328 (16.17%) DevOps
11 327 (16.12%) Risk Management
12 325 (16.03%) Cybersecurity
13 279 (13.76%) Infrastructure Engineering
14 261 (12.87%) Platform Engineering
14 261 (12.87%) Task Automation
15 260 (12.82%) Storage Management
16 246 (12.13%) Creative Thinking
17 132 (6.51%) Continuous Improvement
18 123 (6.07%) Software Engineering
Programming Languages
1 704 (34.71%) Python
2 469 (23.13%) Java
3 437 (21.55%) C++
4 429 (21.15%) Go
5 271 (13.36%) PowerShell
6 266 (13.12%) Bash
7 57 (2.81%) C#
7 57 (2.81%) Rust
8 52 (2.56%) JavaScript
9 26 (1.28%) SQL
10 15 (0.74%) TypeScript
11 8 (0.39%) Delphi
12 5 (0.25%) C
12 5 (0.25%) Perl
13 3 (0.15%) PHP
14 2 (0.099%) Elixir
14 2 (0.099%) F#
14 2 (0.099%) Scala
14 2 (0.099%) T-SQL
14 2 (0.099%) VB
Qualifications
1 502 (24.75%) Security Cleared
2 494 (24.36%) Degree
3 468 (23.08%) DV Cleared
4 93 (4.59%) BPSS Clearance
5 71 (3.50%) DBS Check
6 43 (2.12%) SC Cleared
7 21 (1.04%) PMI Certification
8 14 (0.69%) ACCA
9 13 (0.64%) CIMA
10 7 (0.35%) AAT
11 6 (0.30%) Master's Degree
12 5 (0.25%) Chartered Engineer
12 5 (0.25%) PMP
12 5 (0.25%) PRINCE2 Practitioner
13 4 (0.20%) APMP
13 4 (0.20%) AWS Certification
13 4 (0.20%) CompTIA CySA+
13 4 (0.20%) CompTIA Security+
13 4 (0.20%) Computer Science Degree
13 4 (0.20%) ITIL Foundation Certificate
Quality Assurance & Compliance
1 237 (11.69%) NCSC
2 48 (2.37%) ISO/IEC 15288
3 34 (1.68%) SLA
4 19 (0.94%) Data Quality
5 18 (0.89%) QA
6 10 (0.49%) Accessibility
6 10 (0.49%) PMO
7 9 (0.44%) GDPR
8 5 (0.25%) ISO/IEC 27001
8 5 (0.25%) Sarbanes-Oxley
9 2 (0.099%) NIST
10 1 (0.049%) COBIT
10 1 (0.049%) Cyber Essentials
10 1 (0.049%) ECSS
10 1 (0.049%) ITGC
10 1 (0.049%) PCI DSS
System Software
1 703 (34.66%) Docker
2 264 (13.02%) Hyper-V
3 262 (12.92%) vSphere
4 260 (12.82%) VMware NSX
5 39 (1.92%) Active Directory
6 7 (0.35%) Firmware
7 6 (0.30%) BitLocker
8 3 (0.15%) VMware Infrastructure
9 2 (0.099%) vCloud
9 2 (0.099%) Virtual Desktop
9 2 (0.099%) VMware ESXi
10 1 (0.049%) Microsoft App-V
10 1 (0.049%) NFS
Systems Management
1 691 (34.07%) Ansible
2 310 (15.29%) Terraform
3 50 (2.47%) Kubernetes
4 19 (0.94%) Microsoft Intune
5 11 (0.54%) Autotask
6 7 (0.35%) SCCM
7 5 (0.25%) QRadar
8 4 (0.20%) Grafana
8 4 (0.20%) Prometheus
9 2 (0.099%) Single Sign-On
9 2 (0.099%) Systems Management Server (SMS)
9 2 (0.099%) vCenter Server
10 1 (0.049%) Active Directory Federation Services
10 1 (0.049%) Argo
10 1 (0.049%) FortiGate
10 1 (0.049%) Jamf Pro
10 1 (0.049%) SmoothWall
10 1 (0.049%) WSUS
Vendors
1 381 (18.79%) SAP
2 272 (13.41%) Splunk
3 269 (13.26%) Cisco
4 264 (13.02%) Juniper
5 260 (12.82%) 3PAR
6 170 (8.38%) Microsoft
7 49 (2.42%) IBM
8 25 (1.23%) Salesforce
9 21 (1.04%) Oracle
10 20 (0.99%) Avaloq
11 15 (0.74%) MathWorks
11 15 (0.74%) ServiceNow
12 14 (0.69%) Informatica
12 14 (0.69%) MuleSoft
13 12 (0.59%) Meraki
14 8 (0.39%) Apple
14 8 (0.39%) Concur
14 8 (0.39%) JD Edwards
14 8 (0.39%) McAfee
15 7 (0.35%) HP