Support Engineer Jobs in the UK excluding London

Support Engineer
UK > UK excluding London

The median Support Engineer salary in the UK excluding London is £32,000 per year according to job vacancies posted during the 6 months to 7 May 2024.

The first table below provides salary benchmarking and summary statistics including a comparison to same period in the previous 2 years.

6 months to
7 May 2024
Same period 2023 Same period 2022
Rank 81 122 179
Rank change year-on-year +41 +57 -48
Permanent jobs requiring a Support Engineer 2,227 1,682 1,539
As % of all permanent jobs advertised in the UK excluding London 3.16% 2.79% 2.16%
As % of the Job Titles category 3.33% 3.13% 2.26%
Number of salaries quoted 2,021 1,299 1,360
10th Percentile £24,000 £25,000 £22,500
25th Percentile £26,250 £26,250 £26,250
Median annual salary (50th Percentile) £32,000 £32,000 £31,500
Median % change year-on-year - +1.59% -
75th Percentile £40,000 £38,750 £38,750
90th Percentile £50,000 £47,500 £47,500
UK median annual salary £32,500 £33,740 £33,196
% change year-on-year -3.68% +1.64% -2.36%

All Permanent IT Job Vacancies
UK excluding London

The following table is for comparison with the above and includes summary statistics for all permanent IT job vacancies advertised in the UK excluding London. Most job vacancies include a discernible job title that can be normalized. As such, the figures in the second row provide an indication of the number of permanent jobs in our overall sample.

Permanent vacancies in the UK excluding London with a recognized job title 66,781 53,729 68,078
% of permanent jobs with a recognized job title 94.80% 89.16% 95.76%
Number of salaries quoted 47,253 30,499 42,724
10th Percentile £26,750 £29,750 £28,500
25th Percentile £35,000 £38,750 £37,500
Median annual salary (50th Percentile) £50,000 £53,000 £50,000
Median % change year-on-year -5.66% +6.00% +5.26%
75th Percentile £63,750 £68,750 £66,250
90th Percentile £76,250 £81,251 £80,000
UK median annual salary £52,500 £60,000 £60,000
% change year-on-year -12.50% - +9.09%

Support Engineer
Job Vacancy Trend in the UK excluding London

Job postings that featured Support Engineer in the job title as a proportion of all IT jobs advertised in the UK excluding London.
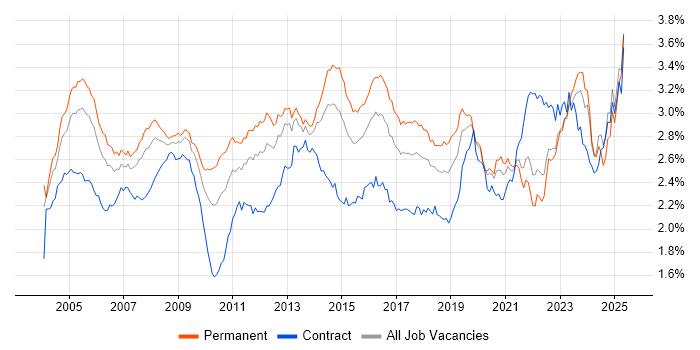
Job vacancy trend for Support Engineer in the UK excluding London

Support Engineer
Salary Trend in the UK excluding London

3-month moving average salary quoted in jobs citing Support Engineer in the UK excluding London.

Salary trend for Support Engineer in the UK excluding London

Support Engineer
Salary Histogram in the UK excluding London

Salary distribution for jobs citing Support Engineer in the UK excluding London over the 6 months to 7 May 2024.

Salary histogram for Support Engineer in the UK excluding London

Support Engineer
Job Locations in the UK excluding London

The table below looks at the demand and provides a guide to the median salaries quoted in IT jobs citing Support Engineer within the UK excluding London region over the 6 months to 7 May 2024. The 'Rank Change' column provides an indication of the change in demand within each location based on the same 6 month period last year.

Location Rank Change
on Same Period
Last Year
Matching
Permanent
IT Job Ads
Median Salary
Past 6 Months
Median Salary
% Change
on Same Period
Last Year
Live
Jobs
South East +22 649 £34,250 +8.73% 141
Midlands +72 408 £30,000 - 101
North of England +50 400 £30,000 -3.70% 108
South West +16 361 £33,000 +1.54% 98
West Midlands +80 228 £30,000 -7.69% 51
East of England +21 220 £31,000 -3.13% 60
East Midlands +30 175 £30,000 +8.11% 50
Yorkshire +73 172 £32,500 +5.69% 30
North West +9 172 £28,000 -8.77% 71
Scotland -50 87 £28,000 -15.15% 26
Wales +45 58 £27,500 -14.06% 12
North East +32 56 £32,500 -5.80% 10
Northern Ireland +35 34 £35,000 - 9
Isle of Man - 12 £43,750 -
Support Engineer
UK

Support Engineer Skill Set
Top 30 Co-occurring Skills and Capabilities in the UK excluding London

For the 6 months to 7 May 2024, Support Engineer job roles required the following skills and capabilities in order of popularity. The figures indicate the absolute number co-occurrences and as a proportion of all permanent job ads across the UK excluding London region featuring Support Engineer in the job title.

1 1,139 (51.15%) Windows
2 1,005 (45.13%) Microsoft
3 976 (43.83%) Microsoft 365
4 826 (37.09%) Active Directory
5 687 (30.85%) Social Skills
6 686 (30.80%) Azure
7 540 (24.25%) Windows Server
8 500 (22.45%) Customer Service
9 426 (19.13%) Problem-Solving
10 422 (18.95%) Firewall
11 391 (17.56%) VMware
12 336 (15.09%) ITIL
13 332 (14.91%) Microsoft Exchange
14 329 (14.77%) Windows 10
15 301 (13.52%) SharePoint
16 299 (13.43%) Microsoft Office
17 288 (12.93%) VMware Infrastructure
18 283 (12.71%) Hyper-V
19 259 (11.63%) Entra ID
20 258 (11.59%) SQL
21 246 (11.05%) Degree
21 246 (11.05%) Microsoft Intune
22 241 (10.82%) Linux
23 211 (9.47%) Driving Licence
24 199 (8.94%) Finance
25 197 (8.85%) DNS
26 191 (8.58%) SLA
27 186 (8.35%) SQL Server
28 182 (8.17%) Cisco
29 172 (7.72%) Microsoft Certification

Support Engineer Skill Set
Co-occurring Skills and Capabilities in the UK excluding London by Category

The follow tables expand on the table above by listing co-occurrences grouped by category. The same employment type, locality and period is covered with up to 20 co-occurrences shown in each of the following categories:

Application Platforms
1 332 (14.91%) Microsoft Exchange
2 301 (13.52%) SharePoint
3 26 (1.17%) IIS
4 22 (0.99%) Apache
5 16 (0.72%) Exchange Server 2013
6 13 (0.58%) Confluence
6 13 (0.58%) Exchange Server 2010
7 12 (0.54%) Exchange Server 2007
8 9 (0.40%) WebSphere
9 6 (0.27%) Exchange Server 2000
9 6 (0.27%) SharePoint 2010
9 6 (0.27%) SharePoint 2013
9 6 (0.27%) Tomcat
9 6 (0.27%) WordPress
10 4 (0.18%) JBoss
11 3 (0.13%) Jupyter
12 2 (0.090%) Blackberry Enterprise Server
12 2 (0.090%) CMS
12 2 (0.090%) Exchange Server 2003
12 2 (0.090%) Skype for Business
Applications
1 299 (13.43%) Microsoft Office
2 92 (4.13%) Microsoft Excel
3 38 (1.71%) Microsoft PowerPoint
4 8 (0.36%) Spreadsheet
5 4 (0.18%) Microsoft Project
6 3 (0.13%) InfoPath
6 3 (0.13%) Trello
7 2 (0.090%) AutoCAD
7 2 (0.090%) Revit
8 1 (0.045%) MS Visio
Business Applications
1 5 (0.22%) Sage X3
2 4 (0.18%) Salesforce CRM
3 3 (0.13%) Dynamics CRM
4 2 (0.090%) Oracle Receivables
4 2 (0.090%) Remedy ITSM
5 1 (0.045%) Dynamics AX
5 1 (0.045%) Dynamics NAV
5 1 (0.045%) JDE EnterpriseOne
5 1 (0.045%) Payment Gateway
5 1 (0.045%) SAP ERP
Cloud Services
1 976 (43.83%) Microsoft 365
2 686 (30.80%) Azure
3 259 (11.63%) Entra ID
4 123 (5.52%) OneDrive
5 114 (5.12%) AWS
6 45 (2.02%) GCP
7 37 (1.66%) SaaS
8 29 (1.30%) Google Workspace
9 28 (1.26%) IaaS
9 28 (1.26%) Mimecast
10 20 (0.90%) Power Platform
11 19 (0.85%) PaaS
12 17 (0.76%) OpenShift
13 16 (0.72%) Dynamics 365
14 12 (0.54%) WhatsApp
15 10 (0.45%) Azure Sentinel
16 8 (0.36%) Power Automate
17 7 (0.31%) Cloud Computing
17 7 (0.31%) PowerApps
18 6 (0.27%) Serverless
Communications & Networking
1 422 (18.95%) Firewall
2 197 (8.85%) DNS
3 165 (7.41%) DHCP
4 155 (6.96%) WAN
5 149 (6.69%) TCP/IP
6 147 (6.60%) Wi-Fi
7 140 (6.29%) LAN
8 136 (6.11%) VPN
9 127 (5.70%) Wireless
10 121 (5.43%) VoIP
11 113 (5.07%) SAN
12 99 (4.45%) VLAN
13 71 (3.19%) Remote Desktop
14 60 (2.69%) Internet
15 45 (2.02%) Network Security
16 25 (1.12%) NAS
17 22 (0.99%) Ethernet
17 22 (0.99%) PBX
18 18 (0.81%) Broadband
19 17 (0.76%) LTE
Database & Business Intelligence
1 186 (8.35%) SQL Server
2 57 (2.56%) MySQL
3 56 (2.51%) Amazon RDS
4 22 (0.99%) PostgreSQL
5 21 (0.94%) MongoDB
6 15 (0.67%) Relational Database
7 10 (0.45%) DB2
7 10 (0.45%) MariaDB
8 6 (0.27%) Power BI
9 5 (0.22%) Pentaho
10 4 (0.18%) Azure SQL Database
10 4 (0.18%) GIS
10 4 (0.18%) Oracle Database
11 3 (0.13%) Metabase
12 2 (0.090%) Crystal Reports
12 2 (0.090%) Oracle Reports
12 2 (0.090%) SQL Server Analysis Services
12 2 (0.090%) SQL Server Integration Services
12 2 (0.090%) SQL Server Reporting Services
13 1 (0.045%) SQLPlus
Development Applications
1 58 (2.60%) JIRA
2 17 (0.76%) IBM UrbanCode
3 14 (0.63%) Eclipse
4 6 (0.27%) Bitbucket
5 3 (0.13%) GitLab
5 3 (0.13%) Octopus Deploy
5 3 (0.13%) TeamCity
5 3 (0.13%) Visual Studio Code
6 2 (0.090%) Git
6 2 (0.090%) HP UFT
6 2 (0.090%) Hudson
6 2 (0.090%) IntelliJ
6 2 (0.090%) JMeter
6 2 (0.090%) LoadRunner
6 2 (0.090%) MSTest
6 2 (0.090%) Selenium
6 2 (0.090%) Team Foundation Server
6 2 (0.090%) Visual Studio
7 1 (0.045%) Gradle
7 1 (0.045%) Jenkins
General
1 687 (30.85%) Social Skills
2 199 (8.94%) Finance
3 146 (6.56%) Analytical Skills
4 140 (6.29%) Telecoms
5 126 (5.66%) Manufacturing
6 122 (5.48%) Organisational Skills
7 84 (3.77%) Law
8 56 (2.51%) Documentation Skills
9 44 (1.98%) Electronics
10 42 (1.89%) Public Sector
10 42 (1.89%) Retail
11 39 (1.75%) Inclusion and Diversity
11 39 (1.75%) Marketing
12 36 (1.62%) Legal
13 24 (1.08%) Military
14 22 (0.99%) Banking
14 22 (0.99%) Presentation Skills
15 18 (0.81%) Automotive
16 17 (0.76%) Games
17 15 (0.67%) Back Office
Libraries, Frameworks & Software Standards
1 44 (1.98%) .NET
2 42 (1.89%) REST
3 39 (1.75%) Web Services
4 34 (1.53%) SOAP
5 32 (1.44%) CSS
5 32 (1.44%) HTML
6 18 (0.81%) XML
7 13 (0.58%) Ajax
7 13 (0.58%) AngularJS
7 13 (0.58%) JDBC
7 13 (0.58%) ODBC
7 13 (0.58%) XHTML
8 11 (0.49%) Kafka
9 9 (0.40%) LAPP Stack
10 7 (0.31%) 802.1X
10 7 (0.31%) HTML5
11 6 (0.27%) COM
12 5 (0.22%) WebRTC
13 4 (0.18%) CSS3
13 4 (0.18%) React
Miscellaneous
1 211 (9.47%) Driving Licence
2 59 (2.65%) Self-Motivation
3 58 (2.60%) Replication
4 47 (2.11%) Clustering
5 43 (1.93%) Data Centre
6 41 (1.84%) Management Information System
7 36 (1.62%) Onboarding
8 33 (1.48%) Fat Client
8 33 (1.48%) Thin Client
9 32 (1.44%) Public Cloud
10 30 (1.35%) Enterprise Storage
11 27 (1.21%) Enterprise Software
12 26 (1.17%) CCTV
13 20 (0.90%) iPhone
14 16 (0.72%) Client/Server
14 16 (0.72%) Smartphone
15 13 (0.58%) CMDB
15 13 (0.58%) iPad
15 13 (0.58%) PKI
16 11 (0.49%) Linux Command Line
Operating Systems
1 1,139 (51.15%) Windows
2 540 (24.25%) Windows Server
3 329 (14.77%) Windows 10
4 241 (10.82%) Linux
5 111 (4.98%) Mac OS
6 108 (4.85%) Windows Server 2012
7 90 (4.04%) Windows Server 2016
8 75 (3.37%) Windows Server 2019
9 61 (2.74%) Android
10 59 (2.65%) Windows 7
11 50 (2.25%) Apple iOS
12 33 (1.48%) AIX
12 33 (1.48%) Unix
13 29 (1.30%) Windows Server 2008
14 22 (0.99%) CentOS
15 20 (0.90%) Windows 8
16 16 (0.72%) Ubuntu
17 10 (0.45%) Mac OS X
17 10 (0.45%) VMS
18 9 (0.40%) Debian
Processes & Methodologies
1 500 (22.45%) Customer Service
2 426 (19.13%) Problem-Solving
3 336 (15.09%) ITIL
4 155 (6.96%) Infrastructure Engineering
5 103 (4.63%) Incident Management
6 102 (4.58%) Cybersecurity
7 94 (4.22%) Continuous Improvement
8 90 (4.04%) Customer Experience
9 88 (3.95%) Service Delivery
10 87 (3.91%) Mentoring
11 86 (3.86%) Service Management
12 81 (3.64%) Customer Requirements
13 79 (3.55%) Agile
14 73 (3.28%) Time Management
15 62 (2.78%) Project Delivery
16 61 (2.74%) Computer Science
17 56 (2.51%) Change Management
18 54 (2.42%) Break/Fix
18 54 (2.42%) Migration
19 53 (2.38%) Problem Management
Programming Languages
1 258 (11.59%) SQL
2 127 (5.70%) PowerShell
3 60 (2.69%) Java
4 55 (2.47%) C#
5 51 (2.29%) Python
6 38 (1.71%) VB
7 35 (1.57%) JavaScript
8 25 (1.12%) C
9 24 (1.08%) C++
10 17 (0.76%) Bash
10 17 (0.76%) Groovy
11 16 (0.72%) PL/SQL
12 14 (0.63%) Perl
13 9 (0.40%) ActionScript
13 9 (0.40%) Shell Script
13 9 (0.40%) T-SQL
14 8 (0.36%) PHP
15 5 (0.22%) VBA
16 4 (0.18%) VBScript
17 3 (0.13%) Apex Code
Qualifications
1 246 (11.05%) Degree
2 172 (7.72%) Microsoft Certification
3 156 (7.00%) Security Cleared
4 83 (3.73%) SC Cleared
5 81 (3.64%) Cisco Certification
6 78 (3.50%) CCNA
7 68 (3.05%) DBS Check
8 53 (2.38%) Computer Science Degree
9 47 (2.11%) A+ Certification
10 45 (2.02%) MCP
11 44 (1.98%) DV Cleared
12 43 (1.93%) ITIL Certification
13 41 (1.84%) Network+ Certification
14 36 (1.62%) Azure Certification
15 32 (1.44%) HNC
16 29 (1.30%) MCSE
17 20 (0.90%) BPSS Clearance
17 20 (0.90%) HND
18 18 (0.81%) MCSA
19 14 (0.63%) MCITP
Quality Assurance & Compliance
1 191 (8.58%) SLA
2 56 (2.51%) GDPR
3 19 (0.85%) Cyber Essentials
3 19 (0.85%) PCI DSS
4 11 (0.49%) ISO/IEC 27001
5 6 (0.27%) QA
6 4 (0.18%) Accessibility
7 2 (0.090%) ISO 14001
7 2 (0.090%) ISO 9001
7 2 (0.090%) NIST
8 1 (0.045%) GxP
System Software
1 826 (37.09%) Active Directory
2 288 (12.93%) VMware Infrastructure
3 283 (12.71%) Hyper-V
4 64 (2.87%) VMware ESXi
5 36 (1.62%) vSphere
6 26 (1.17%) Virtual Desktop
7 21 (0.94%) KVM
8 18 (0.81%) Firmware
8 18 (0.81%) Virtual Machines
8 18 (0.81%) XenApp
9 13 (0.58%) Terminal Services
10 11 (0.49%) Docker
11 9 (0.40%) OpenSSH
12 8 (0.36%) VMware Workstation
13 7 (0.31%) XenDesktop
14 6 (0.27%) NFS
15 5 (0.22%) Virtual Servers
15 5 (0.22%) VMware NSX
16 4 (0.18%) Citrix Hypervisor
17 3 (0.13%) GPFS
Systems Management
1 246 (11.05%) Microsoft Intune
2 120 (5.39%) SCCM
3 24 (1.08%) vCenter Server
4 23 (1.03%) Jamf Pro
5 19 (0.85%) Ansible
6 17 (0.76%) Backup Exec
6 17 (0.76%) Progress Chef
6 17 (0.76%) Terraform
7 13 (0.58%) Cisco CUCM
7 13 (0.58%) NetBackup
7 13 (0.58%) ServiceCenter
7 13 (0.58%) WMI
8 10 (0.45%) Autotask
8 10 (0.45%) Failover Clustering
8 10 (0.45%) Grafana
8 10 (0.45%) SCOM
9 9 (0.40%) IBM BigFix
9 9 (0.40%) PowerCLI
10 8 (0.36%) Microsoft Data Protection Manager
10 8 (0.36%) SCDPM
Vendors
1 1,005 (45.13%) Microsoft
2 391 (17.56%) VMware
3 182 (8.17%) Cisco
4 152 (6.83%) Citrix
5 121 (5.43%) Veeam
6 96 (4.31%) HP
7 92 (4.13%) Apple
8 72 (3.23%) Dell
9 68 (3.05%) Oracle
10 64 (2.87%) Sophos
11 61 (2.74%) Google
12 48 (2.16%) Meraki
13 47 (2.11%) IBM
14 33 (1.48%) Draytek
15 31 (1.39%) Fortinet
16 30 (1.35%) SAP
17 29 (1.30%) ConnectWise
18 26 (1.17%) ServiceNow
18 26 (1.17%) Splunk
19 25 (1.12%) Aruba