Web Development Jobs in England

Web Development
UK > England

The table below provides summary statistics for permanent job vacancies advertised in England requiring Web Development skills. It includes a benchmarking guide to the annual salaries offered in vacancies that cited Web Development over the 6 months leading up to 28 May 2025, comparing them to the same period in the previous two years.

6 months to
28 May 2025
Same period 2024 Same period 2023
Rank 356 147 209
Rank change year-on-year -209 +62 -57
Permanent jobs citing Web Development 370 1,717 1,509
As % of all permanent jobs advertised in England 0.76% 1.94% 1.73%
As % of the Processes & Methodologies category 0.81% 2.31% 1.81%
Number of salaries quoted 311 1,111 1,059
10th Percentile £32,500 £29,750 £35,000
25th Percentile £40,000 £35,000 £40,000
Median annual salary (50th Percentile) £55,000 £50,000 £53,500
Median % change year-on-year +10.00% -6.54% +7.00%
75th Percentile £70,000 £62,500 £70,000
90th Percentile £90,000 £73,750 £85,000
UK median annual salary £55,000 £50,000 £52,907
% change year-on-year +10.00% -5.49% +5.81%

All Process and Methodology Skills
England

Web Development falls under the Processes and Methodologies category. For comparison with the information above, the following table provides summary statistics for all permanent job vacancies requiring process or methodology skills in England.

Permanent vacancies with a requirement for process or methodology skills 45,477 74,482 83,229
As % of all permanent jobs advertised in England 94.01% 84.24% 95.56%
Number of salaries quoted 22,533 54,432 49,691
10th Percentile £29,625 £29,000 £34,375
25th Percentile £41,250 £40,000 £46,105
Median annual salary (50th Percentile) £57,500 £55,000 £62,500
Median % change year-on-year +4.55% -12.00% +4.17%
75th Percentile £75,000 £72,500 £82,500
90th Percentile £98,695 £93,750 £102,500
UK median annual salary £57,500 £55,000 £61,000
% change year-on-year +4.55% -9.84% +1.67%

Web Development
Job Vacancy Trend in England

Job postings citing Web Development as a proportion of all IT jobs advertised in England.
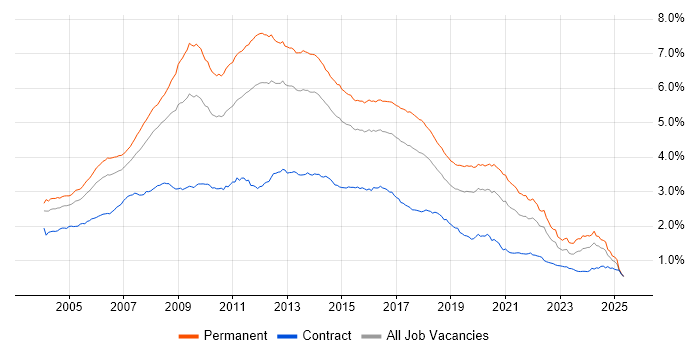
Job vacancy trend for Web Development in England

Web Development
Salary Trend in England

3-month moving average salary quoted in jobs citing Web Development in England.

Salary trend for Web Development in England

Web Development
Salary Histogram in England

Salary distribution for jobs citing Web Development in England over the 6 months to 28 May 2025.

Salary histogram for Web Development in England

Web Development
Job Locations in England

The table below looks at the demand and provides a guide to the median salaries quoted in IT jobs citing Web Development within the England region over the 6 months to 28 May 2025. The 'Rank Change' column provides an indication of the change in demand within each location based on the same 6 month period last year.

Location Rank Change
on Same Period
Last Year
Matching
Permanent
IT Job Ads
Median Salary
Past 6 Months
Median Salary
% Change
on Same Period
Last Year
Live
Jobs
London +12 104 £65,000 +8.33% 286
North of England -177 82 £50,000 +11.11% 430
South East -125 49 £52,500 - 497
North West -157 49 £47,500 +5.56% 196
Midlands -128 45 £45,000 +5.88% 341
South West -19 42 £70,000 +47.37% 201
East of England -46 37 £45,000 +12.50% 283
West Midlands -23 30 £52,000 +22.35% 196
Yorkshire -51 27 £70,000 +55.56% 167
East Midlands -91 15 £35,000 -17.65% 124
North East +20 6 £55,000 +29.41% 68
Web Development
UK

Web Development
Co-occurring Skills and Capabilities in England by Category

The follow tables expand on the table above by listing co-occurrences grouped by category. The same employment type, locality and period is covered with up to 20 co-occurrences shown in each of the following categories:

Application Platforms
1 83 (22.43%) CMS
2 41 (11.08%) WordPress
3 20 (5.41%) Umbraco
4 12 (3.24%) Headless CMS
5 11 (2.97%) nginx
6 9 (2.43%) Kentico
7 8 (2.16%) Confluence
8 7 (1.89%) Drupal
9 3 (0.81%) Adobe Experience Manager
9 3 (0.81%) Apache Airflow
9 3 (0.81%) IIS
10 2 (0.54%) Joomla!
10 2 (0.54%) SharePoint
10 2 (0.54%) Sitecore CMS
11 1 (0.27%) Apache
11 1 (0.27%) DNN
11 1 (0.27%) NServiceBus
11 1 (0.27%) Sitefinity
11 1 (0.27%) Strapi
Applications
1 9 (2.43%) Photoshop
2 8 (2.16%) Microsoft Excel
2 8 (2.16%) Microsoft Office
3 6 (1.62%) Adobe XD
4 4 (1.08%) InDesign
5 3 (0.81%) Adobe Illustrator
5 3 (0.81%) Chatbot
6 2 (0.54%) Microsoft Project
6 2 (0.54%) Sketch
7 1 (0.27%) Adobe Creative Suite
7 1 (0.27%) Microsoft PowerPoint
7 1 (0.27%) MS Visio
7 1 (0.27%) Zeplin
Business Applications
1 24 (6.49%) Shopify
2 9 (2.43%) Payment Gateway
3 8 (2.16%) Oracle EBS
4 4 (1.08%) Dynamics CRM
Cloud Services
1 85 (22.97%) AWS
2 71 (19.19%) Azure
3 36 (9.73%) GCP
4 33 (8.92%) GitHub
5 31 (8.38%) Azure DevOps
6 27 (7.30%) Power Platform
7 23 (6.22%) SaaS
8 21 (5.68%) Dynamics 365
9 19 (5.14%) Serverless
10 17 (4.59%) Cloud Computing
10 17 (4.59%) PowerApps
11 15 (4.05%) Google Analytics
12 13 (3.51%) Figma
13 11 (2.97%) AWS Lambda
13 11 (2.97%) Azure Logic Apps
13 11 (2.97%) Zapier
14 10 (2.70%) Amazon EC2
14 10 (2.70%) Slack
15 8 (2.16%) Amazon S3
15 8 (2.16%) Google Tag Manager
Communications & Networking
1 20 (5.41%) Intranet
2 8 (2.16%) HTTP
3 3 (0.81%) TCP/IP
4 2 (0.54%) DNS
4 2 (0.54%) Internet
4 2 (0.54%) Remote Desktop
4 2 (0.54%) SMS
4 2 (0.54%) Wireshark
5 1 (0.27%) Broadband
Database & Business Intelligence
1 68 (18.38%) MySQL
2 58 (15.68%) SQL Server
3 23 (6.22%) PostgreSQL
3 23 (6.22%) Relational Database
4 11 (2.97%) NoSQL
5 7 (1.89%) Amazon RDS
5 7 (1.89%) MongoDB
5 7 (1.89%) Redis
6 6 (1.62%) RDBMS
7 5 (1.35%) Looker
7 5 (1.35%) Power BI
7 5 (1.35%) SQL Server Integration Services
8 3 (0.81%) GIS
8 3 (0.81%) Metadata
9 2 (0.54%) DynamoDB
9 2 (0.54%) Elasticsearch
9 2 (0.54%) Mixpanel
9 2 (0.54%) SQL Server Reporting Services
10 1 (0.27%) Data Warehouse
10 1 (0.27%) SQL Server Analysis Services
Development Applications
1 120 (32.43%) Git
2 29 (7.84%) JIRA
3 19 (5.14%) Visual Studio
4 12 (3.24%) webpack
5 11 (2.97%) NUnit
6 10 (2.70%) Jenkins
7 9 (2.43%) Selenium
8 8 (2.16%) gulp
8 8 (2.16%) JUnit
8 8 (2.16%) Postman
9 6 (1.62%) GitLab
9 6 (1.62%) Mocha
10 5 (1.35%) Cypress.io
10 5 (1.35%) Jasmine
10 5 (1.35%) Vite
11 4 (1.08%) Bitbucket
11 4 (1.08%) Grunt
11 4 (1.08%) PHPUnit
11 4 (1.08%) Visual Studio Code
12 3 (0.81%) SpecFlow
General
1 127 (34.32%) Social Skills
2 67 (18.11%) Finance
3 54 (14.59%) Marketing
4 33 (8.92%) Analytical Skills
5 29 (7.84%) Retail
6 24 (6.49%) Games
7 22 (5.95%) Organisational Skills
8 19 (5.14%) Inclusion and Diversity
9 12 (3.24%) Law
10 11 (2.97%) Advertising
11 10 (2.70%) Tech for Good
12 7 (1.89%) Legal
13 6 (1.62%) Banking
13 6 (1.62%) Financial Institution
14 5 (1.35%) Public Sector
15 4 (1.08%) Front Office
15 4 (1.08%) iGaming
15 4 (1.08%) Telecoms
16 3 (0.81%) Manufacturing
16 3 (0.81%) Retail Banking
Job Titles
1 243 (65.68%) Developer
2 68 (18.38%) Web Developer
3 62 (16.76%) Senior
4 48 (12.97%) Senior Developer
5 47 (12.70%) Full-Stack Developer
6 36 (9.73%) Lead
7 35 (9.46%) Front-End Developer (Client-Side Developer)
8 31 (8.38%) .NET Developer
9 29 (7.84%) PHP Developer
10 25 (6.76%) C# Developer
11 24 (6.49%) Software Engineer
12 19 (5.14%) Umbraco Developer
13 18 (4.86%) Senior Full-Stack Developer
14 17 (4.59%) C# .NET Developer
15 14 (3.78%) PHP Web Developer
15 14 (3.78%) Python Developer
16 13 (3.51%) Front-End Web Developer (Client-Side Web Developer)
17 12 (3.24%) Full-Stack C# Developer
17 12 (3.24%) Project Manager
17 12 (3.24%) Web Manager
Libraries, Frameworks & Software Standards
1 199 (53.78%) HTML
2 192 (51.89%) CSS
3 106 (28.65%) React
4 96 (25.95%) .NET
5 67 (18.11%) Node.js
6 55 (14.86%) AngularJS
6 55 (14.86%) HTML5
7 49 (13.24%) jQuery
8 48 (12.97%) Laravel
9 37 (10.00%) Vue
10 35 (9.46%) RESTful
11 29 (7.84%) ASP.NET
12 28 (7.57%) JSON
13 25 (6.76%) CSS3
13 25 (6.76%) LAMP
13 25 (6.76%) REST
14 20 (5.41%) Jest
15 19 (5.14%) .NET Core
15 19 (5.14%) Bootstrap
15 19 (5.14%) Django
Miscellaneous
1 34 (9.19%) Mobile App
2 20 (5.41%) Product Ownership
3 18 (4.86%) NHS
4 13 (3.51%) Management Information System
5 11 (2.97%) Greenfield Project
6 9 (2.43%) Client/Server
7 8 (2.16%) Learning Management System
7 8 (2.16%) Onboarding
7 8 (2.16%) Social Media
8 7 (1.89%) Virtual Team
9 6 (1.62%) Cloud Native
9 6 (1.62%) Data Structures
9 6 (1.62%) Reinsurance
10 5 (1.35%) Marketing Technology
10 5 (1.35%) Self-Motivation
11 4 (1.08%) Enterprise Software
11 4 (1.08%) EPoS
11 4 (1.08%) Hackathon
11 4 (1.08%) Renewable Energy
12 3 (0.81%) Foreign Exchange (FX)
Operating Systems
1 21 (5.68%) Linux
2 12 (3.24%) Windows
3 6 (1.62%) Android
4 5 (1.35%) Apple iOS
5 3 (0.81%) Ubuntu
6 2 (0.54%) Mac OS
6 2 (0.54%) Unix
Processes & Methodologies
1 120 (32.43%) Problem-Solving
2 102 (27.57%) Agile
3 92 (24.86%) E-Commerce
4 90 (24.32%) Full-Stack Development
5 73 (19.73%) DevOps
6 71 (19.19%) Software Engineering
7 68 (18.38%) User Experience
8 62 (16.76%) CI/CD
9 60 (16.22%) OOP
10 57 (15.41%) Content Management
11 56 (15.14%) Mentoring
11 56 (15.14%) MVC
11 56 (15.14%) SEO
12 52 (14.05%) Front End Development
13 47 (12.70%) Computer Science
13 47 (12.70%) Project Management
14 40 (10.81%) Analytics
15 36 (9.73%) Scrum
16 33 (8.92%) OO
17 32 (8.65%) UX Design
Programming Languages
1 198 (53.51%) JavaScript
2 107 (28.92%) PHP
3 99 (26.76%) C#
4 86 (23.24%) SQL
5 68 (18.38%) Python
6 50 (13.51%) TypeScript
7 28 (7.57%) Java
8 8 (2.16%) C++
9 3 (0.81%) Delphi
9 3 (0.81%) Go
9 3 (0.81%) R
9 3 (0.81%) T-SQL
10 2 (0.54%) Bash
10 2 (0.54%) Kotlin
10 2 (0.54%) Ruby
11 1 (0.27%) Apex Code
11 1 (0.27%) Rust
11 1 (0.27%) Shell Script
11 1 (0.27%) Swift
11 1 (0.27%) VBScript
Qualifications
1 96 (25.95%) Degree
2 32 (8.65%) Computer Science Degree
3 10 (2.70%) SC Cleared
3 10 (2.70%) Security Cleared
4 6 (1.62%) BPSS Clearance
4 6 (1.62%) Master's Degree
5 2 (0.54%) ISTQB
5 2 (0.54%) TOGAF Certification
6 1 (0.27%) PMI Certification
Quality Assurance & Compliance
1 68 (18.38%) Accessibility
2 30 (8.11%) WCAG
3 21 (5.68%) GDPR
4 19 (5.14%) QA
5 4 (1.08%) Data Quality
6 3 (0.81%) Actionable Recommendations
System Software
1 43 (11.62%) Docker
2 3 (0.81%) Samba
3 1 (0.27%) Embedded Firmware
3 1 (0.27%) Firmware
Systems Management
1 36 (9.73%) Kubernetes
2 6 (1.62%) Terraform
3 4 (1.08%) HAProxy
4 2 (0.54%) Grafana
4 2 (0.54%) Prometheus
5 1 (0.27%) Matomo
Vendors
1 61 (16.49%) Microsoft
2 27 (7.30%) Google
3 18 (4.86%) HP
4 15 (4.05%) Adobe
4 15 (4.05%) Oracle
5 11 (2.97%) WooCommerce
6 8 (2.16%) Okta
7 7 (1.89%) Databricks
8 5 (1.35%) Screaming Frog
8 5 (1.35%) Twitter
9 4 (1.08%) Facebook
9 4 (1.08%) Optimizely
10 3 (0.81%) Borland
10 3 (0.81%) PayPal
11 2 (0.54%) ANSYS
11 2 (0.54%) BT
11 2 (0.54%) Instagram
11 2 (0.54%) Sitecore
11 2 (0.54%) YouTube
12 1 (0.27%) Ahrefs