Fintech Jobs in England

Financial Technology (FinTech)
UK > England

The following table provides summary statistics for permanent job vacancies advertised in England with a requirement for Fintech skills. Included is a benchmarking guide to the salaries offered in vacancies that have cited Fintech over the 6 months to 10 May 2024 with a comparison to the same period in the previous 2 years.

6 months to
10 May 2024
Same period 2023 Same period 2022
Rank 148 106 68
Rank change year-on-year -42 -38 -16
Permanent jobs citing Fintech 1,629 2,868 6,824
As % of all permanent jobs advertised in England 1.90% 3.19% 5.13%
As % of the Processes & Methodologies category 2.22% 3.33% 5.36%
Number of salaries quoted 1,361 2,464 4,301
10th Percentile £42,500 £47,875 £45,000
25th Percentile £58,750 £60,000 £52,500
Median annual salary (50th Percentile) £77,500 £85,000 £72,500
Median % change year-on-year -8.82% +17.24% +3.57%
75th Percentile £100,000 £105,000 £95,000
90th Percentile £117,500 £118,250 £115,000
UK median annual salary £77,500 £82,500 £70,000
% change year-on-year -6.06% +17.86% -

All Process and Methodology Skills
England

Fintech is in the Processes and Methodologies category. The following table is for comparison with the above and provides summary statistics for all permanent job vacancies advertised in England with a requirement for process or methodology skills.

Permanent vacancies with a requirement for process or methodology skills 73,404 86,015 127,257
As % of all permanent jobs advertised in England 85.48% 95.62% 95.74%
Number of salaries quoted 53,973 50,951 72,982
10th Percentile £29,000 £34,250 £33,500
25th Percentile £40,000 £46,000 £44,075
Median annual salary (50th Percentile) £55,000 £62,500 £60,000
Median % change year-on-year -12.00% +4.17% +9.09%
75th Percentile £73,410 £82,500 £80,000
90th Percentile £93,750 £101,250 £97,500
UK median annual salary £55,000 £61,190 £60,000
% change year-on-year -10.12% +1.98% +9.09%

Fintech
Job Vacancy Trend in England

Job postings citing Fintech as a proportion of all IT jobs advertised in England.
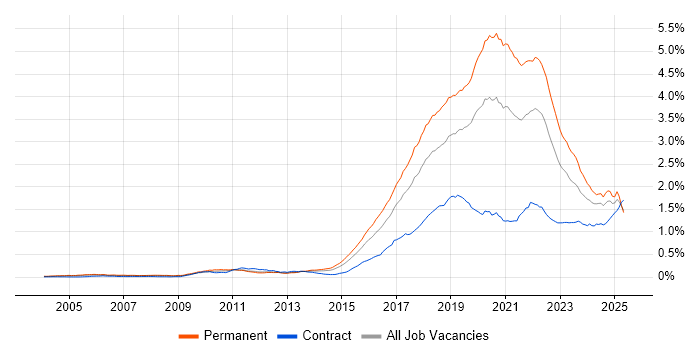
Job vacancy trend for Fintech in England

Fintech
Salary Trend in England

3-month moving average salary quoted in jobs citing Fintech in England.

Salary trend for Fintech in England

Fintech
Salary Histogram in England

Salary distribution for jobs citing Fintech in England over the 6 months to 10 May 2024.

Salary histogram for Fintech in England

Fintech
Job Locations in England

The table below looks at the demand and provides a guide to the median salaries quoted in IT jobs citing Fintech within the England region over the 6 months to 10 May 2024. The 'Rank Change' column provides an indication of the change in demand within each location based on the same 6 month period last year.

Location Rank Change
on Same Period
Last Year
Matching
Permanent
IT Job Ads
Median Salary
Past 6 Months
Median Salary
% Change
on Same Period
Last Year
Live
Jobs
London -10 1,078 £85,000 -5.56% 497
North of England +64 188 £55,000 -8.33% 63
South West 0 132 £62,500 -7.41% 26
North West +22 130 £60,000 - 46
South East -131 97 £67,500 -10.00% 51
Midlands -43 75 £55,000 -4.35% 27
West Midlands -36 47 £45,000 -25.00% 16
East of England -9 44 £62,500 +8.70% 7
Yorkshire +81 38 £50,000 -16.67% 13
East Midlands -9 28 £65,000 +23.81% 11
North East -7 20 £53,750 -4.44% 4
Fintech
UK

Fintech
Co-occurring Skills and Capabilities in England by Category

The follow tables expand on the table above by listing co-occurrences grouped by category. The same employment type, locality and period is covered with up to 20 co-occurrences shown in each of the following categories:

Application Platforms
1 47 (2.89%) Confluence
2 32 (1.96%) Apache
3 30 (1.84%) Apache Airflow
4 16 (0.98%) CMS
4 16 (0.98%) nginx
5 15 (0.92%) SAS
6 9 (0.55%) Drupal
6 9 (0.55%) SharePoint
7 7 (0.43%) WordPress
8 6 (0.37%) Microsoft Exchange
9 5 (0.31%) Apache Spark
9 5 (0.31%) BizTalk Server
10 3 (0.18%) Apache Pulsar
10 3 (0.18%) Ethereum
10 3 (0.18%) Exchange Server 2013
11 2 (0.12%) Cloud Foundry
11 2 (0.12%) Hyperledger
11 2 (0.12%) Umbraco
Applications
1 23 (1.41%) Microsoft Excel
2 21 (1.29%) Microsoft Office
3 15 (0.92%) SPSS
4 14 (0.86%) Microsoft PowerPoint
5 2 (0.12%) Microsoft Project
5 2 (0.12%) S-PLUS
6 1 (0.061%) MS Visio
Business Applications
1 14 (0.86%) Aladdin
2 13 (0.80%) Payment Gateway
3 7 (0.43%) Distributed Ledger
3 7 (0.43%) Fidessa
4 4 (0.25%) Relativity
5 2 (0.12%) Dynamics CRM
5 2 (0.12%) NetSuite
5 2 (0.12%) R3 Corda
5 2 (0.12%) Veritas eDiscovery
6 1 (0.061%) Dynamics NAV
6 1 (0.061%) Ringtail
6 1 (0.061%) Salesforce CRM
Cloud Services
1 629 (38.61%) AWS
2 320 (19.64%) Azure
3 193 (11.85%) GCP
4 118 (7.24%) SaaS
5 76 (4.67%) Serverless
6 53 (3.25%) Azure DevOps
7 40 (2.46%) Microsoft 365
8 33 (2.03%) AWS Lambda
9 23 (1.41%) GitHub
10 21 (1.29%) dbt
10 21 (1.29%) npm
11 20 (1.23%) Amazon S3
12 19 (1.17%) Figma
13 18 (1.10%) Amazon ECS
14 16 (0.98%) Amazon EKS
14 16 (0.98%) Azure Service Bus
14 16 (0.98%) Entra ID
15 15 (0.92%) AWS CloudFormation
15 15 (0.92%) IaaS
15 15 (0.92%) PaaS
Communications & Networking
1 41 (2.52%) Firewall
2 21 (1.29%) DNS
3 17 (1.04%) PBX
4 16 (0.98%) LAN
5 14 (0.86%) TCP/IP
5 14 (0.86%) WAN
6 12 (0.74%) Network Security
7 8 (0.49%) Wi-Fi
8 7 (0.43%) Internet
8 7 (0.43%) OpenVPN
8 7 (0.43%) SD-WAN
9 6 (0.37%) AMQP
9 6 (0.37%) BGP
9 6 (0.37%) Multicast
9 6 (0.37%) OSPF
10 4 (0.25%) Intranet
10 4 (0.25%) Intrusion Detection
10 4 (0.25%) VoIP
11 3 (0.18%) SAN
11 3 (0.18%) WebEx
Database & Business Intelligence
1 110 (6.75%) PostgreSQL
2 95 (5.83%) SQL Server
3 55 (3.38%) MySQL
4 51 (3.13%) MongoDB
5 41 (2.52%) NoSQL
6 40 (2.46%) Relational Database
7 39 (2.39%) Big Data
8 30 (1.84%) Redis
9 26 (1.60%) Apache Ignite
10 25 (1.53%) BigQuery
11 24 (1.47%) Elasticsearch
12 19 (1.17%) Data Warehouse
13 15 (0.92%) EDRMS
14 14 (0.86%) Amazon Athena
14 14 (0.86%) Apache Arrow
14 14 (0.86%) Dremio
15 12 (0.74%) Amazon RDS
15 12 (0.74%) Azure SQL Database
16 11 (0.68%) Amazon Redshift
17 9 (0.55%) Power BI
Development Applications
1 93 (5.71%) Git
2 82 (5.03%) Jenkins
3 71 (4.36%) JIRA
4 46 (2.82%) Cucumber
5 45 (2.76%) Postman
6 42 (2.58%) Selenium
7 32 (1.96%) TeamCity
8 26 (1.60%) GitLab
9 17 (1.04%) Bitbucket
10 16 (0.98%) Maven
11 12 (0.74%) Visual Studio
12 11 (0.68%) Appium
12 11 (0.68%) Storybook
13 10 (0.61%) JMeter
14 9 (0.55%) Cypress.io
14 9 (0.55%) Octopus Deploy
15 8 (0.49%) SonarQube
16 7 (0.43%) git-flow
17 6 (0.37%) Crashlytics
17 6 (0.37%) Mocha
General
1 752 (46.16%) Finance
2 319 (19.58%) Social Skills
3 215 (13.20%) Banking
4 125 (7.67%) Inclusion and Diversity
5 123 (7.55%) Front Office
6 116 (7.12%) Analytical Skills
7 103 (6.32%) Law
8 81 (4.97%) Retail
9 65 (3.99%) Marketing
10 54 (3.31%) Financial Institution
11 53 (3.25%) Legal
12 42 (2.58%) Investment Banking
13 23 (1.41%) Games
14 20 (1.23%) Turkish Language
15 18 (1.10%) Publishing
16 11 (0.68%) Presentation Skills
17 10 (0.61%) Retail Banking
17 10 (0.61%) Retail Finance
18 9 (0.55%) Advertising
18 9 (0.55%) Health Technology
Job Titles
1 580 (35.60%) Developer
2 308 (18.91%) Senior
3 231 (14.18%) Software Engineer
4 204 (12.52%) Lead
5 151 (9.27%) Senior Developer
6 132 (8.10%) .NET Developer
7 129 (7.92%) Analyst
8 116 (7.12%) Java Developer
9 93 (5.71%) Full Stack Developer
10 88 (5.40%) Developer/Software Engineer
11 78 (4.79%) Software Developer
12 63 (3.87%) C# Developer
13 62 (3.81%) .NET Software Developer
14 60 (3.68%) Lead Developer
15 54 (3.31%) React Developer
16 51 (3.13%) Business Analyst
17 50 (3.07%) DevOps Engineer
18 48 (2.95%) Architect
18 48 (2.95%) Senior Software Engineer
19 47 (2.89%) Support Engineer
Libraries, Frameworks & Software Standards
1 275 (16.88%) .NET
2 270 (16.57%) React
3 180 (11.05%) AngularJS
4 134 (8.23%) Vue
5 125 (7.67%) Node.js
6 109 (6.69%) Redux
7 105 (6.45%) CSS
8 102 (6.26%) HTML
9 95 (5.83%) REST
10 89 (5.46%) Spring
11 88 (5.40%) ASP.NET
11 88 (5.40%) Spring Boot
12 85 (5.22%) .NET Core
13 81 (4.97%) Kafka
14 73 (4.48%) .NET Framework
15 53 (3.25%) ASP.NET Web API
16 48 (2.95%) RESTful
17 45 (2.76%) Laravel
18 40 (2.46%) GraphQL
19 38 (2.33%) gRPC
Miscellaneous
1 110 (6.75%) Foreign Exchange (FX)
2 109 (6.69%) Fixed Income
3 91 (5.59%) Greenfield Project
4 90 (5.52%) Product Ownership
5 80 (4.91%) Hedge funds
6 73 (4.48%) Equities
7 72 (4.42%) Derivative
8 48 (2.95%) Onboarding
9 43 (2.64%) Cloud Native
10 40 (2.46%) Blog
11 35 (2.15%) Management Information System
12 34 (2.09%) Enterprise Software
13 32 (1.96%) Self-Motivation
14 30 (1.84%) Blockchain
14 30 (1.84%) Distributed Systems
15 25 (1.53%) Public Cloud
16 22 (1.35%) Data Structures
16 22 (1.35%) Mobile App
17 21 (1.29%) Client/Server
18 19 (1.17%) Data Centre
Operating Systems
1 95 (5.83%) Linux
2 69 (4.24%) Windows
3 31 (1.90%) Android
4 25 (1.53%) Apple iOS
5 21 (1.29%) Unix
6 18 (1.10%) Mac OS
7 11 (0.68%) Windows Server
8 7 (0.43%) CentOS
9 4 (0.25%) Windows 10
10 3 (0.18%) Windows Server 2012
11 2 (0.12%) Red Hat Enterprise Linux
Processes & Methodologies
1 492 (30.20%) Agile
2 358 (21.98%) Software Engineering
3 262 (16.08%) DevOps
4 250 (15.35%) CI/CD
5 225 (13.81%) Full Stack Development
6 207 (12.71%) Problem-Solving
7 185 (11.36%) TDD
8 182 (11.17%) Microservices
9 157 (9.64%) Asset Management
10 156 (9.58%) Computer Science
11 132 (8.10%) Analytics
12 124 (7.61%) Artificial Intelligence
13 121 (7.43%) Test Automation
14 114 (7.00%) Mentoring
15 107 (6.57%) Investment Management
16 105 (6.45%) Roadmaps
17 102 (6.26%) SDLC
18 96 (5.89%) Scrum
19 92 (5.65%) Machine Learning
19 92 (5.65%) MVC
Programming Languages
1 413 (25.35%) Java
2 324 (19.89%) JavaScript
3 301 (18.48%) Python
4 292 (17.93%) C#
5 272 (16.70%) SQL
6 235 (14.43%) TypeScript
7 166 (10.19%) Kotlin
8 65 (3.99%) PHP
9 56 (3.44%) PowerShell
10 50 (3.07%) Scala
11 29 (1.78%) Bash
11 29 (1.78%) C++
12 25 (1.53%) Go
13 19 (1.17%) T-SQL
14 15 (0.92%) Swift
15 13 (0.80%) Rust
16 10 (0.61%) Ruby
17 8 (0.49%) Shell Script
18 7 (0.43%) PL/SQL
19 5 (0.31%) C
Qualifications
1 263 (16.14%) Degree
2 85 (5.22%) Computer Science Degree
3 52 (3.19%) Master's Degree
4 27 (1.66%) Cisco Certification
5 20 (1.23%) AWS Certification
6 18 (1.10%) CCNA
7 16 (0.98%) PhD
8 13 (0.80%) CISSP
9 11 (0.68%) CISM
9 11 (0.68%) Numerate Degree
10 9 (0.55%) AWS Certified Solutions Architect
11 7 (0.43%) CCSP
11 7 (0.43%) Microsoft Certification
12 6 (0.37%) CISA
12 6 (0.37%) CRISC
12 6 (0.37%) ITIL Certification
13 5 (0.31%) GIAC
13 5 (0.31%) HNC
13 5 (0.31%) ISSMP
13 5 (0.31%) MBA
Quality Assurance & Compliance
1 132 (8.10%) QA
2 34 (2.09%) ISO/IEC 27001
3 17 (1.04%) Accessibility
4 14 (0.86%) Data Quality
4 14 (0.86%) SLA
5 12 (0.74%) PCI DSS
6 9 (0.55%) Cyber Essentials
7 8 (0.49%) COBIT
8 7 (0.43%) GDPR
8 7 (0.43%) NIST
8 7 (0.43%) PSD2
8 7 (0.43%) SOC 2
9 5 (0.31%) ISO 20022
10 4 (0.25%) HIPAA
10 4 (0.25%) ISO 9001
10 4 (0.25%) MiFID
10 4 (0.25%) Software Quality Assurance
11 3 (0.18%) NIST 800
11 3 (0.18%) PMO
11 3 (0.18%) UCITS
System Software
1 180 (11.05%) Docker
2 41 (2.52%) Active Directory
3 15 (0.92%) VMware ESXi
4 8 (0.49%) VMware Infrastructure
5 6 (0.37%) Hyper-V
6 5 (0.31%) Virtual Machines
7 3 (0.18%) VMware Server
7 3 (0.18%) VMware Workstation
7 3 (0.18%) vSphere
8 2 (0.12%) Embedded Firmware
8 2 (0.12%) Firmware
9 1 (0.061%) Virtual Desktop
Systems Management
1 200 (12.28%) Terraform
2 195 (11.97%) Kubernetes
3 54 (3.31%) Ansible
4 30 (1.84%) Grafana
5 16 (0.98%) Prometheus
6 7 (0.43%) Kibana
7 6 (0.37%) logstash
8 5 (0.31%) CASB
8 5 (0.31%) Microsoft Intune
8 5 (0.31%) Progress Chef
9 4 (0.25%) Istio
10 3 (0.18%) CSIRT
10 3 (0.18%) SCCM
10 3 (0.18%) Single Sign-On
11 2 (0.12%) Core Impact
11 2 (0.12%) Nmap
11 2 (0.12%) Puppet
12 1 (0.061%) HAProxy
12 1 (0.061%) HP SiteScope
12 1 (0.061%) Jamf Pro
Vendors
1 148 (9.09%) Microsoft
2 48 (2.95%) Google
3 25 (1.53%) VMware
4 24 (1.47%) Atlassian
5 17 (1.04%) Palo Alto
6 16 (0.98%) Bloomberg
7 15 (0.92%) Salesforce
8 14 (0.86%) BISAM
9 13 (0.80%) Cisco
9 13 (0.80%) Splunk
10 12 (0.74%) Oracle
11 10 (0.61%) Adobe
11 10 (0.61%) Meraki
12 8 (0.49%) Murex
13 7 (0.43%) Fortinet
14 6 (0.37%) Amplitude
14 6 (0.37%) AppDynamics
14 6 (0.37%) F5
15 5 (0.31%) Alibaba
15 5 (0.31%) Solace