Legacy Systems Jobs in England

Legacy System
UK > England

The table below looks at the prevalence of the term Legacy Systems in permanent job vacancies in England. Included is a benchmarking guide to the salaries offered in vacancies that cited Legacy Systems over the 6 months leading up to 11 May 2025, comparing them to the same period in the previous two years.

6 months to
11 May 2025
Same period 2024 Same period 2023
Rank 393 520 436
Rank change year-on-year +127 -84 +78
Permanent jobs citing Legacy Systems 321 321 615
As % of all permanent jobs advertised in England 0.66% 0.37% 0.68%
As % of the Miscellaneous category 1.85% 1.08% 1.56%
Number of salaries quoted 191 233 439
10th Percentile £38,750 £36,250 £40,800
25th Percentile £43,125 £47,500 £50,000
Median annual salary (50th Percentile) £57,500 £57,500 £67,500
Median % change year-on-year - -14.81% +12.50%
75th Percentile £80,000 £82,500 £95,000
90th Percentile £105,000 £103,750 £120,000
UK median annual salary £57,500 £60,000 £67,500
% change year-on-year -4.17% -11.11% +12.50%

All Generic Skills
England

Legacy Systems falls under the General and Transferable Skills category. For comparison with the information above, the following table provides summary statistics for all permanent job vacancies requiring generic IT skills in England.

Permanent vacancies with a requirement for generic IT skills 17,327 29,857 39,545
As % of all permanent jobs advertised in England 35.82% 34.77% 43.96%
Number of salaries quoted 8,999 20,876 21,202
10th Percentile £31,250 £28,000 £35,427
25th Percentile £42,500 £38,000 £46,570
Median annual salary (50th Percentile) £60,000 £55,000 £65,000
Median % change year-on-year +9.09% -15.38% +4.00%
75th Percentile £80,000 £75,000 £87,500
90th Percentile £111,250 £100,000 £110,000
UK median annual salary £60,000 £55,000 £65,000
% change year-on-year +9.09% -15.38% +4.00%

Legacy Systems
Job Vacancy Trend in England

Job postings citing Legacy Systems as a proportion of all IT jobs advertised in England.
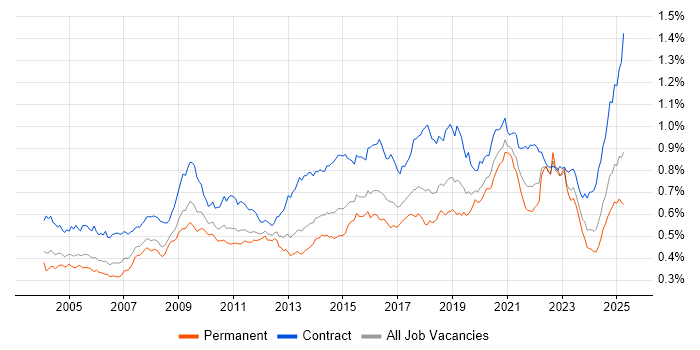
Job vacancy trend for Legacy Systems in England

Legacy Systems
Salary Trend in England

3-month moving average salary quoted in jobs citing Legacy Systems in England.

Salary trend for Legacy Systems in England

Legacy Systems
Salary Histogram in England

Salary distribution for jobs citing Legacy Systems in England over the 6 months to 11 May 2025.

Salary histogram for Legacy Systems in England

Legacy Systems
Job Locations in England

The table below looks at the demand and provides a guide to the median salaries quoted in IT jobs citing Legacy Systems within the England region over the 6 months to 11 May 2025. The 'Rank Change' column provides an indication of the change in demand within each location based on the same 6 month period last year.

Location Rank Change
on Same Period
Last Year
Matching
Permanent
IT Job Ads
Median Salary
Past 6 Months
Median Salary
% Change
on Same Period
Last Year
Live
Jobs
London +129 107 £70,000 -15.15% 202
Midlands +73 73 £45,000 -10.00% 52
West Midlands +86 64 £45,000 -10.00% 34
South East +93 60 £57,500 +9.52% 102
North of England +41 43 £52,500 -4.55% 67
North West -4 29 £52,500 -4.55% 38
South West +117 24 £90,000 +33.33% 36
Yorkshire +63 11 £65,000 +68.83% 19
East Midlands +26 9 £45,000 +16.13% 15
East of England +30 7 £68,454 +95.58% 28
North East +39 3 £29,500 -46.36% 13
Legacy Systems
UK

Legacy Systems
Co-occurring Skills and Capabilities in England by Category

The follow tables expand on the table above by listing co-occurrences grouped by category. The same employment type, locality and period is covered with up to 20 co-occurrences shown in each of the following categories:

Application Platforms
1 9 (2.80%) SharePoint
2 8 (2.49%) Microsoft Exchange
3 7 (2.18%) Apache Airflow
4 6 (1.87%) Confluence
5 4 (1.25%) JBoss
5 4 (1.25%) Luigi
6 3 (0.93%) Oracle SOA Suite
7 2 (0.62%) Apache
8 1 (0.31%) Apache Spark
8 1 (0.31%) CICS
8 1 (0.31%) IIS
8 1 (0.31%) NetWeaver
Applications
1 17 (5.30%) Microsoft Excel
2 4 (1.25%) Microsoft Office
3 3 (0.93%) Microsoft PowerPoint
4 2 (0.62%) Microsoft Project
Business Applications
1 30 (9.35%) NetSuite
2 23 (7.17%) Oracle EBS
3 5 (1.56%) Endur
3 5 (1.56%) SAP S/4HANA
4 3 (0.93%) Dynamics AX
4 3 (0.93%) SAP MDG
5 2 (0.62%) SAP CO
5 2 (0.62%) SAP FI
5 2 (0.62%) SAP FI/CO
6 1 (0.31%) Infor M3
6 1 (0.31%) Oracle Payables
Cloud Services
1 101 (31.46%) Azure
2 61 (19.00%) AWS
3 46 (14.33%) GCP
4 33 (10.28%) Power Platform
5 25 (7.79%) SaaS
6 15 (4.67%) Dynamics 365
6 15 (4.67%) GitHub
6 15 (4.67%) Snowflake
7 14 (4.36%) GitHub Actions
8 10 (3.12%) Microsoft 365
8 10 (3.12%) PowerApps
9 8 (2.49%) dbt
9 8 (2.49%) npm
10 7 (2.18%) Azure DevOps
10 7 (2.18%) Azure Synapse Analytics
10 7 (2.18%) OpenShift
11 5 (1.56%) Amazon EC2
11 5 (1.56%) CloudFront
11 5 (1.56%) PaaS
11 5 (1.56%) Route 53
Communications & Networking
1 8 (2.49%) Firewall
2 6 (1.87%) DHCP
2 6 (1.87%) DNS
2 6 (1.87%) Network Security
2 6 (1.87%) Remote Desktop
2 6 (1.87%) SMTP
3 2 (0.62%) LoRaWAN
4 1 (0.31%) Ethernet
4 1 (0.31%) HTTP
4 1 (0.31%) LAN
4 1 (0.31%) OSPF
4 1 (0.31%) VPN
4 1 (0.31%) WAN
4 1 (0.31%) Wireless
Database & Business Intelligence
1 30 (9.35%) NoSQL
2 26 (8.10%) SQL Server
3 22 (6.85%) Oracle ODI
4 21 (6.54%) Power BI
5 18 (5.61%) MySQL
6 11 (3.43%) BigQuery
7 10 (3.12%) Amazon Redshift
7 10 (3.12%) MongoDB
7 10 (3.12%) PostgreSQL
8 9 (2.80%) Tableau
9 8 (2.49%) Data Warehouse
10 7 (2.18%) SQL Server Integration Services
11 6 (1.87%) Amazon RDS
12 5 (1.56%) DocumentDB
12 5 (1.56%) Redis
13 4 (1.25%) Oracle Database
13 4 (1.25%) Relational Database
13 4 (1.25%) SQL Server Reporting Services
13 4 (1.25%) TimescaleDB
14 3 (0.93%) MS Access
Development Applications
1 35 (10.90%) Git
2 14 (4.36%) JIRA
3 12 (3.74%) Gradle
4 10 (3.12%) Jenkins
5 8 (2.49%) Cucumber
5 8 (2.49%) Cypress.io
5 8 (2.49%) Sonatype Nexus
5 8 (2.49%) webpack
6 7 (2.18%) SonarQube
7 5 (1.56%) Maven
8 4 (1.25%) PHPUnit
9 3 (0.93%) Subversion
10 2 (0.62%) Artifactory
10 2 (0.62%) Gatling
10 2 (0.62%) GitLab
10 2 (0.62%) JMeter
10 2 (0.62%) LSMW
10 2 (0.62%) Octopus Deploy
10 2 (0.62%) SoapUI
10 2 (0.62%) Visual Studio
General
1 134 (41.74%) Social Skills
2 111 (34.58%) Finance
3 72 (22.43%) Analytical Skills
4 43 (13.40%) Law
5 33 (10.28%) Manufacturing
6 31 (9.66%) Banking
7 21 (6.54%) Electronics
8 18 (5.61%) Games
8 18 (5.61%) Public Sector
9 16 (4.98%) Inclusion and Diversity
9 16 (4.98%) Retail
10 13 (4.05%) Presentation Skills
11 9 (2.80%) Marketing
12 8 (2.49%) Front Office
13 7 (2.18%) Legal
14 5 (1.56%) Documentation Skills
14 5 (1.56%) Investment Banking
14 5 (1.56%) Retail Banking
15 3 (0.93%) Back Office
16 2 (0.62%) Military
Job Titles
1 76 (23.68%) Developer
2 54 (16.82%) Lead
3 40 (12.46%) Consultant
4 37 (11.53%) Senior
5 36 (11.21%) Analyst
6 33 (10.28%) Technical Consultant
7 31 (9.66%) Architect
8 22 (6.85%) Business Analyst
9 21 (6.54%) Technical Leader
10 18 (5.61%) NetSuite Consultant
10 18 (5.61%) Solutions Architect
11 16 (4.98%) .NET Developer
12 15 (4.67%) Data Consultant
12 15 (4.67%) Data Migration Consultant
12 15 (4.67%) Migration Consultant
12 15 (4.67%) Oracle Consultant
12 15 (4.67%) Oracle Data Migration Consultant
12 15 (4.67%) Oracle Technical Consultant
12 15 (4.67%) Senior Developer
13 14 (4.36%) Systems Analyst
Libraries, Frameworks & Software Standards
1 33 (10.28%) .NET
2 30 (9.35%) RESTful
3 28 (8.72%) HTML
4 23 (7.17%) XML
5 22 (6.85%) Oracle Fusion
5 22 (6.85%) SOAP
6 21 (6.54%) REST
7 19 (5.92%) React
8 18 (5.61%) Restlet
9 17 (5.30%) Kafka
10 14 (4.36%) RabbitMQ
11 12 (3.74%) CSS
11 12 (3.74%) Jest
12 11 (3.43%) Web Services
13 10 (3.12%) Node.js
14 9 (2.80%) GraphQL
15 8 (2.49%) Spring Boot
16 7 (2.18%) Spring
16 7 (2.18%) Unity (Game Engine)
16 7 (2.18%) WPF
Miscellaneous
1 41 (12.77%) Cloud Native
2 36 (11.21%) Data Structures
3 24 (7.48%) IoT
4 20 (6.23%) Manufacturing Execution System
4 20 (6.23%) SCADA
5 17 (5.30%) Mobile Games
6 15 (4.67%) Management Information System
7 14 (4.36%) Mobile App
8 13 (4.05%) Distributed Applications
9 12 (3.74%) Taxonomies
10 10 (3.12%) Greenfield Project
11 9 (2.80%) Hybrid Cloud
11 9 (2.80%) Legacy Applications
11 9 (2.80%) Public Cloud
12 8 (2.49%) Clustering
13 6 (1.87%) Legacy Code
13 6 (1.87%) PKI
13 6 (1.87%) Renewable Energy
14 5 (1.56%) Data Protection Act
14 5 (1.56%) Distributed Systems
Operating Systems
1 13 (4.05%) Linux
1 13 (4.05%) Windows
2 7 (2.18%) Android
2 7 (2.18%) Apple iOS
3 6 (1.87%) Windows Server
4 3 (0.93%) zOS
5 1 (0.31%) Red Hat Enterprise Linux
5 1 (0.31%) Windows 10
5 1 (0.31%) Windows Server 2003
Processes & Methodologies
1 127 (39.56%) Problem-Solving
2 121 (37.69%) Migration
3 85 (26.48%) Agile
4 71 (22.12%) Data Migration
5 47 (14.64%) ETL
6 46 (14.33%) ERP
6 46 (14.33%) Stakeholder Management
7 44 (13.71%) CI/CD
8 43 (13.40%) Data Modelling
9 41 (12.77%) Software Engineering
10 37 (11.53%) Microservices
11 36 (11.21%) Analytics
11 36 (11.21%) Change Management
11 36 (11.21%) Mentoring
11 36 (11.21%) Project Management
12 35 (10.90%) Validation
13 33 (10.28%) DevOps
14 31 (9.66%) Data Cleansing
14 31 (9.66%) Full-Stack Development
15 30 (9.35%) Roadmaps
Programming Languages
1 86 (26.79%) SQL
2 45 (14.02%) JavaScript
3 39 (12.15%) Java
4 36 (11.21%) C#
5 24 (7.48%) PL/SQL
6 17 (5.30%) Python
7 13 (4.05%) PHP
8 10 (3.12%) PowerShell
8 10 (3.12%) TypeScript
9 7 (2.18%) Kotlin
9 7 (2.18%) Objective-C
9 7 (2.18%) Swift
10 6 (1.87%) VB.NET
11 5 (1.56%) T-SQL
11 5 (1.56%) VBA
12 4 (1.25%) COBOL
13 3 (0.93%) Delphi
13 3 (0.93%) JCL
13 3 (0.93%) R
13 3 (0.93%) XAML
Qualifications
1 44 (13.71%) Degree
2 20 (6.23%) Computer Science Degree
3 13 (4.05%) Security Cleared
4 8 (2.49%) AWS Certification
5 6 (1.87%) DV Cleared
6 5 (1.56%) AWS Certified Solutions Architect
6 5 (1.56%) Azure Certification
7 3 (0.93%) BPSS Clearance
7 3 (0.93%) SC Cleared
8 2 (0.62%) ISTQB
8 2 (0.62%) ISTQB Foundation Certification
8 2 (0.62%) Master's Degree
8 2 (0.62%) Microsoft Certification
8 2 (0.62%) MOS
8 2 (0.62%) TOGAF Certification
9 1 (0.31%) (ISC)2 CCSP
9 1 (0.31%) CCSP
9 1 (0.31%) Cisco Certification
9 1 (0.31%) PMI Certification
9 1 (0.31%) PMP
Quality Assurance & Compliance
1 25 (7.79%) QA
2 22 (6.85%) Data Quality
3 10 (3.12%) GDPR
4 8 (2.49%) Accessibility
5 6 (1.87%) SLA
6 2 (0.62%) PMO
7 1 (0.31%) Cyber Essentials
7 1 (0.31%) Def Stans
7 1 (0.31%) DO-178B
7 1 (0.31%) IEC 61508
7 1 (0.31%) ISO 15022
7 1 (0.31%) ISO 20022
7 1 (0.31%) ISO/IEC 27001
7 1 (0.31%) NIST
7 1 (0.31%) PCI DSS
7 1 (0.31%) Sarbanes-Oxley
System Software
1 39 (12.15%) Docker
2 9 (2.80%) Active Directory
3 8 (2.49%) Hyper-V
3 8 (2.49%) VMware Infrastructure
4 6 (1.87%) BitLocker
4 6 (1.87%) Microsoft App-V
4 6 (1.87%) Terminal Services
4 6 (1.87%) VMware ESXi
4 6 (1.87%) vSphere
5 1 (0.31%) Virtual Desktop
Systems Management
1 21 (6.54%) Kubernetes
2 9 (2.80%) Terraform
3 7 (2.18%) Ansible
4 6 (1.87%) Nagios
4 6 (1.87%) Puppet
4 6 (1.87%) vCenter Server
4 6 (1.87%) vMotion
5 5 (1.56%) Argo
5 5 (1.56%) Prometheus
6 3 (0.93%) Avamar
6 3 (0.93%) Microsoft Intune
6 3 (0.93%) NetBackup
6 3 (0.93%) Tivoli Storage Manager
7 1 (0.31%) Active Directory Federation Services
7 1 (0.31%) CSIRT
7 1 (0.31%) Istio
7 1 (0.31%) Jamf Pro
7 1 (0.31%) SCCM
7 1 (0.31%) Single Sign-On
Vendors
1 61 (19.00%) Microsoft
2 39 (12.15%) Oracle
3 23 (7.17%) Google
4 20 (6.23%) Rockwell
4 20 (6.23%) Siemens
5 19 (5.92%) Salesforce
6 12 (3.74%) New Relic
7 11 (3.43%) IBM
8 10 (3.12%) VMware
9 8 (2.49%) Red Hat
10 7 (2.18%) HP
10 7 (2.18%) SAP
11 6 (1.87%) Citrix
11 6 (1.87%) Symantec
12 5 (1.56%) OpenLink
13 4 (1.25%) ServiceNow
14 3 (0.93%) OpenText
15 2 (0.62%) Anaplan
15 2 (0.62%) Cisco
15 2 (0.62%) Siebel