Public Sector Jobs in London

Public Sector
England > London

The table below looks at the prevalence of the term Public Sector in permanent job vacancies in London. Included is a benchmarking guide to the salaries offered in vacancies that cited Public Sector over the 6 months leading up to 19 May 2025, comparing them to the same period in the previous two years.

6 months to
19 May 2025
Same period 2024 Same period 2023
Rank 97 71 114
Rank change year-on-year -26 +43 +55
Permanent jobs citing Public Sector 430 902 1,052
As % of all permanent jobs advertised in London 3.34% 3.81% 3.13%
As % of the General category 4.36% 5.62% 4.55%
Number of salaries quoted 221 686 650
10th Percentile £42,840 £27,965 £43,162
25th Percentile £52,500 £42,000 £52,500
Median annual salary (50th Percentile) £65,000 £60,000 £67,001
Median % change year-on-year +8.33% -10.45% +3.08%
75th Percentile £85,000 £77,500 £83,750
90th Percentile £100,000 £90,000 £95,000
England median annual salary £60,000 £55,000 £55,000
% change year-on-year +9.09% - -

All General Skills
London

Public Sector falls under the General Skills category. For comparison with the information above, the following table provides summary statistics for all permanent job vacancies requiring common skills in London.

Permanent vacancies with a requirement for common skills 9,853 16,059 23,097
As % of all permanent jobs advertised in London 76.57% 67.87% 68.72%
Number of salaries quoted 5,421 11,369 15,985
10th Percentile £41,250 £36,250 £42,000
25th Percentile £55,000 £50,000 £54,500
Median annual salary (50th Percentile) £75,000 £70,000 £74,000
Median % change year-on-year +7.14% -5.41% +5.71%
75th Percentile £102,500 £95,000 £95,000
90th Percentile £125,000 £118,750 £120,000
England median annual salary £56,623 £52,500 £60,000
% change year-on-year +7.85% -12.50% -

Public Sector
Job Vacancy Trend in London

Job postings citing Public Sector as a proportion of all IT jobs advertised in London.
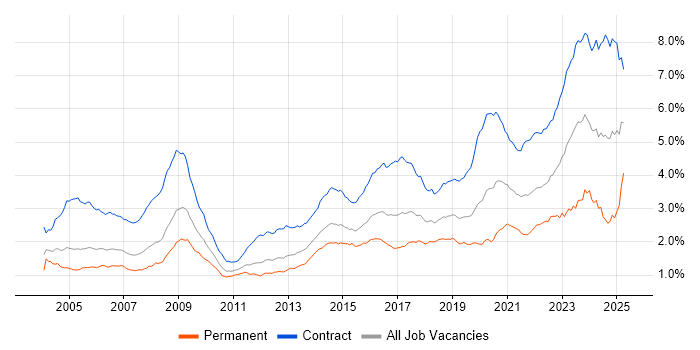
Job vacancy trend for Public Sector in London

Public Sector
Salary Trend in London

3-month moving average salary quoted in jobs citing Public Sector in London.

Salary trend for Public Sector in London

Public Sector
Salary Histogram in London

Salary distribution for jobs citing Public Sector in London over the 6 months to 19 May 2025.

Salary histogram for Public Sector in London

Public Sector
Job Locations in London

The table below looks at the demand and provides a guide to the median salaries quoted in IT jobs citing Public Sector within the London region over the 6 months to 19 May 2025. The 'Rank Change' column provides an indication of the change in demand within each location based on the same 6 month period last year.

Location Rank Change
on Same Period
Last Year
Matching
Permanent
IT Job Ads
Median Salary
Past 6 Months
Median Salary
% Change
on Same Period
Last Year
Live
Jobs
Central London +19 54 £60,000 -2.44% 53
South London -12 50 £42,840 +7.00% 14
West London +39 20 - - 17
East London -24 16 £70,000 +150.31% 4
North London -5 3 £62,500 +3.31% 3
Public Sector
England

Public Sector
Co-occurring Skills and Capabilities in London by Category

The follow tables expand on the table above by listing co-occurrences grouped by category. The same employment type, locality and period is covered with up to 20 co-occurrences shown in each of the following categories:

Application Platforms
1 14 (3.26%) JBoss
1 14 (3.26%) Red Hat Fuse
2 7 (1.63%) SharePoint
3 5 (1.16%) Apache Spark
4 3 (0.70%) CMS
4 3 (0.70%) Confluence
4 3 (0.70%) nginx
4 3 (0.70%) Tomcat
4 3 (0.70%) WordPress
5 1 (0.23%) Apache Airflow
5 1 (0.23%) Microsoft Exchange
Applications
1 13 (3.02%) Adobe XD
1 13 (3.02%) Microsoft Excel
2 6 (1.40%) InVision
2 6 (1.40%) Sketch
2 6 (1.40%) Spreadsheet
3 5 (1.16%) Stata
4 4 (0.93%) Microsoft PowerPoint
4 4 (0.93%) Notion
5 3 (0.70%) Microsoft Office
6 2 (0.47%) Microsoft Project
6 2 (0.47%) Oracle Smart View
7 1 (0.23%) Adobe Creative Suite
7 1 (0.23%) Adobe Illustrator
7 1 (0.23%) Adobe Premiere
7 1 (0.23%) InDesign
7 1 (0.23%) Photoshop
7 1 (0.23%) SPSS
7 1 (0.23%) Trello
Business Applications
1 14 (3.26%) Dynamics CRM
2 5 (1.16%) Oracle ERP
3 4 (0.93%) NetSuite
4 3 (0.70%) Dynamics NAV
4 3 (0.70%) Oracle EBS
5 2 (0.47%) Oracle Financials
5 2 (0.47%) SAP S/4HANA
6 1 (0.23%) Lorenzo
6 1 (0.23%) Oracle Cash Management
6 1 (0.23%) Oracle FAH
6 1 (0.23%) Oracle General Ledger
6 1 (0.23%) Oracle Payables
6 1 (0.23%) Oracle Procure-to-Pay
6 1 (0.23%) Oracle Receivables
6 1 (0.23%) SAP ERP
6 1 (0.23%) Shopify
6 1 (0.23%) SystmOne
Cloud Services
1 89 (20.70%) AWS
2 88 (20.47%) Azure
3 39 (9.07%) Power Platform
4 36 (8.37%) Serverless
5 30 (6.98%) GCP
6 27 (6.28%) Amazon ECS
6 27 (6.28%) Amazon EKS
7 23 (5.35%) Dynamics 365
8 22 (5.12%) Azure DevOps
9 19 (4.42%) Power Automate
9 19 (4.42%) PowerApps
10 14 (3.26%) SaaS
11 12 (2.79%) Amazon EC2
12 11 (2.56%) Figma
13 10 (2.33%) Microsoft 365
14 9 (2.09%) Azure Data Factory
14 9 (2.09%) GitHub
15 8 (1.86%) Google Analytics
15 8 (1.86%) Google Workspace
15 8 (1.86%) Slack
Communications & Networking
1 4 (0.93%) 4G
1 4 (0.93%) 5G
1 4 (0.93%) Firewall
1 4 (0.93%) Network Security
1 4 (0.93%) Unified Communications
1 4 (0.93%) WAN
2 2 (0.47%) Intranet
2 2 (0.47%) Intrusion Detection
3 1 (0.23%) DNS
3 1 (0.23%) Softphone
3 1 (0.23%) TCP/IP
3 1 (0.23%) VPN
3 1 (0.23%) WebEx
Database & Business Intelligence
1 55 (12.79%) PostgreSQL
2 43 (10.00%) Relational Database
3 30 (6.98%) Power BI
4 21 (4.88%) NoSQL
5 18 (4.19%) RDBMS
6 14 (3.26%) DB2
7 12 (2.79%) MongoDB
7 12 (2.79%) SQL Server
8 9 (2.09%) Data Warehouse
9 7 (1.63%) Big Data
9 7 (1.63%) MySQL
9 7 (1.63%) Tableau
10 6 (1.40%) Elasticsearch
10 6 (1.40%) GIS
11 5 (1.16%) Data Lake
12 4 (0.93%) Amazon RDS
12 4 (0.93%) Metadata
13 3 (0.70%) Data Mining
13 3 (0.70%) Hadoop
13 3 (0.70%) HBase
Development Applications
1 37 (8.60%) Jenkins
2 32 (7.44%) Git
3 30 (6.98%) JUnit
4 16 (3.72%) JMeter
5 15 (3.49%) Mockito
6 13 (3.02%) Axure RP
7 9 (2.09%) Postman
8 8 (1.86%) Selenium
9 7 (1.63%) Balsamiq
9 7 (1.63%) JIRA
10 6 (1.40%) Bitbucket
10 6 (1.40%) TeamCity
11 4 (0.93%) Maven
11 4 (0.93%) SonarQube
12 3 (0.70%) Cypress.io
12 3 (0.70%) Gatling
12 3 (0.70%) GitLab
12 3 (0.70%) REST Assured
12 3 (0.70%) TestNG
12 3 (0.70%) TestRail
General
1 193 (44.88%) Social Skills
2 140 (32.56%) Finance
3 119 (27.67%) Marketing
4 70 (16.28%) Inclusion and Diversity
5 49 (11.40%) Analytical Skills
6 45 (10.47%) Manufacturing
7 41 (9.53%) Telecoms
8 38 (8.84%) Electronics
9 21 (4.88%) Local Government
10 18 (4.19%) Law
11 16 (3.72%) Presentation Skills
12 10 (2.33%) Retail
13 8 (1.86%) Legal
14 7 (1.63%) Advertising
14 7 (1.63%) Banking
14 7 (1.63%) Organisational Skills
15 5 (1.16%) Back Office
16 4 (0.93%) Billing
16 4 (0.93%) Games
17 2 (0.47%) Publishing
Job Titles
1 75 (17.44%) Developer
2 69 (16.05%) Senior
3 65 (15.12%) Development Manager
4 64 (14.88%) Business Manager
5 62 (14.42%) Business Development Manager
6 47 (10.93%) Architect
7 32 (7.44%) Consultant
8 26 (6.05%) Java Developer
9 21 (4.88%) Solutions Architect
10 19 (4.42%) Azure Engineer
10 19 (4.42%) Lead
11 16 (3.72%) Full-Stack Engineer
12 15 (3.49%) Analyst
12 15 (3.49%) Data Engineer
12 15 (3.49%) DevOps Engineer
13 14 (3.26%) Operations Manager
13 14 (3.26%) Senior Developer
13 14 (3.26%) Support Manager
14 13 (3.02%) IT Manager
14 13 (3.02%) IT Support Manager
Libraries, Frameworks & Software Standards
1 47 (10.93%) REST
2 44 (10.23%) HTML
3 36 (8.37%) CSS
4 34 (7.91%) Spring
5 32 (7.44%) RESTful
5 32 (7.44%) Web Services
6 29 (6.74%) React
6 29 (6.74%) Spring Boot
7 25 (5.81%) Apache Camel
8 23 (5.35%) AngularJS
8 23 (5.35%) jQuery
9 21 (4.88%) SOAP
10 19 (4.42%) .NET
11 14 (3.26%) Hibernate
11 14 (3.26%) J2EE
11 14 (3.26%) WireMock
12 13 (3.02%) JSON
12 13 (3.02%) XML
13 12 (2.79%) Backbone.js
13 12 (2.79%) Ember.js
Miscellaneous
1 31 (7.21%) Hybrid Cloud
2 29 (6.74%) Distributed Systems
2 29 (6.74%) e-Learning
3 28 (6.51%) Cloud Native
4 20 (4.65%) NHS
5 15 (3.49%) Algorithms
6 14 (3.26%) Management Information System
7 13 (3.02%) Product Ownership
7 13 (3.02%) Self-Motivation
8 12 (2.79%) Data Structures
9 8 (1.86%) IoT
9 8 (1.86%) Onboarding
9 8 (1.86%) Social Media
10 7 (1.63%) Life Science
11 6 (1.40%) Legacy Systems
11 6 (1.40%) Operational Technology
12 5 (1.16%) Blog
13 4 (0.93%) Data Centre
13 4 (0.93%) Housing Association
13 4 (0.93%) Mobile App
Operating Systems
1 18 (4.19%) Linux
1 18 (4.19%) Windows
2 15 (3.49%) Android
2 15 (3.49%) Apple iOS
3 2 (0.47%) Unix
3 2 (0.47%) Windows Server
3 2 (0.47%) zOS
4 1 (0.23%) Mac OS
4 1 (0.23%) Windows 10
Processes & Methodologies
1 127 (29.53%) Agile
2 92 (21.40%) Problem-Solving
3 87 (20.23%) Collaborative Working
4 81 (18.84%) Business Development
5 74 (17.21%) DevOps
6 67 (15.58%) Collaborative Culture
7 65 (15.12%) Marketing Strategy
8 64 (14.88%) Business Intelligence
9 63 (14.65%) CI/CD
10 61 (14.19%) Artificial Intelligence
11 60 (13.95%) Facilities Management
12 57 (13.26%) Mentoring
13 49 (11.40%) Project Management
14 46 (10.70%) Analytics
15 45 (10.47%) Scrum
16 43 (10.00%) Microservices
16 43 (10.00%) User Experience
17 40 (9.30%) Continuous Improvement
17 40 (9.30%) Digital Marketing
18 39 (9.07%) Programme Management
Programming Languages
1 62 (14.42%) JavaScript
2 57 (13.26%) Python
3 55 (12.79%) SQL
4 44 (10.23%) Java
5 28 (6.51%) C#
6 14 (3.26%) Shell Script
7 12 (2.79%) TypeScript
8 11 (2.56%) R
9 7 (1.63%) Apex Code
9 7 (1.63%) Ruby
10 4 (0.93%) PowerShell
10 4 (0.93%) Scala
10 4 (0.93%) T-SQL
11 3 (0.70%) C++
11 3 (0.70%) SPARQL
12 2 (0.47%) Bicep
12 2 (0.47%) COBOL
12 2 (0.47%) JCL
13 1 (0.23%) C
13 1 (0.23%) Go
Qualifications
1 133 (30.93%) Security Cleared
2 110 (25.58%) SC Cleared
3 64 (14.88%) Degree
4 20 (4.65%) CISSP
5 16 (3.72%) DV Cleared
6 14 (3.26%) PMI Certification
6 14 (3.26%) PMP
7 13 (3.02%) Azure Certification
8 12 (2.79%) Computer Science Degree
9 11 (2.56%) Master's Degree
10 8 (1.86%) AWS Certification
11 7 (1.63%) BPSS Clearance
11 7 (1.63%) ISTQB
12 6 (1.40%) ISTQB Foundation Certification
13 5 (1.16%) DBS Check
13 5 (1.16%) Microsoft Certification
14 4 (0.93%) AWS Certified Solutions Architect
14 4 (0.93%) CISM
14 4 (0.93%) Numerate Degree
15 3 (0.70%) Cisco Certification
Quality Assurance & Compliance
1 33 (7.67%) QA
2 24 (5.58%) Accessibility
3 23 (5.35%) GDPR
4 19 (4.42%) WCAG
5 16 (3.72%) Cyber Essentials
6 15 (3.49%) Data Quality
6 15 (3.49%) SLA
7 13 (3.02%) Cyber Essentials PLUS
7 13 (3.02%) ISO/IEC 27001
8 8 (1.86%) NIST
9 6 (1.40%) NCSC
10 3 (0.70%) ISO 9001
10 3 (0.70%) SOC 2
11 2 (0.47%) ITGC
12 1 (0.23%) COBIT
12 1 (0.23%) DICOM
12 1 (0.23%) HIPAA
12 1 (0.23%) HL7
12 1 (0.23%) PMO
12 1 (0.23%) SNOMED CT
System Software
1 47 (10.93%) Docker
2 3 (0.70%) Active Directory
3 1 (0.23%) Postfix
3 1 (0.23%) Virtual Desktop
Systems Management
1 55 (12.79%) Kubernetes
2 24 (5.58%) Terraform
3 18 (4.19%) Ansible
4 11 (2.56%) Kibana
5 3 (0.70%) Kustomize
5 3 (0.70%) Packer
6 2 (0.47%) Microsoft Intune
7 1 (0.23%) DameWare
7 1 (0.23%) Grafana
7 1 (0.23%) HP Quality Center
7 1 (0.23%) Nessus
7 1 (0.23%) SCCM
Vendors
1 60 (13.95%) Microsoft
2 43 (10.00%) SAP
3 33 (7.67%) Google
4 30 (6.98%) IBM
5 25 (5.81%) Red Hat
6 17 (3.95%) Splunk
7 16 (3.72%) Oracle
8 14 (3.26%) Adobe
8 14 (3.26%) Databricks
8 14 (3.26%) Salesforce
9 12 (2.79%) ServiceNow
10 11 (2.56%) Dynatrace
11 5 (1.16%) Cisco
11 5 (1.16%) Facebook
12 4 (0.93%) Instagram
12 4 (0.93%) MuleSoft
13 3 (0.70%) Cloudera
13 3 (0.70%) Palo Alto
13 3 (0.70%) Talend
14 2 (0.47%) F5