Retail Jobs in the UK excluding London

Retailing
UK > UK excluding London

The table below looks at the prevalence of the term Retail in permanent job vacancies in the UK excluding London. Included is a benchmarking guide to the salaries offered in vacancies that cited Retail over the 6 months leading up to 11 May 2025, comparing them to the same period in the previous two years.

6 months to
11 May 2025
Same period 2024 Same period 2023
Rank 51 52 43
Rank change year-on-year +1 -9 +14
Permanent jobs citing Retail 1,778 3,220 3,840
As % of all permanent jobs advertised in the UK excluding London 4.55% 4.54% 6.41%
As % of the General category 6.87% 7.91% 9.34%
Number of salaries quoted 843 1,972 1,940
10th Percentile £26,250 £25,250 £31,569
25th Percentile £32,000 £31,250 £41,250
Median annual salary (50th Percentile) £45,000 £45,000 £55,000
Median % change year-on-year - -18.18% +10.00%
75th Percentile £62,500 £58,750 £70,000
90th Percentile £80,000 £72,500 £82,500
UK median annual salary £51,500 £47,500 £60,000
% change year-on-year +8.42% -20.83% +4.35%

All General Skills
UK excluding London

Retail falls under the General Skills category. For comparison with the information above, the following table provides summary statistics for all permanent job vacancies requiring common skills in the UK excluding London.

Permanent vacancies with a requirement for common skills 25,871 40,733 41,110
As % of all permanent jobs advertised in the UK excluding London 66.20% 57.38% 68.60%
Number of salaries quoted 12,216 26,455 18,729
10th Percentile £25,313 £26,000 £28,500
25th Percentile £35,000 £32,500 £37,250
Median annual salary (50th Percentile) £50,055 £47,500 £52,500
Median % change year-on-year +5.38% -9.52% +5.00%
75th Percentile £65,000 £62,500 £67,500
90th Percentile £78,750 £75,000 £81,250
UK median annual salary £55,000 £52,500 £60,000
% change year-on-year +4.76% -12.50% -

Retail
Job Vacancy Trend in the UK excluding London

Job postings citing Retail as a proportion of all IT jobs advertised in the UK excluding London.
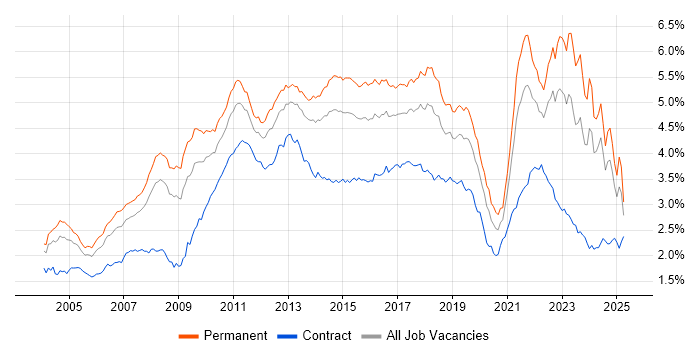
Job vacancy trend for Retail in the UK excluding London

Retail
Salary Trend in the UK excluding London

3-month moving average salary quoted in jobs citing Retail in the UK excluding London.

Salary trend for Retail in the UK excluding London

Retail
Salary Histogram in the UK excluding London

Salary distribution for jobs citing Retail in the UK excluding London over the 6 months to 11 May 2025.

Salary histogram for Retail in the UK excluding London

Retail
Job Locations in the UK excluding London

The table below looks at the demand and provides a guide to the median salaries quoted in IT jobs citing Retail within the UK excluding London region over the 6 months to 11 May 2025. The 'Rank Change' column provides an indication of the change in demand within each location based on the same 6 month period last year.

Location Rank Change
on Same Period
Last Year
Matching
Permanent
IT Job Ads
Median Salary
Past 6 Months
Median Salary
% Change
on Same Period
Last Year
Live
Jobs
North of England -41 442 £45,750 +1.67% 609
Midlands -7 438 £45,000 +9.76% 339
South East -2 418 £45,000 - 804
North West -62 270 £52,500 +16.67% 400
West Midlands +4 254 £45,000 - 184
East Midlands -18 182 £42,500 +13.33% 134
Scotland +149 180 £26,929 -41.78% 127
South West +4 173 £57,500 +21.05% 184
Yorkshire +7 142 £42,000 -10.64% 191
East of England -74 77 £50,000 +4.71% 178
Wales +21 41 £50,000 +35.14% 26
North East -1 29 £37,000 -11.06% 35
Northern Ireland +20 14 £40,000 +42.86% 26
Retail
UK

Retail
Co-occurring Skills and Capabilities in the UK excluding London by Category

The follow tables expand on the table above by listing co-occurrences grouped by category. The same employment type, locality and period is covered with up to 20 co-occurrences shown in each of the following categories:

Application Platforms
1 32 (1.80%) SharePoint
2 20 (1.12%) Microsoft Exchange
3 16 (0.90%) Confluence
4 15 (0.84%) SAS
5 14 (0.79%) WinCC
6 13 (0.73%) CMS
7 6 (0.34%) Apache Spark
8 5 (0.28%) IIS
9 4 (0.22%) Oracle SOA Suite
9 4 (0.22%) Tomcat
10 3 (0.17%) Apache
10 3 (0.17%) Apache Airflow
10 3 (0.17%) WordPress
11 2 (0.11%) ColdFusion
11 2 (0.11%) Headless CMS
11 2 (0.11%) Strapi
11 2 (0.11%) WebLogic
12 1 (0.056%) Oracle HTTP Server
12 1 (0.056%) Oracle Workflow
12 1 (0.056%) Umbraco
Applications
1 80 (4.50%) Microsoft Excel
2 71 (3.99%) Microsoft Office
3 39 (2.19%) Microsoft PowerPoint
4 14 (0.79%) EPLAN
5 12 (0.67%) Adobe Creative Suite
6 9 (0.51%) Acrobat
7 7 (0.39%) Adobe Illustrator
7 7 (0.39%) Photoshop
8 6 (0.34%) InDesign
9 4 (0.22%) Adobe XD
9 4 (0.22%) Revit
10 3 (0.17%) Spreadsheet
11 2 (0.11%) Adobe After Effects
11 2 (0.11%) Microsoft Project
11 2 (0.11%) MS Visio
12 1 (0.056%) Adobe Premiere
12 1 (0.056%) Blender
12 1 (0.056%) CINEMA 4D
12 1 (0.056%) GNU Octave
Business Applications
1 33 (1.86%) Shopify
2 30 (1.69%) Dynamics AX
3 20 (1.12%) Magento
4 15 (0.84%) Dynamics CRM
5 13 (0.73%) SAP S/4HANA
6 10 (0.56%) Payment Gateway
7 3 (0.17%) ResourceLink
8 2 (0.11%) Infor M3
8 2 (0.11%) Oracle BPM
8 2 (0.11%) Oracle Payables
8 2 (0.11%) SAP Business One
9 1 (0.056%) Odoo
9 1 (0.056%) Oracle EBS
9 1 (0.056%) Oracle ERP
9 1 (0.056%) Oracle Retail
9 1 (0.056%) SAP CAR
9 1 (0.056%) SAP Retail
9 1 (0.056%) SAP SD
Cloud Services
1 311 (17.49%) Azure
2 184 (10.35%) AWS
3 115 (6.47%) Microsoft 365
4 87 (4.89%) Power Platform
5 50 (2.81%) Azure DevOps
6 46 (2.59%) SaaS
7 39 (2.19%) GCP
8 37 (2.08%) Google Analytics
9 31 (1.74%) Azure Service Bus
10 29 (1.63%) Serverless
11 24 (1.35%) Azure Cosmos DB
11 24 (1.35%) Azure Data Factory
11 24 (1.35%) Google Workspace
11 24 (1.35%) SonarCloud
12 20 (1.12%) GitHub
13 19 (1.07%) Azure Synapse Analytics
13 19 (1.07%) Google Tag Manager
13 19 (1.07%) Power Automate
14 18 (1.01%) Dynamics 365
15 17 (0.96%) Google Ads
Communications & Networking
1 46 (2.59%) Firewall
2 44 (2.47%) LAN
3 42 (2.36%) 5G
4 41 (2.31%) 4G
4 41 (2.31%) WAN
5 37 (2.08%) DNS
6 34 (1.91%) DHCP
7 30 (1.69%) VLAN
7 30 (1.69%) VoIP
8 29 (1.63%) Broadband
9 21 (1.18%) TCP/IP
10 18 (1.01%) VPN
11 14 (0.79%) BGP
11 14 (0.79%) Ethernet
11 14 (0.79%) Modbus
11 14 (0.79%) OSPF
11 14 (0.79%) Profibus
11 14 (0.79%) RS-485
11 14 (0.79%) WLAN
12 11 (0.62%) Network Security
Database & Business Intelligence
1 156 (8.77%) SQL Server
2 70 (3.94%) Power BI
3 44 (2.47%) Data Mining
4 28 (1.57%) MySQL
5 25 (1.41%) Elasticsearch
6 24 (1.35%) Tableau
7 17 (0.96%) Metadata
8 16 (0.90%) BusinessObjects
9 12 (0.67%) Data Warehouse
10 11 (0.62%) NoSQL
11 10 (0.56%) Data Lake
11 10 (0.56%) MongoDB
11 10 (0.56%) PostgreSQL
11 10 (0.56%) QlikView
12 8 (0.45%) SQL Server Integration Services
13 7 (0.39%) BigQuery
13 7 (0.39%) SQL Server Reporting Services
14 6 (0.34%) Big Data
14 6 (0.34%) Relational Database
15 4 (0.22%) Oracle BI Publisher
Development Applications
1 129 (7.26%) JIRA
2 100 (5.62%) Maven
3 98 (5.51%) Selenium
4 96 (5.40%) GitLab
5 93 (5.23%) Cucumber
6 92 (5.17%) SonarQube
6 92 (5.17%) Sonatype Nexus
7 90 (5.06%) Bitbucket
8 84 (4.72%) Git
9 46 (2.59%) Visual Studio
10 30 (1.69%) Octopus Deploy
11 25 (1.41%) Team Foundation Server
12 24 (1.35%) MSBuild
13 9 (0.51%) Postman
14 8 (0.45%) Subversion
14 8 (0.45%) TeamCity
15 5 (0.28%) Jenkins
15 5 (0.28%) JMeter
16 4 (0.22%) Gradle
16 4 (0.22%) Visual Studio Code
General
1 452 (25.42%) Finance
2 410 (23.06%) Social Skills
3 403 (22.67%) Manufacturing
4 218 (12.26%) Analytical Skills
5 175 (9.84%) Inclusion and Diversity
6 173 (9.73%) Telecoms
7 147 (8.27%) Banking
8 134 (7.54%) Marketing
9 104 (5.85%) Games
10 102 (5.74%) Dutch Language
11 96 (5.40%) Finnish Language
11 96 (5.40%) Norwegian Language
12 93 (5.23%) Investment Banking
13 90 (5.06%) Corporate Banking
14 59 (3.32%) Law
15 54 (3.04%) Legal
16 48 (2.70%) Automotive
17 44 (2.47%) Organisational Skills
18 29 (1.63%) Public Sector
19 21 (1.18%) Presentation Skills
Job Titles
1 289 (16.25%) Trainer
2 279 (15.69%) Senior
3 132 (7.42%) Analyst
4 130 (7.31%) Software Engineer
5 113 (6.36%) Developer
6 91 (5.12%) Lead
7 72 (4.05%) IT Support
8 66 (3.71%) Project Manager
9 55 (3.09%) Architect
10 48 (2.70%) Senior Manager
11 40 (2.25%) IT Manager
12 38 (2.14%) Technical Support
13 36 (2.02%) Risk Manager
14 33 (1.86%) Junior
14 33 (1.86%) Senior Project Manager
15 32 (1.80%) IT Engineer
15 32 (1.80%) Systems Engineer
15 32 (1.80%) Technology Risk Manager
16 31 (1.74%) Senior Developer
16 31 (1.74%) Support Specialist
Libraries, Frameworks & Software Standards
1 182 (10.24%) HTML
2 174 (9.79%) CSS
3 127 (7.14%) REST
4 122 (6.86%) React
5 113 (6.36%) RESTful
6 99 (5.57%) Kafka
7 98 (5.51%) Spring
8 97 (5.46%) Sass
9 96 (5.40%) HTML5
10 94 (5.29%) CSS3
10 94 (5.29%) Spring Boot
11 90 (5.06%) Jest
11 90 (5.06%) JPA
11 90 (5.06%) Redux
12 83 (4.67%) .NET
13 46 (2.59%) ASP.NET
14 39 (2.19%) XML
15 38 (2.14%) Bootstrap
16 36 (2.02%) JSON
17 34 (1.91%) Web Services
Miscellaneous
1 342 (19.24%) Robotics
2 117 (6.58%) Product Ownership
3 100 (5.62%) Enterprise Software
4 73 (4.11%) Management Information System
5 54 (3.04%) Blockchain
6 43 (2.42%) FMCG
7 37 (2.08%) Algorithms
8 36 (2.02%) CCTV
9 34 (1.91%) Driving Licence
9 34 (1.91%) EPoS
10 33 (1.86%) Onboarding
11 29 (1.63%) Self-Motivation
12 27 (1.52%) Greenfield Project
13 26 (1.46%) Cloud Native
13 26 (1.46%) Data Structures
14 21 (1.18%) Smartphone
15 20 (1.12%) Social Media
16 19 (1.07%) Mobile App
17 15 (0.84%) SCADA
18 14 (0.79%) Data Protection Act
Operating Systems
1 120 (6.75%) Windows
2 58 (3.26%) Linux
3 52 (2.92%) Windows 10
4 38 (2.14%) Windows Server
5 26 (1.46%) Windows Server 2019
6 17 (0.96%) Mac OS X
6 17 (0.96%) Windows Server 2016
7 15 (0.84%) Android
8 14 (0.79%) Ubuntu
9 13 (0.73%) Mac OS
10 9 (0.51%) Unix
11 5 (0.28%) Apple iOS
12 3 (0.17%) Windows Server 2008
13 2 (0.11%) Windows 7
14 1 (0.056%) AIX
14 1 (0.056%) Data ONTAP
14 1 (0.056%) Red Hat Enterprise Linux
14 1 (0.056%) Solaris
14 1 (0.056%) SUSE
14 1 (0.056%) Windows Server 2012
Processes & Methodologies
1 610 (34.31%) Problem-Solving
2 407 (22.89%) Artificial Intelligence
3 335 (18.84%) Machine Learning
4 329 (18.50%) Agile
5 312 (17.55%) Generative AI
6 303 (17.04%) LLM
7 288 (16.20%) Red Team
8 283 (15.92%) Mentoring
9 244 (13.72%) Customer Service
10 235 (13.22%) Data Privacy
11 234 (13.16%) Analytics
12 221 (12.43%) DevOps
13 208 (11.70%) Coaching
14 201 (11.30%) Customer Experience
15 178 (10.01%) Software Engineering
16 157 (8.83%) Microservices
17 145 (8.16%) Strategic Thinking
18 133 (7.48%) CI/CD
19 131 (7.37%) E-Commerce
19 131 (7.37%) User Experience
Programming Languages
1 309 (17.38%) SQL
2 209 (11.75%) JavaScript
3 132 (7.42%) Java
4 108 (6.07%) TypeScript
5 104 (5.85%) C#
6 98 (5.51%) Python
7 31 (1.74%) PowerShell
8 26 (1.46%) PHP
9 21 (1.18%) R
10 20 (1.12%) VBA
11 9 (0.51%) C-shell
11 9 (0.51%) Korn
11 9 (0.51%) Shell Script
12 8 (0.45%) Bash
12 8 (0.45%) PL/SQL
13 7 (0.39%) Delphi
14 5 (0.28%) Go
14 5 (0.28%) Rust
15 4 (0.22%) C++
15 4 (0.22%) Data Analysis Expressions
Qualifications
1 496 (27.90%) Degree
2 45 (2.53%) Computer Science Degree
3 44 (2.47%) DBS Check
4 41 (2.31%) HNC
4 41 (2.31%) Security Cleared
5 27 (1.52%) Microsoft Certification
6 25 (1.41%) SC Cleared
7 24 (1.35%) CISA
7 24 (1.35%) HND
8 22 (1.24%) ISACA
9 19 (1.07%) Master's Degree
10 15 (0.84%) PhD
11 14 (0.79%) CISSP
11 14 (0.79%) MCSE
12 13 (0.73%) AWS Certification
13 12 (0.67%) Azure Certification
14 9 (0.51%) Cisco Certification
14 9 (0.51%) CISM
15 8 (0.45%) A+ Certification
15 8 (0.45%) ITIL Certification
Quality Assurance & Compliance
1 137 (7.71%) QA
2 101 (5.68%) Accessibility
3 63 (3.54%) GDPR
4 50 (2.81%) ITGC
5 29 (1.63%) Data Quality
6 23 (1.29%) ISO/IEC 27001
6 23 (1.29%) PCI DSS
7 16 (0.90%) SLA
8 15 (0.84%) Cyber Essentials
9 10 (0.56%) PERC
10 7 (0.39%) PMO
11 6 (0.34%) GRC
12 5 (0.28%) NIST
12 5 (0.28%) Sarbanes-Oxley
13 4 (0.22%) Actionable Recommendations
13 4 (0.22%) Government Security Classifications
14 2 (0.11%) ISO/IEC 19770
14 2 (0.11%) ISO/IEC 20000
14 2 (0.11%) NEBOSH
15 1 (0.056%) ISO/IEC 27005
System Software
1 144 (8.10%) Docker
2 93 (5.23%) Active Directory
3 24 (1.35%) VMware Infrastructure
4 18 (1.01%) Hyper-V
5 14 (0.79%) Virtual Desktop
6 5 (0.28%) VMware ESXi
7 4 (0.22%) Virtual Servers
7 4 (0.22%) VMware NSX
8 1 (0.056%) LXC
8 1 (0.056%) Samba
8 1 (0.056%) Virtual Machines
8 1 (0.056%) vSphere
Systems Management
1 113 (6.36%) Kubernetes
2 22 (1.24%) Microsoft Intune
3 14 (0.79%) Wonderware InTouch
4 9 (0.51%) Terraform
5 6 (0.34%) SCCM
6 5 (0.28%) Ansible
6 5 (0.28%) Grafana
6 5 (0.28%) Prometheus
7 4 (0.22%) Progress Chef
7 4 (0.22%) Puppet
8 3 (0.17%) Avamar
8 3 (0.17%) vCenter Server
8 3 (0.17%) VxRail
9 2 (0.11%) Active Directory Federation Services
9 2 (0.11%) Failover Clustering
9 2 (0.11%) Istio
10 1 (0.056%) Microsoft Clustering
10 1 (0.056%) PowerCLI
10 1 (0.056%) SCOM
10 1 (0.056%) Single Sign-On
Vendors
1 409 (23.00%) Google
2 342 (19.24%) Databricks
3 313 (17.60%) Adobe
4 306 (17.21%) Microsoft
5 179 (10.07%) BT
6 90 (5.06%) Solace
7 56 (3.15%) Oracle
8 51 (2.87%) SAP
9 35 (1.97%) Cisco
10 30 (1.69%) Facebook
11 27 (1.52%) VMware
12 24 (1.35%) Dell
13 19 (1.07%) Fortinet
14 15 (0.84%) IBM
14 15 (0.84%) OpenAI
14 15 (0.84%) Pinterest
14 15 (0.84%) Siemens
14 15 (0.84%) TikTok
15 14 (0.79%) Apple
15 14 (0.79%) Ubiquiti