Prometheus Jobs with Hybrid/Remote/WFH Options

Prometheus
UK > Work from Home

The table below provides summary statistics for permanent remote or hybrid work requiring Prometheus skills. It includes a benchmarking guide to the annual salaries offered in vacancies that cited Prometheus over the 6 months leading up to 10 May 2025, comparing them to the same period in the previous two years.

6 months to
10 May 2025
Same period 2024 Same period 2023
Rank 356 423 448
Rank change year-on-year +67 +25 -51
Permanent jobs citing Prometheus 85 171 227
As % of all permanent jobs with a WFH option 0.51% 0.51% 0.55%
As % of the Systems Management category 4.38% 4.40% 3.42%
Number of salaries quoted 67 99 167
10th Percentile £52,000 £54,750 £52,500
25th Percentile £60,000 £73,750 £62,500
Median annual salary (50th Percentile) £67,500 £100,000 £75,000
Median % change year-on-year -32.50% +33.33% -
75th Percentile £83,750 £118,750 £87,500
90th Percentile £91,000 £143,750 £100,000
UK median annual salary £75,000 £80,000 £75,000
% change year-on-year -6.25% +6.67% -3.23%

All Systems Management Skills
Work from Home

Prometheus falls under the Systems Management category. For comparison with the information above, the following table provides summary statistics for all permanent job vacancies with remote or hybrid options requiring systems management skills.

Permanent vacancies with a requirement for systems management skills 1,942 3,888 6,634
As % of all permanent jobs with a WFH option 11.59% 11.51% 16.00%
Number of salaries quoted 1,337 2,953 4,692
10th Percentile £39,493 £37,101 £41,250
25th Percentile £51,250 £47,500 £52,500
Median annual salary (50th Percentile) £70,000 £65,000 £69,447
Median % change year-on-year +7.69% -6.40% -0.79%
75th Percentile £90,000 £83,750 £88,750
90th Percentile £115,000 £102,500 £105,000
UK median annual salary £67,500 £60,000 £67,500
% change year-on-year +12.50% -11.11% -3.57%

Prometheus
Trend for Jobs with a WFH Option

Job vacancies with remote working options citing Prometheus as a proportion of all IT jobs advertised.
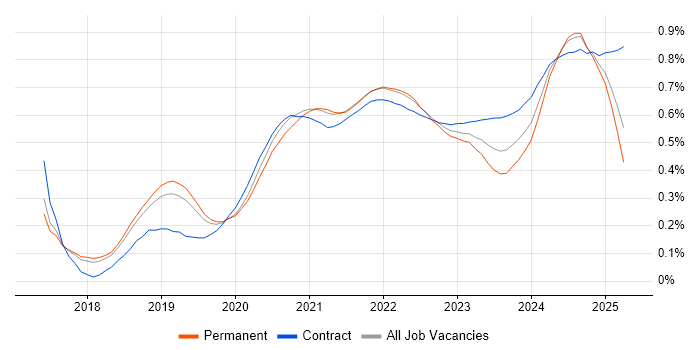
Prometheus trend for jobs with Hybrid/Remote/WFH options

Prometheus
Salary Trend for Jobs with a WFH Option

3-month moving average salary quoted in job vacancies with remote working options citing Prometheus.

Prometheus salary trend for jobs with a WFH option

Prometheus
Salary Histogram for Jobs with a WFH Option

Salary distribution for jobs with remote working options citing Prometheus over the 6 months to 10 May 2025.

Prometheus salary histogram for jobs with a WFH option

Prometheus
Co-occurring Skills and Capabilities with WFH Options by Category

The follow tables expand on the table above by listing co-occurrences grouped by category. The same employment type, locality and period is covered with up to 20 co-occurrences shown in each of the following categories:

Application Platforms
1 11 (12.94%) Confluence
2 1 (1.18%) OpenStack
Cloud Services
1 46 (54.12%) AWS
2 43 (50.59%) Azure
3 25 (29.41%) GitHub
4 24 (28.24%) Serverless
5 23 (27.06%) GCP
6 21 (24.71%) GitHub Actions
7 19 (22.35%) AWS Lambda
8 17 (20.00%) AWS CloudFormation
9 16 (18.82%) Azure DevOps
10 14 (16.47%) Azure Monitor
10 14 (16.47%) Datadog
11 13 (15.29%) AWS KMS
12 12 (14.12%) Amazon CloudWatch
13 9 (10.59%) Amazon EKS
14 8 (9.41%) npm
15 5 (5.88%) Amazon S3
15 5 (5.88%) Azure AKS
16 4 (4.71%) Amazon ECS
16 4 (4.71%) Azure Functions
17 3 (3.53%) Azure Logic Apps
Communications & Networking
1 13 (15.29%) Network Security
2 5 (5.88%) Firewall
3 2 (2.35%) VPN
4 1 (1.18%) OpenVPN
4 1 (1.18%) SSH
Database & Business Intelligence
1 19 (22.35%) PostgreSQL
2 10 (11.76%) MongoDB
3 8 (9.41%) MySQL
4 7 (8.24%) Elasticsearch
5 6 (7.06%) NoSQL
5 6 (7.06%) Redis
6 5 (5.88%) Amazon RDS
6 5 (5.88%) SQL Server
7 3 (3.53%) DynamoDB
7 3 (3.53%) Relational Database
8 2 (2.35%) ClickHouse
8 2 (2.35%) Data Mining
9 1 (1.18%) Amazon Aurora
9 1 (1.18%) Azure SQL Database
9 1 (1.18%) Data Warehouse
9 1 (1.18%) InfluxDB
Development Applications
1 19 (22.35%) Jenkins
2 16 (18.82%) Git
3 11 (12.94%) GitLab
3 11 (12.94%) JIRA
4 9 (10.59%) SonarQube
5 6 (7.06%) Maven
6 5 (5.88%) Gradle
6 5 (5.88%) Sonatype Nexus
7 3 (3.53%) Bitbucket
7 3 (3.53%) IBM UrbanCode
7 3 (3.53%) Selenium
8 2 (2.35%) Artifactory
8 2 (2.35%) Atlassian Bamboo
9 1 (1.18%) git-flow
9 1 (1.18%) JUnit
9 1 (1.18%) Mockito
9 1 (1.18%) Octopus Deploy
9 1 (1.18%) TestRail
9 1 (1.18%) Zephyr
General
1 43 (50.59%) Social Skills
2 12 (14.12%) Finance
3 8 (9.41%) Banking
4 7 (8.24%) Games
5 6 (7.06%) Public Sector
6 5 (5.88%) Analytical Skills
6 5 (5.88%) Law
7 3 (3.53%) Inclusion and Diversity
7 3 (3.53%) Marketing
8 2 (2.35%) Military
8 2 (2.35%) Presentation Skills
9 1 (1.18%) Influencing Skills
9 1 (1.18%) Retail
Job Titles
1 21 (24.71%) DevOps Engineer
1 21 (24.71%) Senior
2 15 (17.65%) Architect
2 15 (17.65%) AWS Architect
3 13 (15.29%) Cloud Architect
3 13 (15.29%) Developer
3 13 (15.29%) Site Engineer
3 13 (15.29%) Site Reliability Engineer
4 10 (11.76%) Senior Developer
5 7 (8.24%) Consultant
6 6 (7.06%) Platform Engineer
6 6 (7.06%) Software Engineer
7 5 (5.88%) Backend Developer
7 5 (5.88%) Senior Backend Developer
7 5 (5.88%) Senior DevOps
7 5 (5.88%) Senior DevOps Engineer
7 5 (5.88%) Senior Software Developer
7 5 (5.88%) Software Developer
8 4 (4.71%) Infrastructure Manager
8 4 (4.71%) IT Manager
Libraries, Frameworks & Software Standards
1 31 (36.47%) Elastic Stack
2 21 (24.71%) Kafka
3 11 (12.94%) React
3 11 (12.94%) Spring
4 10 (11.76%) RESTful
5 9 (10.59%) Django
5 9 (10.59%) Flask
6 8 (9.41%) FastAPI
7 6 (7.06%) OpenTelemetry
7 6 (7.06%) RabbitMQ
7 6 (7.06%) Spring Boot
7 6 (7.06%) WebSockets
8 5 (5.88%) GraphQL
8 5 (5.88%) Keycloak
8 5 (5.88%) OAuth
8 5 (5.88%) pytest
8 5 (5.88%) SQLAlchemy
9 3 (3.53%) ARM Templates
9 3 (3.53%) Loki
9 3 (3.53%) Playwright
Miscellaneous
1 24 (28.24%) Cloud Native
2 20 (23.53%) Management Information System
3 6 (7.06%) Data Centre
3 6 (7.06%) Onboarding
4 5 (5.88%) Legacy Systems
4 5 (5.88%) Mobile Games
5 4 (4.71%) Clustering
5 4 (4.71%) Cyber Threat
5 4 (4.71%) Replication
6 3 (3.53%) Distributed Systems
6 3 (3.53%) Mainframe
7 2 (2.35%) Embedded Systems
7 2 (2.35%) Mobile App
8 1 (1.18%) Data Protection Act
8 1 (1.18%) Educational Technology
8 1 (1.18%) Product Ownership
8 1 (1.18%) Social Network
Operating Systems
1 19 (22.35%) Linux
2 9 (10.59%) Windows
3 3 (3.53%) Unix
4 2 (2.35%) VMS
4 2 (2.35%) Windows Server
5 1 (1.18%) Debian
5 1 (1.18%) Ubuntu
5 1 (1.18%) Windows Server 2016
Processes & Methodologies
1 60 (70.59%) DevOps
2 55 (64.71%) CI/CD
3 46 (54.12%) Containerisation
4 36 (42.35%) Microservices
5 32 (37.65%) Infrastructure as Code
6 30 (35.29%) Observability
7 29 (34.12%) Problem-Solving
8 27 (31.76%) Agile
8 27 (31.76%) Software Engineering
9 26 (30.59%) Computer Science
10 25 (29.41%) Deployment Automation
11 23 (27.06%) Incident Response
12 21 (24.71%) Mentoring
13 20 (23.53%) Cost Optimisation
13 20 (23.53%) High Availability
14 19 (22.35%) Event-Driven
14 19 (22.35%) Event-Driven Architecture
15 18 (21.18%) Cloud Security
15 18 (21.18%) Design Patterns
16 17 (20.00%) Site Reliability Engineering
Programming Languages
1 46 (54.12%) Python
2 39 (45.88%) Java
3 25 (29.41%) Bash
4 13 (15.29%) TypeScript
5 12 (14.12%) SQL
6 10 (11.76%) PowerShell
7 7 (8.24%) JavaScript
8 6 (7.06%) Go
9 5 (5.88%) C++
10 4 (4.71%) Groovy
11 3 (3.53%) Bicep
12 2 (2.35%) C
13 1 (1.18%) C#
13 1 (1.18%) Rust
Qualifications
1 29 (34.12%) Security Cleared
2 28 (32.94%) Degree
3 26 (30.59%) Computer Science Degree
4 20 (23.53%) AWS Certification
4 20 (23.53%) SC Cleared
5 19 (22.35%) AWS Certified Solutions Architect
6 5 (5.88%) BPSS Clearance
7 3 (3.53%) OCP
7 3 (3.53%) Oracle Certification
8 2 (2.35%) DV Cleared
8 2 (2.35%) Master's Degree
9 1 (1.18%) PhD
Quality Assurance & Compliance
1 15 (17.65%) GDPR
1 15 (17.65%) HIPAA
2 11 (12.94%) QA
3 5 (5.88%) ISO/IEC 27001
4 1 (1.18%) SOC 2
System Software
1 48 (56.47%) Docker
2 5 (5.88%) Active Directory
3 4 (4.71%) Hyper-V
Systems Management
1 65 (76.47%) Kubernetes
2 55 (64.71%) Grafana
3 43 (50.59%) Terraform
4 15 (17.65%) Ansible
5 10 (11.76%) Argo
6 4 (4.71%) Failover Clustering
6 4 (4.71%) Kibana
7 3 (3.53%) Istio
7 3 (3.53%) Progress Chef
7 3 (3.53%) Puppet
8 2 (2.35%) Active Directory Federation Services
8 2 (2.35%) logstash
8 2 (2.35%) Nagios
9 1 (1.18%) Check_MK
9 1 (1.18%) FortiGate
9 1 (1.18%) Kustomize
9 1 (1.18%) Opsgenie
9 1 (1.18%) Single Sign-On
9 1 (1.18%) ZABBIX
Vendors
1 10 (11.76%) Dynatrace
1 10 (11.76%) Microsoft
2 8 (9.41%) New Relic
3 7 (8.24%) Google
4 6 (7.06%) VMware
5 5 (5.88%) Splunk
6 4 (4.71%) Atlassian
7 3 (3.53%) IBM
8 2 (2.35%) Commvault
9 1 (1.18%) AppDynamics
9 1 (1.18%) Imperva
9 1 (1.18%) Okta
9 1 (1.18%) SaltStack
9 1 (1.18%) SEEBURGER