DevSecOps Jobs in England

DevSecOps
UK > England

The table below provides summary statistics for permanent job vacancies advertised in England requiring DevSecOps skills. It includes a benchmarking guide to the annual salaries offered in vacancies that cited DevSecOps over the 6 months leading up to 23 August 2025, comparing them to the same period in the previous two years.

6 months to
23 Aug 2025
Same period 2024 Same period 2023
Rank 449 408 300
Rank change year-on-year -41 -108 +190
DemandTrendPermanent jobs citing DevSecOps 271 441 684
As % of all permanent jobs advertised in England 0.51% 0.58% 1.08%
As % of the Processes & Methodologies category 0.57% 0.72% 1.14%
Number of salaries quoted 159 330 398
10th Percentile £49,750 £51,125 £51,401
25th Percentile £65,000 £60,000 £63,661
Median annual salary (50th Percentile) £77,500 £85,000 £82,500
Median % change year-on-year -8.82% +3.03% +6.45%
75th Percentile £93,750 £104,688 £97,500
90th Percentile £110,500 £115,000 £113,750
UK median annual salary £77,500 £80,000 £83,750
% change year-on-year -3.13% -4.48% +8.06%

All Process and Methodology Skills
England

DevSecOps falls under the Processes and Methodologies category. For comparison with the information above, the following table provides summary statistics for all permanent job vacancies requiring process or methodology skills in England.

DemandTrendPermanent vacancies with a requirement for process or methodology skills 47,422 61,600 60,170
As % of all permanent jobs advertised in England 89.25% 81.69% 95.01%
Number of salaries quoted 25,212 37,964 41,112
10th Percentile £28,000 £31,250 £33,750
25th Percentile £37,500 £41,250 £45,250
Median annual salary (50th Percentile) £55,000 £55,107 £62,450
Median % change year-on-year -0.19% -11.76% +4.08%
75th Percentile £75,000 £75,000 £81,250
90th Percentile £95,000 £95,000 £100,000
UK median annual salary £55,000 £55,000 £60,000
% change year-on-year - -8.33% -

DevSecOps
Job Vacancy Trend in England

Job postings citing DevSecOps as a proportion of all IT jobs advertised in England.
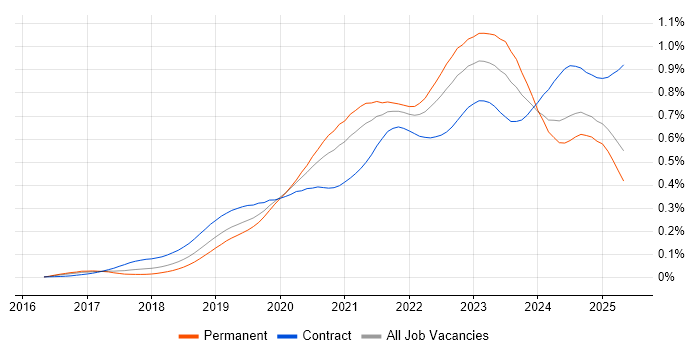
Job vacancy trend for DevSecOps in England

DevSecOps
Salary Trend in England

Salary distribution trend for jobs in England citing DevSecOps.

Salary distribution trend for jobs in England citing DevSecOps

DevSecOps
Salary Histogram in England

Salary distribution for jobs citing DevSecOps in England over the 6 months to 23 August 2025.

Salary histogram for DevSecOps in England

DevSecOps
Job Locations in England

The table below looks at the demand and provides a guide to the median salaries quoted in IT jobs citing DevSecOps within the England region over the 6 months to 23 August 2025. The 'Rank Change' column provides an indication of the change in demand within each location based on the same 6 month period last year.

Location Rank Change
on Same Period
Last Year
Matching
DemandTrendPermanent
IT Job Ads
Median Salary
Past 6 Months
Median Salary
% Change
on Same Period
Last Year
Live
Jobs
London +12 168 £77,500 -22.50% 133
South East -21 34 £81,250 +35.42% 65
South West +76 25 £75,000 -3.23% 34
Midlands +6 20 £75,000 +3.45% 18
West Midlands -7 17 £92,500 +27.59% 12
North of England -24 15 £74,750 +6.79% 36
North West -11 9 £74,500 +35.45% 22
Yorkshire +14 4 £95,000 +2.70% 7
East of England -20 3 £71,500 +10.00% 16
East Midlands +17 2 £65,000 -10.34% 6
North East +15 2 £75,000 +49.08% 7
DevSecOps
UK

DevSecOps
Co-occurring Skills and Capabilities in England by Category

The follow tables expand on the table above by listing co-occurrences grouped by category. The same employment type, locality and period is covered with up to 20 co-occurrences shown in each of the following categories:

Application Platforms
1 13 (4.80%) SharePoint
2 11 (4.06%) Apache Airflow
3 8 (2.95%) Appian
4 6 (2.21%) Apache
4 6 (2.21%) Apache Spark
5 5 (1.85%) Confluence
6 3 (1.11%) Microsoft Exchange
7 2 (0.74%) Jupyter
8 1 (0.37%) nginx
8 1 (0.37%) Oracle SOA Suite
Applications
1 1 (0.37%) Microsoft Excel
1 1 (0.37%) Microsoft Project
Business Applications
1 1 (0.37%) Loan IQ
1 1 (0.37%) NetSuite
1 1 (0.37%) SAP S/4HANA
Cloud Services
1 164 (60.52%) Azure
2 84 (31.00%) AWS
3 71 (26.20%) Azure DevOps
4 53 (19.56%) PaaS
5 38 (14.02%) GitHub
6 37 (13.65%) Serverless
7 32 (11.81%) GCP
8 27 (9.96%) GitHub Actions
9 18 (6.64%) AWS Lambda
10 17 (6.27%) Power Platform
11 15 (5.54%) Amazon S3
12 13 (4.80%) Azure Cosmos DB
12 13 (4.80%) Azure Logic Apps
12 13 (4.80%) SaaS
13 12 (4.43%) Azure App Service
13 12 (4.43%) Azure Functions
13 12 (4.43%) Azure Service Bus
13 12 (4.43%) Entra ID
13 12 (4.43%) OpenShift
14 9 (3.32%) Microsoft 365
Communications & Networking
1 22 (8.12%) Firewall
2 21 (7.75%) Network Security
3 11 (4.06%) VPN
4 8 (2.95%) WAN
5 6 (2.21%) DNS
6 5 (1.85%) SD-WAN
7 4 (1.48%) IPv4
8 3 (1.11%) HTTP
8 3 (1.11%) HTTPS
8 3 (1.11%) LAN
8 3 (1.11%) VoIP
9 2 (0.74%) OSPF
9 2 (0.74%) TCP/IP
9 2 (0.74%) VLAN
10 1 (0.37%) AMQP
10 1 (0.37%) BGP
10 1 (0.37%) Intrusion Detection
10 1 (0.37%) Reverse Proxy
10 1 (0.37%) SAN
10 1 (0.37%) SSL
Database & Business Intelligence
1 12 (4.43%) MongoDB
2 10 (3.69%) PostgreSQL
3 9 (3.32%) NoSQL
4 8 (2.95%) Data Lake
4 8 (2.95%) Metadata
5 7 (2.58%) Power BI
6 4 (1.48%) Elasticsearch
7 3 (1.11%) Airbyte
7 3 (1.11%) Amazon RDS
8 2 (0.74%) Big Data
8 2 (0.74%) BigQuery
8 2 (0.74%) DynamoDB
8 2 (0.74%) Pinecone
8 2 (0.74%) SQL Server
9 1 (0.37%) Apache Cassandra
9 1 (0.37%) Relational Database
9 1 (0.37%) Tableau
Development Applications
1 18 (6.64%) GitLab
2 16 (5.90%) Git
3 13 (4.80%) Jenkins
4 10 (3.69%) Snyk
5 9 (3.32%) Selenium
6 8 (2.95%) Robot Framework
6 8 (2.95%) SonarQube
7 5 (1.85%) JIRA
8 4 (1.48%) JUnit
9 2 (0.74%) Bitbucket
9 2 (0.74%) Burp Suite
10 1 (0.37%) Artifactory
10 1 (0.37%) Metasploit
10 1 (0.37%) Octopus Deploy
10 1 (0.37%) Postman
10 1 (0.37%) REST Assured
10 1 (0.37%) SoapUI
10 1 (0.37%) Sonatype Nexus
10 1 (0.37%) TeamCity
10 1 (0.37%) Yeoman
General
1 117 (43.17%) Finance
2 55 (20.30%) Social Skills
3 24 (8.86%) Telecoms
4 19 (7.01%) Banking
4 19 (7.01%) Law
5 16 (5.90%) Manufacturing
6 14 (5.17%) Analytical Skills
7 13 (4.80%) Marketing
7 13 (4.80%) Public Sector
8 12 (4.43%) Inclusion and Diversity
9 10 (3.69%) Electronics
9 10 (3.69%) Legal
10 9 (3.32%) Influencing Skills
11 7 (2.58%) Front Office
12 5 (1.85%) Documentation Skills
12 5 (1.85%) Retail
13 4 (1.48%) Investment Banking
13 4 (1.48%) Presentation Skills
14 3 (1.11%) Automotive
15 2 (0.74%) Aerospace
Job Titles
1 52 (19.19%) Lead
2 50 (18.45%) Senior
3 47 (17.34%) Security Engineer
4 36 (13.28%) DevSecOps Engineer
5 27 (9.96%) DevOps Engineer
6 23 (8.49%) Architect
6 23 (8.49%) Developer
6 23 (8.49%) Software Engineer
7 17 (6.27%) Azure Engineer
7 17 (6.27%) Cloud Engineer
8 15 (5.54%) Senior Developer
9 11 (4.06%) Security Manager
10 10 (3.69%) Senior Manager
11 9 (3.32%) Consultant
11 9 (3.32%) Platform Engineer
11 9 (3.32%) Solutions Architect
12 8 (2.95%) Analyst
12 8 (2.95%) Applications Architect
12 8 (2.95%) IT Manager
12 8 (2.95%) Security Consultant
Libraries, Frameworks & Software Standards
1 42 (15.50%) YAML
2 40 (14.76%) React
3 24 (8.86%) .NET
4 14 (5.17%) .NET Framework
4 14 (5.17%) HTML
5 13 (4.80%) CSS
6 11 (4.06%) PyTorch
6 11 (4.06%) Spring
6 11 (4.06%) Spring Boot
6 11 (4.06%) TensorFlow
7 10 (3.69%) Apache NiFi
7 10 (3.69%) FastAPI
7 10 (3.69%) Node.js
7 10 (3.69%) REST
8 9 (3.32%) JSON
8 9 (3.32%) Kafka
9 8 (2.95%) Keras
10 7 (2.58%) AngularJS
11 6 (2.21%) ARM Templates
11 6 (2.21%) OAuth
Miscellaneous
1 77 (28.41%) Cloud Native
2 44 (16.24%) Security Posture
3 23 (8.49%) Management Information System
4 19 (7.01%) Product Ownership
5 12 (4.43%) Cloud Security Posture
5 12 (4.43%) Low-Code
6 10 (3.69%) Data Centre
6 10 (3.69%) Virtual Team
7 9 (3.32%) Hybrid Cloud
7 9 (3.32%) PKI
7 9 (3.32%) Public Cloud
8 7 (2.58%) Self-Motivation
9 5 (1.85%) Analytical Mindset
10 4 (1.48%) Onboarding
11 3 (1.11%) Data Structures
11 3 (1.11%) Private Cloud
11 3 (1.11%) Spread Betting
12 2 (0.74%) Algorithms
12 2 (0.74%) Derivative
12 2 (0.74%) Taxonomies
Operating Systems
1 28 (10.33%) Linux
2 23 (8.49%) Windows
3 4 (1.48%) Unix
4 2 (0.74%) VMS
5 1 (0.37%) Ubuntu
5 1 (0.37%) Windows Server
Processes & Methodologies
1 165 (60.89%) CI/CD
2 145 (53.51%) Agile
3 131 (48.34%) DevOps
4 80 (29.52%) Test Automation
5 76 (28.04%) Mentoring
6 68 (25.09%) Cybersecurity
7 67 (24.72%) Infrastructure as Code
8 63 (23.25%) SDLC
9 50 (18.45%) Application Security
9 50 (18.45%) Cloud Security
9 50 (18.45%) OWASP
9 50 (18.45%) Security Testing
10 48 (17.71%) Coaching
10 48 (17.71%) Computer Science
11 46 (16.97%) Microservices
12 45 (16.61%) Artificial Intelligence
13 43 (15.87%) Threat Modelling
14 39 (14.39%) Problem-Solving
15 38 (14.02%) Containerisation
16 36 (13.28%) Platform Engineering
Programming Languages
1 94 (34.69%) Python
2 67 (24.72%) PowerShell
3 50 (18.45%) Java
4 36 (13.28%) JavaScript
5 24 (8.86%) TypeScript
6 23 (8.49%) Bash
7 21 (7.75%) Bicep
7 21 (7.75%) C#
8 15 (5.54%) SQL
9 13 (4.80%) Go
10 11 (4.06%) R
11 5 (1.85%) C++
11 5 (1.85%) Rust
12 4 (1.48%) Shell Script
13 2 (0.74%) Apex Code
13 2 (0.74%) Kotlin
14 1 (0.37%) C
14 1 (0.37%) Groovy
14 1 (0.37%) T-SQL
Qualifications
1 68 (25.09%) Degree
2 52 (19.19%) Security Cleared
3 38 (14.02%) Computer Science Degree
3 38 (14.02%) Master's Degree
4 27 (9.96%) DV Cleared
4 27 (9.96%) SC Cleared
5 17 (6.27%) CISSP
6 16 (5.90%) Cisco Certification
7 14 (5.17%) (ISC)2 CCSP
8 12 (4.43%) AWS Certification
8 12 (4.43%) Azure Certification
8 12 (4.43%) CISM
9 9 (3.32%) Microsoft Certification
10 8 (2.95%) CCSP
11 7 (2.58%) CCSK
11 7 (2.58%) CompTIA Security+
12 5 (1.85%) CISA
13 4 (1.48%) ISACA
13 4 (1.48%) OSCP
13 4 (1.48%) TOGAF Certification
Quality Assurance & Compliance
1 50 (18.45%) ISO/IEC 27001
2 49 (18.08%) NIST
3 32 (11.81%) NCSC
4 10 (3.69%) GDPR
5 8 (2.95%) Data Quality
6 5 (1.85%) HIPAA
6 5 (1.85%) JSP 440
7 4 (1.48%) PMO
7 4 (1.48%) SLA
8 3 (1.11%) GRC
8 3 (1.11%) PMBOK
8 3 (1.11%) QA
8 3 (1.11%) SOC 2
9 2 (0.74%) Cyber Essentials
9 2 (0.74%) ITGC
10 1 (0.37%) Accessibility
10 1 (0.37%) COBIT
10 1 (0.37%) EU AI Act
10 1 (0.37%) ISO/IEC 27005
System Software
1 30 (11.07%) Docker
2 10 (3.69%) Active Directory
3 5 (1.85%) VMware Infrastructure
4 3 (1.11%) Virtual Desktop
4 3 (1.11%) XenApp
4 3 (1.11%) XenDesktop
Systems Management
1 55 (20.30%) Kubernetes
2 48 (17.71%) Terraform
3 24 (8.86%) Ansible
4 8 (2.95%) Microsoft Intune
4 8 (2.95%) Prometheus
5 7 (2.58%) Single Sign-On
6 6 (2.21%) Puppet
7 5 (1.85%) HP Fortify
8 3 (1.11%) CASB
8 3 (1.11%) Grafana
8 3 (1.11%) SCCM
9 2 (0.74%) Kibana
9 2 (0.74%) Progress Chef
10 1 (0.37%) Argo
10 1 (0.37%) Computer Emergency Response Teams
10 1 (0.37%) CSIRT
10 1 (0.37%) Nessus
10 1 (0.37%) QRadar
10 1 (0.37%) RSA Archer
Vendors
1 63 (23.25%) Microsoft
2 16 (5.90%) Google
3 13 (4.80%) VMware
4 12 (4.43%) Oracle
5 9 (3.32%) Salesforce
6 8 (2.95%) Atlassian
6 8 (2.95%) BiZZdesign
6 8 (2.95%) Black Duck
6 8 (2.95%) Databricks
6 8 (2.95%) Dell
6 8 (2.95%) NVIDIA
6 8 (2.95%) SAP
6 8 (2.95%) UiPath
7 5 (1.85%) Tanium
8 3 (1.11%) Blue Prism
8 3 (1.11%) Citrix
8 3 (1.11%) Coverity
8 3 (1.11%) ForgeRock
8 3 (1.11%) Symantec
8 3 (1.11%) Zscaler