Requirements Gathering Jobs in England

Requirements Gathering (Requirements Elicitation)
UK > England

The table below provides summary statistics for permanent job vacancies advertised in England requiring Requirements Gathering skills. It includes a benchmarking guide to the annual salaries offered in vacancies that cited Requirements Gathering over the 6 months leading up to 12 May 2025, comparing them to the same period in the previous two years.

6 months to
12 May 2025
Same period 2024 Same period 2023
Rank 230 190 201
Rank change year-on-year -40 +11 -5
Permanent jobs citing Requirements Gathering 711 1,333 1,653
As % of all permanent jobs advertised in England 1.46% 1.55% 1.84%
As % of the Processes & Methodologies category 1.55% 1.82% 1.92%
Number of salaries quoted 532 981 1,142
10th Percentile £38,750 £35,000 £41,250
25th Percentile £45,000 £42,500 £48,750
Median annual salary (50th Percentile) £60,000 £55,000 £60,000
Median % change year-on-year +9.09% -8.33% +8.81%
75th Percentile £77,500 £72,500 £76,250
90th Percentile £92,450 £87,500 £90,000
UK median annual salary £60,000 £54,598 £60,000
% change year-on-year +9.89% -9.00% +6.19%

All Process and Methodology Skills
England

Requirements Gathering falls under the Processes and Methodologies category. For comparison with the information above, the following table provides summary statistics for all permanent job vacancies requiring process or methodology skills in England.

Permanent vacancies with a requirement for process or methodology skills 45,933 73,419 85,900
As % of all permanent jobs advertised in England 94.08% 85.47% 95.62%
Number of salaries quoted 24,038 53,988 50,920
10th Percentile £30,000 £29,000 £34,308
25th Percentile £42,500 £40,000 £46,000
Median annual salary (50th Percentile) £57,500 £55,000 £62,500
Median % change year-on-year +4.55% -12.00% +4.17%
75th Percentile £76,250 £73,500 £82,500
90th Percentile £100,000 £93,750 £101,250
UK median annual salary £57,500 £55,000 £61,000
% change year-on-year +4.55% -9.84% +1.67%

Requirements Gathering
Job Vacancy Trend in England

Job postings citing Requirements Gathering as a proportion of all IT jobs advertised in England.
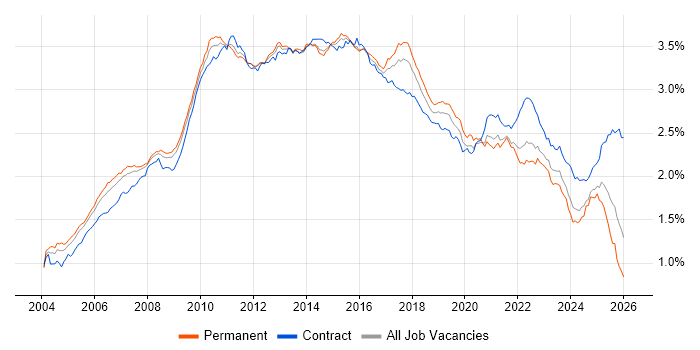
Job vacancy trend for Requirements Gathering in England

Requirements Gathering
Salary Trend in England

3-month moving average salary quoted in jobs citing Requirements Gathering in England.

Salary trend for Requirements Gathering in England

Requirements Gathering
Salary Histogram in England

Salary distribution for jobs citing Requirements Gathering in England over the 6 months to 12 May 2025.

Salary histogram for Requirements Gathering in England

Requirements Gathering
Job Locations in England

The table below looks at the demand and provides a guide to the median salaries quoted in IT jobs citing Requirements Gathering within the England region over the 6 months to 12 May 2025. The 'Rank Change' column provides an indication of the change in demand within each location based on the same 6 month period last year.

Location Rank Change
on Same Period
Last Year
Matching
Permanent
IT Job Ads
Median Salary
Past 6 Months
Median Salary
% Change
on Same Period
Last Year
Live
Jobs
London -2 266 £72,500 +3.57% 561
Midlands +45 150 £52,500 +16.67% 67
North of England -15 129 £50,055 -2.33% 135
West Midlands +64 116 £53,250 +18.33% 49
North West -17 106 £50,055 +0.11% 96
South East -41 87 £46,250 -7.50% 189
East Midlands +13 33 £47,500 +7.34% 16
East of England -3 30 £62,750 +26.77% 50
Yorkshire +10 21 £50,000 -9.01% 26
South West -11 17 £51,250 +2.50% 45
North East +35 2 £49,550 -14.52% 13
Requirements Gathering
UK

Requirements Gathering
Co-occurring Skills and Capabilities in England by Category

The follow tables expand on the table above by listing co-occurrences grouped by category. The same employment type, locality and period is covered with up to 20 co-occurrences shown in each of the following categories:

Application Platforms
1 33 (4.64%) Confluence
2 26 (3.66%) SharePoint
3 9 (1.27%) CMS
4 4 (0.56%) Apache Spark
5 3 (0.42%) Apache
6 2 (0.28%) Kinematics
6 2 (0.28%) Oracle Workflow
6 2 (0.28%) Sitecore CMS
6 2 (0.28%) Skype for Business
7 1 (0.14%) SharePoint Server
Applications
1 40 (5.63%) Microsoft Excel
2 26 (3.66%) Microsoft Office
3 17 (2.39%) MS Visio
4 12 (1.69%) Microsoft PowerPoint
5 11 (1.55%) Microsoft Project
6 4 (0.56%) Chatbot
7 3 (0.42%) Adobe XD
8 2 (0.28%) Oracle Smart View
8 2 (0.28%) Spreadsheet
9 1 (0.14%) AutoCAD
9 1 (0.14%) Notion
9 1 (0.14%) Sketch
9 1 (0.14%) Trello
Business Applications
1 77 (10.83%) NetSuite
2 11 (1.55%) SAP S/4HANA
3 10 (1.41%) Shopify
4 9 (1.27%) Magento
5 8 (1.13%) Dynamics CRM
6 7 (0.98%) Dynamics AX
6 7 (0.98%) Infor M3
6 7 (0.98%) Oracle ERP
7 4 (0.56%) Remedy ITSM
8 3 (0.42%) Elite 3E
8 3 (0.42%) Oracle Assets
8 3 (0.42%) Oracle General Ledger
8 3 (0.42%) Oracle Payables
8 3 (0.42%) Oracle Receivables
8 3 (0.42%) SAP EWM
8 3 (0.42%) SAP MM
9 2 (0.28%) Dynamics NAV
9 2 (0.28%) SAP Business One
9 2 (0.28%) SAP MDG
9 2 (0.28%) Siebel CRM
Cloud Services
1 96 (13.50%) Power Platform
2 87 (12.24%) Azure
3 49 (6.89%) Dynamics 365
4 47 (6.61%) AWS
5 41 (5.77%) SaaS
6 17 (2.39%) Azure Data Factory
7 16 (2.25%) Serverless
8 14 (1.97%) Azure Logic Apps
8 14 (1.97%) Cloud Computing
8 14 (1.97%) Microsoft 365
9 10 (1.41%) PowerApps
10 9 (1.27%) Amazon S3
10 9 (1.27%) Entra ID
11 8 (1.13%) Power Automate
12 7 (0.98%) Amazon EC2
12 7 (0.98%) Azure Monitor
12 7 (0.98%) Virtual Private Cloud
13 6 (0.84%) Amazon ECR
13 6 (0.84%) Amazon EKS
13 6 (0.84%) Azure DevOps
Communications & Networking
1 16 (2.25%) LAN
1 16 (2.25%) WAN
2 15 (2.11%) BGP
2 15 (2.11%) IPsec
2 15 (2.11%) MPLS
3 14 (1.97%) Cisco IOS
3 14 (1.97%) Junos
4 13 (1.83%) HTTP
5 4 (0.56%) VPN
6 2 (0.28%) ATM
6 2 (0.28%) Cisco Firepower
6 2 (0.28%) Skype
6 2 (0.28%) Wi-Fi
6 2 (0.28%) Wireless
7 1 (0.14%) Bluetooth
7 1 (0.14%) CDMA
7 1 (0.14%) GPRS
7 1 (0.14%) ISDN
7 1 (0.14%) SDH
7 1 (0.14%) VoIP
Database & Business Intelligence
1 74 (10.41%) Power BI
2 42 (5.91%) Data Warehouse
2 42 (5.91%) SQL Server
3 19 (2.67%) Data Lake
4 15 (2.11%) Relational Database
5 13 (1.83%) SQL Server Integration Services
6 11 (1.55%) MySQL
7 10 (1.41%) SQL Server Reporting Services
8 9 (1.27%) Azure SQL Database
9 8 (1.13%) MongoDB
9 8 (1.13%) Tableau
9 8 (1.13%) Tick Data
10 7 (0.98%) Amazon RDS
10 7 (0.98%) DB2
10 7 (0.98%) Enterprise Data Warehouse
10 7 (0.98%) PostgreSQL
11 5 (0.70%) BusinessObjects
11 5 (0.70%) MariaDB
12 4 (0.56%) Big Data
12 4 (0.56%) Metadata
Development Applications
1 60 (8.44%) JIRA
2 42 (5.91%) Rational DOORS
3 15 (2.11%) Git
4 11 (1.55%) PowerBuilder
5 10 (1.41%) Visual Studio
6 9 (1.27%) GitLab
7 4 (0.56%) LSMW
8 2 (0.28%) Android Studio
8 2 (0.28%) Eclipse
8 2 (0.28%) ERwin
8 2 (0.28%) Jenkins
8 2 (0.28%) Maven
8 2 (0.28%) Selenium
8 2 (0.28%) TeamCity
8 2 (0.28%) Xcode
9 1 (0.14%) JUnit
9 1 (0.14%) NetBeans
9 1 (0.14%) Oracle APEX
General
1 262 (36.85%) Social Skills
2 243 (34.18%) Finance
3 226 (31.79%) Analytical Skills
4 76 (10.69%) Law
5 66 (9.28%) Manufacturing
6 60 (8.44%) Organisational Skills
7 37 (5.20%) Marketing
8 35 (4.92%) Presentation Skills
9 25 (3.52%) Banking
9 25 (3.52%) Legal
10 23 (3.23%) Documentation Skills
11 22 (3.09%) Public Sector
11 22 (3.09%) Retail
12 15 (2.11%) Billing
13 13 (1.83%) Front Office
14 11 (1.55%) Influencing Skills
15 9 (1.27%) General Ledger
15 9 (1.27%) Inclusion and Diversity
16 8 (1.13%) Electronics
17 7 (0.98%) Investment Banking
Job Titles
1 240 (33.76%) Analyst
2 169 (23.77%) Business Analyst
3 125 (17.58%) Consultant
4 90 (12.66%) Senior
5 68 (9.56%) Functional Consultant
6 62 (8.72%) NetSuite Consultant
7 60 (8.44%) Developer
8 58 (8.16%) Lead
9 46 (6.47%) Senior Analyst
10 42 (5.91%) Architect
11 38 (5.34%) Logistics Engineer
11 38 (5.34%) Project Engineer
11 38 (5.34%) Systems Analyst
12 36 (5.06%) Systems Engineer
13 28 (3.94%) Technical Analyst
14 25 (3.52%) Electronics Engineer
14 25 (3.52%) Technical Business Analyst
15 22 (3.09%) Business Systems Analyst
16 21 (2.95%) Senior Business Analyst
16 21 (2.95%) Senior Consultant
Libraries, Frameworks & Software Standards
1 34 (4.78%) .NET
2 28 (3.94%) React
3 27 (3.80%) HTML
4 23 (3.23%) REST
5 22 (3.09%) AngularJS
6 21 (2.95%) SOAP
7 15 (2.11%) ASP.NET
8 13 (1.83%) GraphQL
9 10 (1.41%) .NET Framework
9 10 (1.41%) Django
10 9 (1.27%) Middleware
11 8 (1.13%) CSS
11 8 (1.13%) Web Services
12 6 (0.84%) Flask
12 6 (0.84%) Lambda Expressions
12 6 (0.84%) LangChain
12 6 (0.84%) Vue
12 6 (0.84%) XML
13 5 (0.70%) NestJS
14 4 (0.56%) Next.js
Miscellaneous
1 42 (5.91%) Management Information System
2 40 (5.63%) Product Ownership
3 20 (2.81%) Legacy Systems
4 13 (1.83%) Reinsurance
4 13 (1.83%) Self-Motivation
4 13 (1.83%) Taxonomies
5 12 (1.69%) Analytical Mindset
6 10 (1.41%) Algorithms
7 9 (1.27%) Onboarding
8 7 (0.98%) Mobile App
8 7 (0.98%) Social Media
9 6 (0.84%) Cloud Native
9 6 (0.84%) Mainframe
9 6 (0.84%) Molecular Biology
10 5 (0.70%) Data Protection Act
10 5 (0.70%) Driving Licence
10 5 (0.70%) PMI
11 4 (0.56%) Educational Technology
11 4 (0.56%) PropTech
11 4 (0.56%) Virtual Team
Operating Systems
1 17 (2.39%) Windows
2 8 (1.13%) Linux
3 5 (0.70%) Windows Vista
4 4 (0.56%) Unix
5 3 (0.42%) Apple iOS
6 2 (0.28%) Android
6 2 (0.28%) Robot Operating System
7 1 (0.14%) AIX
7 1 (0.14%) Windows Server
7 1 (0.14%) Windows Server 2016
Processes & Methodologies
1 199 (27.99%) Problem-Solving
2 192 (27.00%) Agile
3 145 (20.39%) Project Management
4 137 (19.27%) Data Analysis
5 105 (14.77%) Stakeholder Management
6 103 (14.49%) ERP
7 97 (13.64%) CRM
8 96 (13.50%) Migration
9 88 (12.38%) Business Analysis
10 81 (11.39%) User Stories
11 80 (11.25%) Data Migration
12 75 (10.55%) Business Intelligence
13 73 (10.27%) Collaborative Working
14 72 (10.13%) Validation
15 71 (9.99%) Analytics
15 71 (9.99%) Logistics
16 69 (9.70%) Decision-Making
17 61 (8.58%) Data Management
17 61 (8.58%) Roadmaps
18 59 (8.30%) Change Management
Programming Languages
1 138 (19.41%) SQL
2 55 (7.74%) JavaScript
3 47 (6.61%) Python
4 43 (6.05%) C#
5 27 (3.80%) Java
6 21 (2.95%) T-SQL
7 14 (1.97%) PL/SQL
8 13 (1.83%) TypeScript
9 12 (1.69%) C++
10 9 (1.27%) PowerShell
10 9 (1.27%) VB.NET
11 8 (1.13%) Kotlin
12 6 (0.84%) RPG
13 5 (0.70%) Go
13 5 (0.70%) VBA
14 4 (0.56%) ABAP
14 4 (0.56%) C
15 3 (0.42%) Data Analysis Expressions
15 3 (0.42%) Swift
16 2 (0.28%) Shell Script
Qualifications
1 184 (25.88%) Degree
2 47 (6.61%) Security Cleared
3 36 (5.06%) SC Cleared
4 34 (4.78%) HNC
5 27 (3.80%) BPSS Clearance
6 26 (3.66%) HND
7 17 (2.39%) CCNA
7 17 (2.39%) CCNP
7 17 (2.39%) Cisco Certification
7 17 (2.39%) Computer Science Degree
7 17 (2.39%) JNCIS
8 16 (2.25%) Microsoft Certification
9 15 (2.11%) Master's Degree
10 12 (1.69%) DBS Check
10 12 (1.69%) PMI Certification
11 10 (1.41%) CBAP
11 10 (1.41%) ITIL Foundation Certificate
12 9 (1.27%) IIBA
13 7 (0.98%) PMP
14 6 (0.84%) DV Cleared
Quality Assurance & Compliance
1 38 (5.34%) QA
2 23 (3.23%) SLA
3 14 (1.97%) Data Quality
4 8 (1.13%) GDPR
5 6 (0.84%) GxP
5 6 (0.84%) PMO
6 3 (0.42%) Accessibility
6 3 (0.42%) Solvency II
7 2 (0.28%) Cyber Essentials
7 2 (0.28%) ISO/IEC 27001
7 2 (0.28%) PCI DSS
8 1 (0.14%) Actionable Recommendations
8 1 (0.14%) Dodd-Frank
8 1 (0.14%) GRC
8 1 (0.14%) HIPAA
8 1 (0.14%) MiFID
8 1 (0.14%) Sarbanes-Oxley
8 1 (0.14%) WCAG
System Software
1 34 (4.78%) Docker
2 3 (0.42%) Active Directory
Systems Management
1 28 (3.94%) Kubernetes
2 7 (0.98%) Terraform
3 6 (0.84%) Kustomize
4 3 (0.42%) Systems Management Server (SMS)
5 2 (0.28%) Ansible
6 1 (0.14%) Microsoft Intune
6 1 (0.14%) SCCM
Vendors
1 89 (12.52%) Microsoft
2 47 (6.61%) ServiceNow
3 41 (5.77%) SAP
4 34 (4.78%) Salesforce
5 29 (4.08%) Oracle
6 25 (3.52%) Databricks
7 18 (2.53%) Cisco
8 17 (2.39%) Juniper
9 12 (1.69%) Guidewire
10 7 (0.98%) Infor
10 7 (0.98%) SolarWinds
11 6 (0.84%) BT
11 6 (0.84%) Sawtooth Software
12 5 (0.70%) F5
12 5 (0.70%) Google
12 5 (0.70%) OpenAI
12 5 (0.70%) PeopleSoft
13 4 (0.56%) Remedy
14 3 (0.42%) Adobe
14 3 (0.42%) Intel