Target Operating Model Job Trends

Target Operating Model (TOM)
UK

The table below provides summary statistics and salary benchmarking for jobs requiring Target Operating Model skills. It covers permanent job vacancies from the 6 months leading up to 21 November 2025, with comparisons to the same periods in the previous two years.

6 months to
21 Nov 2025
Same period 2024 Same period 2023
Rank 558 602 542
Rank change year-on-year +44 -60 +136
Permanent jobs citing Target Operating Model 108 151 172
As % of all permanent jobs in the UK 0.20% 0.22% 0.33%
As % of the Processes & Methodologies category 0.24% 0.27% 0.35%
Number of salaries quoted 68 90 117
10th Percentile £52,500 £46,713 £51,255
25th Percentile £63,250 £47,847 £58,750
Median annual salary (50th Percentile) £82,500 £71,250 £70,000
Median % change year-on-year +15.79% +1.79% -5.41%
75th Percentile £100,000 £94,375 £95,000
90th Percentile £115,000 £118,750 £111,000
UK excluding London median annual salary £85,000 £53,750 £65,066
% change year-on-year +58.14% -17.39% -1.79%

All Process and Methodology Skills
UK

Target Operating Model falls under the Processes and Methodologies category. For comparison with the information above, the following table provides summary statistics for all permanent job vacancies requiring process or methodology skills.

Permanent vacancies with a requirement for process or methodology skills 45,592 56,393 48,809
As % of all permanent jobs advertised in the UK 85.45% 83.65% 93.81%
Number of salaries quoted 27,617 29,299 37,445
10th Percentile £28,250 £34,404 £32,500
25th Percentile £36,250 £45,000 £43,750
Median annual salary (50th Percentile) £55,000 £60,000 £60,000
Median % change year-on-year -8.33% - -
75th Percentile £75,000 £80,000 £80,000
90th Percentile £95,000 £97,500 £98,750
UK excluding London median annual salary £47,500 £55,000 £52,500
% change year-on-year -13.64% +4.76% -

Target Operating Model
Job Vacancy Trend

Historical trend showing the proportion of permanent IT job postings citing Target Operating Model relative to all permanent IT jobs advertised.
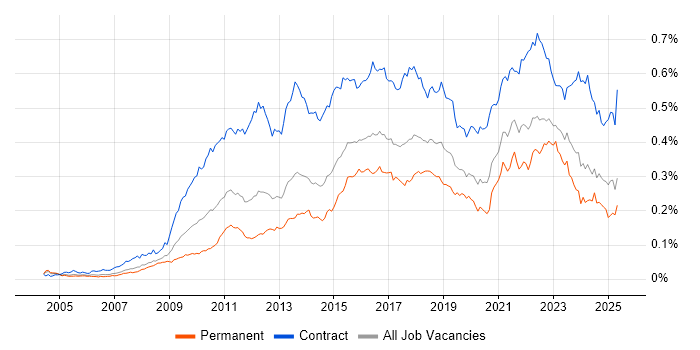
Target Operating Model job vacancy trend in the UK

Target Operating Model
Salary Trend

Salary distribution trend for jobs in the UK citing Target Operating Model.

Salary distribution trend for jobs in the UK citing Target Operating Model

Target Operating Model
Salary Histogram

Salary distribution for jobs citing Target Operating Model over the 6 months to 21 November 2025.

Salary histogram for Target Operating Model in the UK

Target Operating Model
Top 13 Job Locations

The table below looks at the demand and provides a guide to the median salaries quoted in IT jobs citing Target Operating Model within the UK over the 6 months to 21 November 2025. The 'Rank Change' column provides an indication of the change in demand within each location based on the same 6 month period last year.

Location Rank Change
on Same Period
Last Year
Matching
Permanent
IT Job Ads
Median Salary
Past 6 Months
Median Salary
% Change
on Same Period
Last Year
Live
Jobs
England +79 101 £80,000 +6.67% 98
London +65 77 £78,750 -17.11% 70
Work from Home +45 32 £75,000 +13.01% 60
UK excluding London +19 26 £85,000 +58.14% 34
South East +56 11 £87,500 +16.67% 17
North of England +27 6 £82,500 +63.99% 10
Midlands +32 5 £67,500 +10.50% 3
Yorkshire +15 4 £82,500 -8.33% 3
West Midlands +26 3 £67,500 +16.38% 3
Scotland +5 3 £85,000 +68.96%
North West +30 2 £74,750 +35.53% 7
East Midlands +26 2 £50,269 -
South West +29 1 - - 1

Target Operating Model
Co-Occurring Skills & Capabilities by Category

The following tables expand on the one above by listing co-occurrences grouped by category. They cover the same employment type, locality and period, with up to 20 co-occurrences shown in each category:

Application Platforms
1 8 (7.41%) Confluence
2 2 (1.85%) Adobe Experience Manager
3 1 (0.93%) SharePoint
Applications
1 2 (1.85%) Microsoft Excel
2 1 (0.93%) Microsoft Office
2 1 (0.93%) Microsoft PowerPoint
Business Applications
1 8 (7.41%) SAP S/4HANA
2 4 (3.70%) SAP IBP
2 4 (3.70%) SAP MII
2 4 (3.70%) SAP MM
2 4 (3.70%) SAP PP
3 2 (1.85%) Adobe Campaign
3 2 (1.85%) Dynamics CRM
4 1 (0.93%) Oracle EBS
Cloud Services
1 23 (21.30%) Azure
2 17 (15.74%) AWS
2 17 (15.74%) GCP
3 10 (9.26%) Cloud Computing
4 5 (4.63%) Power Platform
5 4 (3.70%) SaaS
6 2 (1.85%) Azure App Service
6 2 (1.85%) Dynamics 365
6 2 (1.85%) GitHub
6 2 (1.85%) GitHub Actions
6 2 (1.85%) Microsoft Purview
7 1 (0.93%) Power Automate
Database & Business Intelligence
1 5 (4.63%) Power BI
2 2 (1.85%) Data Lake
2 2 (1.85%) Data Warehouse
2 2 (1.85%) Metadata
2 2 (1.85%) Tableau
Development Applications
1 9 (8.33%) JIRA
General
1 58 (53.70%) Social Skills
2 54 (50.00%) Finance
3 36 (33.33%) Inclusion and Diversity
4 19 (17.59%) Banking
5 15 (13.89%) Analytical Skills
6 12 (11.11%) Influencing Skills
6 12 (11.11%) Retail
7 8 (7.41%) Marketing
7 8 (7.41%) Presentation Skills
7 8 (7.41%) Public Sector
8 7 (6.48%) Billing
9 6 (5.56%) Manufacturing
10 4 (3.70%) Advertising
10 4 (3.70%) Documentation Skills
10 4 (3.70%) Law
10 4 (3.70%) Legal
10 4 (3.70%) Local Government
11 3 (2.78%) Automotive
11 3 (2.78%) Private Banking
12 2 (1.85%) Wholesale Banking
Job Titles
1 46 (42.59%) Senior
2 26 (24.07%) Analyst
3 22 (20.37%) Business Analyst
4 20 (18.52%) Architect
5 18 (16.67%) Solutions Architect
6 17 (15.74%) Senior Architect
6 17 (15.74%) Senior Solutions Architect
7 14 (12.96%) Consultant
7 14 (12.96%) Project Manager
8 12 (11.11%) Senior Analyst
8 12 (11.11%) Senior Business Analyst
9 10 (9.26%) Lead
9 10 (9.26%) Senior Manager
9 10 (9.26%) Senior Project Manager
10 4 (3.70%) Insurance Business Analyst
10 4 (3.70%) SAP Consultant
10 4 (3.70%) Senior Consultant
10 4 (3.70%) Transformation Manager
11 3 (2.78%) Data Analyst
11 3 (2.78%) SAP WM Consultant
Libraries, Frameworks & Software Standards
1 4 (3.70%) SAP Fiori
2 2 (1.85%) .NET
2 2 (1.85%) EDI
2 2 (1.85%) PySpark
Miscellaneous
1 22 (20.37%) Reinsurance
2 21 (19.44%) Product Ownership
3 10 (9.26%) Distributed Computing
4 9 (8.33%) Cloud Native
5 8 (7.41%) Management Information System
6 4 (3.70%) Greenfield Project
6 4 (3.70%) Manufacturing Execution System
7 3 (2.78%) Analytical Mindset
7 3 (2.78%) Onboarding
7 3 (2.78%) Security Posture
8 2 (1.85%) Cyber Threat
8 2 (1.85%) Enterprise Cloud
8 2 (1.85%) Marketing Technology
9 1 (0.93%) Data Centre
9 1 (0.93%) Derivative
9 1 (0.93%) Equities
9 1 (0.93%) Hybrid Cloud
9 1 (0.93%) NHS
9 1 (0.93%) N-Tier
9 1 (0.93%) Security Operations Centre
Processes & Methodologies
1 53 (49.07%) Agile
2 35 (32.41%) Business Development
3 27 (25.00%) Stakeholder Management
4 25 (23.15%) Project Management
5 23 (21.30%) Analytics
6 22 (20.37%) Business Analysis
7 21 (19.44%) AI
8 20 (18.52%) Customer Experience
8 20 (18.52%) Roadmaps
9 19 (17.59%) Architecture Governance
9 19 (17.59%) Stakeholder Engagement
10 17 (15.74%) Customer-Centricity
11 15 (13.89%) Workshop Facilitation
12 14 (12.96%) Problem-Solving
12 14 (12.96%) Process Improvement
13 13 (12.04%) Digital Innovation
14 12 (11.11%) Asset Management
14 12 (11.11%) Change Management
14 12 (11.11%) Coaching
14 12 (11.11%) Continuous Improvement
Programming Languages
1 6 (5.56%) SQL
2 5 (4.63%) Python
Qualifications
1 19 (17.59%) Degree
2 13 (12.04%) Master's Degree
3 8 (7.41%) MBA
4 4 (3.70%) ACCA
4 4 (3.70%) CISM
4 4 (3.70%) CISSP
4 4 (3.70%) SAP Certification
5 3 (2.78%) APMG
5 3 (2.78%) CRISC
6 2 (1.85%) PMI Certification
6 2 (1.85%) PMP
6 2 (1.85%) Security Cleared
7 1 (0.93%) CFA
7 1 (0.93%) DBS Check
7 1 (0.93%) SC Cleared
Quality Assurance & Compliance
1 4 (3.70%) GMP
2 3 (2.78%) GDPR
2 3 (2.78%) ISO/IEC 27001
3 2 (1.85%) GRC
3 2 (1.85%) NIST
3 2 (1.85%) NIST 800
3 2 (1.85%) PMO
3 2 (1.85%) QA
3 2 (1.85%) SLA
4 1 (0.93%) Accessibility
4 1 (0.93%) Actionable Recommendations
4 1 (0.93%) P3O
Systems Management
1 2 (1.85%) Systems Management Server (SMS)
Vendors
1 10 (9.26%) Microsoft
2 8 (7.41%) SAP
3 7 (6.48%) Guidewire
4 3 (2.78%) Avaloq
4 3 (2.78%) Temenos
5 2 (1.85%) Adobe
5 2 (1.85%) Databricks
5 2 (1.85%) OneTrust
5 2 (1.85%) Salesforce
5 2 (1.85%) Sitecore
6 1 (0.93%) Anaplan
6 1 (0.93%) Google
6 1 (0.93%) Oracle
6 1 (0.93%) ServiceNow