Software Delivery Jobs

Software Delivery
UK

The table below provides summary statistics for permanent job vacancies requiring Software Delivery skills. It includes a benchmarking guide to the annual salaries offered in vacancies that cited Software Delivery over the 6 months leading up to 11 October 2024, comparing them to the same period in the previous two years.

6 months to
11 Oct 2024
Same period 2023 Same period 2022
Rank 425 295 267
Rank change year-on-year -130 -28 +35
Permanent jobs citing Software Delivery 433 676 2,132
As % of all permanent jobs advertised in the UK 0.55% 1.12% 1.47%
As % of the Processes & Methodologies category 0.66% 1.18% 1.53%
Number of salaries quoted 155 420 1,109
10th Percentile £40,000 £45,000 £44,000
25th Percentile £47,250 £52,500 £52,500
Median annual salary (50th Percentile) £67,000 £67,500 £65,000
Median % change year-on-year -0.74% +3.85% +7.08%
75th Percentile £85,625 £84,438 £78,750
90th Percentile £95,000 £100,500 £93,750
UK excluding London median annual salary £60,000 £65,000 £59,750
% change year-on-year -7.69% +8.79% +8.64%

All Process and Methodology Skills
UK

Software Delivery falls under the Processes and Methodologies category. For comparison with the information above, the following table provides summary statistics for all permanent job vacancies requiring process or methodology skills.

Permanent vacancies with a requirement for process or methodology skills 65,317 57,192 139,110
As % of all permanent jobs advertised in the UK 83.49% 94.47% 96.16%
Number of salaries quoted 32,274 40,876 77,262
10th Percentile £33,000 £32,500 £33,950
25th Percentile £43,750 £45,000 £45,000
Median annual salary (50th Percentile) £60,000 £60,000 £60,000
Median % change year-on-year - - +4.35%
75th Percentile £77,500 £80,000 £80,000
90th Percentile £96,250 £97,500 £97,500
UK excluding London median annual salary £52,500 £53,760 £52,500
% change year-on-year -2.34% +2.40% +5.00%

Software Delivery
Job Vacancy Trend

Job postings citing Software Delivery as a proportion of all IT jobs advertised.
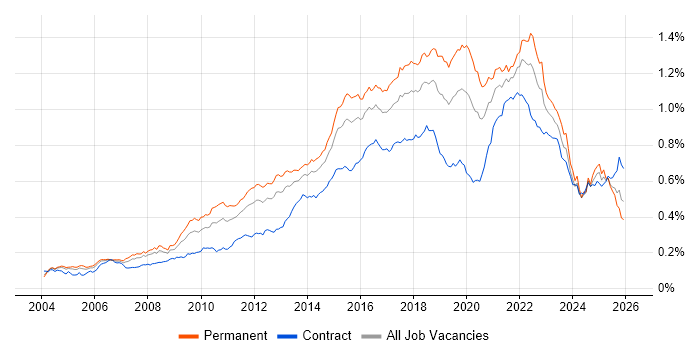
Job vacancy trend for Software Delivery in the UK

Software Delivery
Salary Trend

3-month moving average salary quoted in jobs citing Software Delivery.

Salary trend for Software Delivery in the UK

Software Delivery
Salary Histogram

Salary distribution for jobs citing Software Delivery over the 6 months to 11 October 2024.

Salary histogram for Software Delivery in the UK

Software Delivery
Top 16 Job Locations

The table below looks at the demand and provides a guide to the median salaries quoted in IT jobs citing Software Delivery within the UK over the 6 months to 11 October 2024. The 'Rank Change' column provides an indication of the change in demand within each location based on the same 6 month period last year.

Location Rank Change
on Same Period
Last Year
Matching
Permanent
IT Job Ads
Median Salary
Past 6 Months
Median Salary
% Change
on Same Period
Last Year
Live
Jobs
England -135 362 £70,000 +3.70% 113
UK excluding London -95 290 £60,000 -7.69% 79
Work from Home -56 258 £60,000 -12.40% 149
London -83 110 £85,000 +11.84% 41
South East -14 109 £60,000 -15.34% 16
North of England -77 56 £55,000 -15.38% 25
North West -73 37 £60,000 -7.69% 23
Midlands -57 35 £60,000 +9.09% 13
South West -37 30 £53,750 -10.42% 9
Scotland -15 26 £42,000 -30.58% 5
East Midlands -37 22 £58,750 +9.81% 6
Yorkshire +2 19 £52,500 -23.64% 2
East of England -28 18 £87,500 +35.14% 8
West Midlands -46 13 £100,000 +81.82% 7
Wales +11 12 £51,997 -13.34% 1
Northern Ireland +17 5 - - 7

Software Delivery
Co-occurring Skills and Capabilities by Category

The follow tables expand on the table above by listing co-occurrences grouped by category. The same employment type, locality and period is covered with up to 20 co-occurrences shown in each of the following categories:

Application Platforms
1 84 (19.40%) Oracle Application Server
2 18 (4.16%) Confluence
3 12 (2.77%) Apache
4 10 (2.31%) Apache Spark
5 8 (1.85%) NServiceBus
6 4 (0.92%) Appian
7 1 (0.23%) Liferay
Applications
1 16 (3.70%) Microsoft Office
2 5 (1.15%) Microsoft Excel
2 5 (1.15%) Microsoft PowerPoint
3 1 (0.23%) Chatbot
3 1 (0.23%) Microsoft Project
3 1 (0.23%) MS Visio
3 1 (0.23%) Trello
Business Applications
1 84 (19.40%) Oracle EBS
2 20 (4.62%) NEC Housing
3 12 (2.77%) Dynamics CRM
4 1 (0.23%) Magento
4 1 (0.23%) ReMetrica
Cloud Services
1 154 (35.57%) Azure
2 145 (33.49%) AWS
3 48 (11.09%) GCP
4 37 (8.55%) Serverless
5 32 (7.39%) Azure DevOps
6 31 (7.16%) SaaS
7 29 (6.70%) AWS CloudFormation
8 14 (3.23%) Cloud Computing
8 14 (3.23%) Datadog
9 13 (3.00%) Dynamics 365
10 12 (2.77%) AWS CodeStar
10 12 (2.77%) OCI
11 10 (2.31%) Amazon CloudWatch
12 8 (1.85%) AWS Lambda
12 8 (1.85%) Power Platform
13 7 (1.62%) PowerApps
14 6 (1.39%) Microsoft 365
15 5 (1.15%) Amazon ECS
15 5 (1.15%) Amazon EKS
15 5 (1.15%) Amazon S3
Communications & Networking
1 8 (1.85%) Broadband
2 7 (1.62%) MQTT
3 3 (0.69%) Network Security
4 2 (0.46%) HTTP
4 2 (0.46%) Internet
4 2 (0.46%) VPN
5 1 (0.23%) DNS
5 1 (0.23%) Firewall
Database & Business Intelligence
1 123 (28.41%) Data Warehouse
2 86 (19.86%) Relational Database
3 85 (19.63%) RDBMS
4 84 (19.40%) Enterprise Data Warehouse
5 12 (2.77%) Elasticsearch
6 11 (2.54%) PostgreSQL
7 10 (2.31%) MySQL
8 9 (2.08%) NoSQL
8 9 (2.08%) SQL Server
9 8 (1.85%) Hadoop
10 7 (1.62%) DocumentDB
11 6 (1.39%) DB2
11 6 (1.39%) MongoDB
12 4 (0.92%) Amazon RDS
12 4 (0.92%) Power BI
12 4 (0.92%) SQL Server Integration Services
13 2 (0.46%) Big Data
13 2 (0.46%) Data Lake
14 1 (0.23%) Amazon Redshift
14 1 (0.23%) DynamoDB
Development Applications
1 35 (8.08%) JIRA
2 26 (6.00%) Git
3 25 (5.77%) Jenkins
4 15 (3.46%) GitLab
5 12 (2.77%) SonarQube
5 12 (2.77%) Terragrunt
6 10 (2.31%) Bitbucket
7 6 (1.39%) Cypress.io
8 5 (1.15%) Cucumber
8 5 (1.15%) Maven
9 4 (0.92%) Appium
9 4 (0.92%) Visual Studio Code
10 2 (0.46%) CMake
10 2 (0.46%) Postman
10 2 (0.46%) Protractor
11 1 (0.23%) CircleCI
11 1 (0.23%) Hudson
11 1 (0.23%) JUnit
11 1 (0.23%) Team Foundation Server
11 1 (0.23%) Visual Studio
General
1 191 (44.11%) Social Skills
2 154 (35.57%) Finance
3 124 (28.64%) Inclusion and Diversity
4 109 (25.17%) Analytical Skills
5 86 (19.86%) Influencing Skills
5 86 (19.86%) Organisational Skills
6 84 (19.40%) Military
7 29 (6.70%) Public Sector
8 26 (6.00%) Banking
9 25 (5.77%) Marketing
10 21 (4.85%) Retail Banking
11 20 (4.62%) Local Government
11 20 (4.62%) Police
12 19 (4.39%) Legal
13 17 (3.93%) Law
14 14 (3.23%) Telecoms
15 7 (1.62%) Aerospace
16 6 (1.39%) Games
16 6 (1.39%) Retail
17 5 (1.15%) Manufacturing
Job Titles
1 140 (32.33%) Senior
2 110 (25.40%) DevOps Engineer
3 65 (15.01%) Architect
4 62 (14.32%) Senior DevOps
4 62 (14.32%) Senior DevOps Engineer
5 57 (13.16%) Solutions Architect
6 45 (10.39%) Software Engineer
7 36 (8.31%) Presales Solution Architect
8 25 (5.77%) Lead
9 22 (5.08%) Database Engineer
9 22 (5.08%) Senior Database Engineer
10 21 (4.85%) Senior Architect
10 21 (4.85%) Senior Solutions Architect
11 20 (4.62%) Developer
12 19 (4.39%) Analyst
13 17 (3.93%) Product Manager
13 17 (3.93%) Project Manager
14 16 (3.70%) Delivery Manager
15 15 (3.46%) Bid Writer
15 15 (3.46%) Senior Bid Writer
Libraries, Frameworks & Software Standards
1 31 (7.16%) React
2 29 (6.70%) .NET
3 18 (4.16%) AngularJS
4 17 (3.93%) Kafka
4 17 (3.93%) Node.js
5 15 (3.46%) Spring
6 14 (3.23%) ASP.NET
7 12 (2.77%) ARM Templates
8 11 (2.54%) AWS CDK
8 11 (2.54%) RESTful
9 10 (2.31%) REST
9 10 (2.31%) Spring Boot
10 9 (2.08%) Apache Cordova
10 9 (2.08%) Middleware
10 9 (2.08%) Vue
11 8 (1.85%) Elastic Stack
12 7 (1.62%) HTML
12 7 (1.62%) XML
13 5 (1.15%) JSON
13 5 (1.15%) Web Services
Miscellaneous
1 90 (20.79%) Self-Motivation
2 68 (15.70%) Cloud Native
3 24 (5.54%) Product Ownership
4 17 (3.93%) Management Information System
5 12 (2.77%) Mobile App
6 11 (2.54%) Enterprise Software
7 8 (1.85%) Onboarding
7 8 (1.85%) Over-the-Top Content
8 7 (1.62%) Greenfield Project
9 6 (1.39%) Online Banking
9 6 (1.39%) Security Posture
10 5 (1.15%) Data Structures
11 4 (0.92%) Cloud Security Posture
11 4 (0.92%) IoT
11 4 (0.92%) Replication
11 4 (0.92%) Video\Live Streaming
12 3 (0.69%) Algorithms
12 3 (0.69%) NHS
13 2 (0.46%) FMCG
13 2 (0.46%) Mobile Games
Operating Systems
1 18 (4.16%) Linux
2 17 (3.93%) Android
3 16 (3.70%) Windows
4 15 (3.46%) Apple iOS
5 5 (1.15%) Windows Server
6 3 (0.69%) Unix
7 2 (0.46%) VMS
8 1 (0.23%) Debian
8 1 (0.23%) Fedora
8 1 (0.23%) Ubuntu
8 1 (0.23%) Windows Server 2019
Processes & Methodologies
1 286 (66.05%) Agile
2 179 (41.34%) DevOps
3 173 (39.95%) Software Engineering
4 144 (33.26%) Problem-Solving
5 133 (30.72%) Mentoring
6 124 (28.64%) Customer Experience
7 103 (23.79%) Analytics
8 94 (21.71%) ITIL
9 93 (21.48%) Integration Testing
9 93 (21.48%) Scrum
10 92 (21.25%) CI/CD
10 92 (21.25%) Design Patterns
10 92 (21.25%) User Stories
11 89 (20.55%) Data Integration
11 89 (20.55%) ERP
12 88 (20.32%) Data Modelling
13 87 (20.09%) Prototyping
14 85 (19.63%) Service Management
15 84 (19.40%) User Research
16 61 (14.09%) Continuous Improvement
Programming Languages
1 68 (15.70%) Python
2 54 (12.47%) JavaScript
3 38 (8.78%) C#
4 37 (8.55%) Java
5 35 (8.08%) SQL
6 28 (6.47%) PowerShell
7 27 (6.24%) Bash
8 23 (5.31%) TypeScript
9 10 (2.31%) C++
10 7 (1.62%) C
11 6 (1.39%) Kotlin
11 6 (1.39%) PHP
12 4 (0.92%) Apex Code
12 4 (0.92%) SOQL
12 4 (0.92%) Swift
13 3 (0.69%) Ruby
13 3 (0.69%) VB
14 2 (0.46%) Rust
15 1 (0.23%) Data Analysis Expressions
15 1 (0.23%) VBA
Qualifications
1 104 (24.02%) DBS Check
2 47 (10.85%) Degree
3 40 (9.24%) Security Cleared
4 36 (8.31%) TOGAF Certification
5 29 (6.70%) SC Cleared
6 25 (5.77%) Computer Science Degree
7 24 (5.54%) Azure Certification
8 16 (3.70%) AWS Certification
9 11 (2.54%) Master's Degree
10 10 (2.31%) DV Cleared
11 8 (1.85%) PMI Certification
11 8 (1.85%) PMP
12 5 (1.15%) Microsoft Certification
13 3 (0.69%) AWS Certified DevOps Engineer
14 2 (0.46%) ISEB
14 2 (0.46%) ISTQB
14 2 (0.46%) ISTQB Foundation Certification
15 1 (0.23%) AWS Certified Solutions Architect
15 1 (0.23%) PRINCE2 Certification
Quality Assurance & Compliance
1 47 (10.85%) QA
2 23 (5.31%) Accessibility
3 6 (1.39%) Data Quality
4 4 (0.92%) ISO/IEC 27001
5 2 (0.46%) Cyber Essentials
5 2 (0.46%) Cyber Essentials PLUS
5 2 (0.46%) GDPR
6 1 (0.23%) GRC
6 1 (0.23%) ISO 9001
System Software
1 58 (13.39%) Docker
2 7 (1.62%) Active Directory
3 5 (1.15%) Firmware
3 5 (1.15%) Virtual Machines
3 5 (1.15%) VMware Infrastructure
4 4 (0.92%) Hyper-V
5 1 (0.23%) Embedded Firmware
5 1 (0.23%) Microsoft App-V
5 1 (0.23%) VMware ESXi
Systems Management
1 54 (12.47%) Kubernetes
2 49 (11.32%) Terraform
3 31 (7.16%) Ansible
4 19 (4.39%) Grafana
5 14 (3.23%) Prometheus
6 7 (1.62%) Puppet
7 5 (1.15%) Kibana
8 4 (0.92%) Nagios
9 2 (0.46%) Progress Chef
9 2 (0.46%) SCCM
10 1 (0.23%) Fluentd
10 1 (0.23%) Jamf Pro
10 1 (0.23%) Rundeck
Vendors
1 87 (20.09%) Oracle
2 59 (13.63%) Microsoft
3 20 (4.62%) NEC
4 13 (3.00%) ServiceNow
5 12 (2.77%) Black Duck
5 12 (2.77%) Splunk
6 7 (1.62%) Atlassian
6 7 (1.62%) Google
7 6 (1.39%) VMware
8 5 (1.15%) Databricks
8 5 (1.15%) Salesforce
9 4 (0.92%) IBM
9 4 (0.92%) New Relic
9 4 (0.92%) Remedy
10 3 (0.69%) Apple
10 3 (0.69%) TOWER Software
10 3 (0.69%) Xamarin
10 3 (0.69%) YouTube
11 1 (0.23%) Guidewire
11 1 (0.23%) SAP