Site Reliability Engineer Jobs

Site Reliability Engineer (SRE)
UK

The median Site Reliability Engineer (SRE) salary in the UK is £75,000 per year according to job vacancies posted during the 6 months to 1 December 2023.

The first table below provides salary benchmarking and summary statistics including a comparison to same period in the previous 2 years.

6 months to
1 Dec 2023
Same period 2022 Same period 2021
Rank 589 625 574
Rank change year-on-year +36 -51 -83
Permanent jobs requiring a Site Reliability Engineer 155 520 610
As % of all permanent jobs advertised in the UK 0.29% 0.42% 0.47%
As % of the Job Titles category 0.30% 0.44% 0.50%
Number of salaries quoted 134 419 486
10th Percentile £56,625 £47,823 £57,500
25th Percentile £62,500 £60,357 £65,000
Median annual salary (50th Percentile) £75,000 £80,000 £82,500
Median % change year-on-year -6.25% -3.03% +26.92%
75th Percentile £112,500 £97,500 £105,000
90th Percentile £138,750 £107,500 £122,500
UK excluding London median annual salary £65,000 £66,786 £67,500
% change year-on-year -2.67% -1.06% +12.50%

All Permanent IT Job Vacancies
UK

The following table is for comparison with the above and includes summary statistics for all permanent IT job vacancies. Most job vacancies include a discernible job title that can be normalized. As such, the figures in the second row provide an indication of the number of permanent jobs in our overall sample.

Permanent vacancies in the UK with a recognized job title 51,239 119,424 123,130
% of permanent jobs with a recognized job title 95.44% 95.33% 95.10%
Number of salaries quoted 37,551 74,907 84,473
10th Percentile £31,250 £32,750 £32,000
25th Percentile £42,500 £45,000 £42,500
Median annual salary (50th Percentile) £60,000 £60,000 £57,500
Median % change year-on-year - +4.35% +4.55%
75th Percentile £80,000 £81,250 £77,500
90th Percentile £97,500 £98,750 £95,000
UK excluding London median annual salary £52,500 £52,500 £50,000
% change year-on-year - +5.00% +5.26%

Site Reliability Engineer
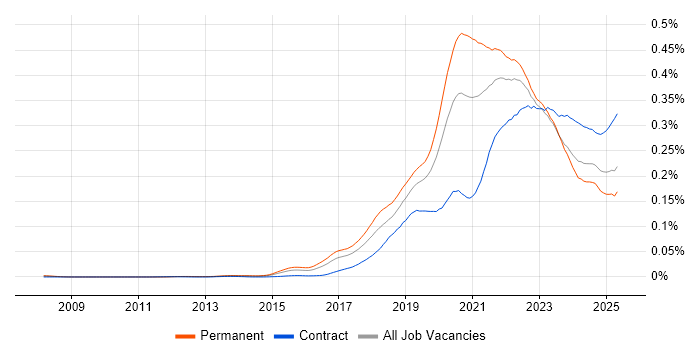
Job Vacancy Trend

Job postings that featured Site Reliability Engineer in the job title as a proportion of all IT jobs advertised.

Job vacancy trend for Site Reliability Engineer in the UK

Site Reliability Engineer
Salary Trend

3-month moving average salary quoted in jobs citing Site Reliability Engineer.

Salary trend for Site Reliability Engineer in the UK

Site Reliability Engineer
Salary Histogram

Salary distribution for jobs citing Site Reliability Engineer over the 6 months to 1 December 2023.

Salary histogram for Site Reliability Engineer in the UK

Site Reliability Engineer
Top 13 Job Locations

The table below looks at the demand and provides a guide to the median salaries quoted in IT jobs citing Site Reliability Engineer within the UK over the 6 months to 1 December 2023. The 'Rank Change' column provides an indication of the change in demand within each location based on the same 6 month period last year.

Location Rank Change
on Same Period
Last Year
Matching
Permanent
IT Job Ads
Median Salary
Past 6 Months
Median Salary
% Change
on Same Period
Last Year
Live
Jobs
England +33 140 £80,000 - 65
London +103 98 £100,000 +17.65% 35
Work from Home +31 56 £65,351 -12.39% 38
UK excluding London +118 49 £65,000 -2.67% 44
North of England +78 26 £63,750 -4.55% 7
North West +86 13 £57,500 -22.91% 4
Yorkshire +61 11 £65,000 +0.48% 3
Scotland +13 7 £65,351 -2.15% 9
South West +60 6 £65,175 +4.28% 14
South East +132 5 £65,000 -21.21% 12
Wales +13 3 £75,000 +20.00%
East of England +117 2 £65,000 -27.78% 2
North East +46 2 £63,750 +27.50%

Site Reliability Engineer Skill Set
Top 30 Co-occurring Skills and Capabilities

For the 6 months to 1 December 2023, Site Reliability Engineer job roles required the following skills and capabilities in order of popularity. The figures indicate the absolute number co-occurrences and as a proportion of all permanent job ads featuring Site Reliability Engineer in the job title.

1 155 (100.00%) Site Reliability Engineering
2 108 (69.68%) Kubernetes
3 102 (65.81%) AWS
4 89 (57.42%) DevOps
5 85 (54.84%) CI/CD
6 79 (50.97%) Azure
7 78 (50.32%) Terraform
8 67 (43.23%) Finance
8 67 (43.23%) Agile
9 64 (41.29%) Java
9 64 (41.29%) Python
9 64 (41.29%) Docker
10 58 (37.42%) GCP
11 52 (33.55%) Jenkins
12 44 (28.39%) AWS CloudFormation
12 44 (28.39%) Software Engineering
13 43 (27.74%) Linux
14 42 (27.10%) Banking
15 40 (25.81%) Go
16 35 (22.58%) Infrastructure as Code
17 34 (21.94%) Bash
18 33 (21.29%) OpenShift
19 32 (20.65%) PowerShell
20 30 (19.35%) GitLab
21 29 (18.71%) Observability
22 28 (18.06%) Front Office
23 27 (17.42%) Problem-Solving
24 25 (16.13%) Ansible
24 25 (16.13%) GitHub
25 24 (15.48%) Amazon ECS

Site Reliability Engineer Skill Set
Co-occurring Skills and Capabilities by Category

The follow tables expand on the table above by listing co-occurrences grouped by category. The same employment type, locality and period is covered with up to 20 co-occurrences shown in each of the following categories:

Application Platforms
1 3 (1.94%) nginx
1 3 (1.94%) OpenStack
2 2 (1.29%) Cloud Foundry
2 2 (1.29%) Confluence
3 1 (0.65%) Apache
3 1 (0.65%) IIS
3 1 (0.65%) MS Exchange
3 1 (0.65%) WebSphere
Applications
1 1 (0.65%) AutoCAD
1 1 (0.65%) PTC Creo
1 1 (0.65%) SOLIDWORKS
Cloud Services
1 102 (65.81%) AWS
2 79 (50.97%) Azure
3 58 (37.42%) GCP
4 44 (28.39%) AWS CloudFormation
5 33 (21.29%) OpenShift
6 25 (16.13%) GitHub
7 24 (15.48%) Amazon ECS
8 23 (14.84%) GitHub Actions
9 22 (14.19%) Serverless
10 16 (10.32%) Amazon EC2
10 16 (10.32%) AWS Lambda
11 14 (9.03%) Azure DevOps
12 13 (8.39%) Cloud Computing
13 12 (7.74%) Amazon S3
13 12 (7.74%) AWS CodePipeline
13 12 (7.74%) PaaS
14 10 (6.45%) Amazon SQS
14 10 (6.45%) Azure ExpressRoute
14 10 (6.45%) Azure Sentinel
14 10 (6.45%) dbt
Communications & Networking
1 12 (7.74%) TCP/IP
2 11 (7.10%) Network Security
3 7 (4.52%) Firewall
4 4 (2.58%) DNS
4 4 (2.58%) VPN
5 3 (1.94%) SSL
6 2 (1.29%) BGP
6 2 (1.29%) Reverse Proxy
7 1 (0.65%) AMQP
7 1 (0.65%) Fibre Channel
7 1 (0.65%) iSCSI
7 1 (0.65%) Multicast
7 1 (0.65%) NAS
7 1 (0.65%) SAN
7 1 (0.65%) VLAN
Database & Business Intelligence
1 17 (10.97%) Elasticsearch
2 13 (8.39%) PostgreSQL
3 11 (7.10%) Amazon RDS
3 11 (7.10%) Redis
4 10 (6.45%) Amazon Redshift
5 8 (5.16%) SQL Server
6 5 (3.23%) MySQL
7 3 (1.94%) InfluxDB
7 3 (1.94%) OpenStack Swift
8 2 (1.29%) NoSQL
8 2 (1.29%) Relational Database
9 1 (0.65%) Data Lake
9 1 (0.65%) DynamoDB
9 1 (0.65%) MongoDB
9 1 (0.65%) SAP HANA
Development Applications
1 52 (33.55%) Jenkins
2 30 (19.35%) GitLab
3 10 (6.45%) Artifactory
4 7 (4.52%) Git
5 4 (2.58%) JIRA
5 4 (2.58%) Octopus Deploy
5 4 (2.58%) TeamCity
6 3 (1.94%) Gradle
6 3 (1.94%) Maven
7 2 (1.29%) Bitbucket
8 1 (0.65%) Chocolatey
8 1 (0.65%) Jaeger
8 1 (0.65%) SonarQube
General
1 67 (43.23%) Finance
2 42 (27.10%) Banking
3 28 (18.06%) Front Office
4 19 (12.26%) Investment Banking
5 16 (10.32%) Inclusion and Diversity
6 11 (7.10%) Retail
7 10 (6.45%) Social Skills
8 3 (1.94%) Public Sector
9 2 (1.29%) Advertising
9 2 (1.29%) Analytical Skills
9 2 (1.29%) Documentation Skills
9 2 (1.29%) iGaming
9 2 (1.29%) Marketing
9 2 (1.29%) Public Speaking
9 2 (1.29%) Tech for Good
10 1 (0.65%) Automotive
10 1 (0.65%) Aviation
10 1 (0.65%) Financial Institution
10 1 (0.65%) Law
10 1 (0.65%) Publishing
Libraries, Frameworks & Software Standards
1 14 (9.03%) Elastic Stack
2 11 (7.10%) ARM Templates
2 11 (7.10%) Kafka
3 10 (6.45%) Azure Blueprints
3 10 (6.45%) Django
3 10 (6.45%) J2EE
4 8 (5.16%) OAuth
4 8 (5.16%) OAuth2
4 8 (5.16%) SAML
5 7 (4.52%) Node.js
6 4 (2.58%) FIX Protocol
7 3 (1.94%) NestJS
7 3 (1.94%) RabbitMQ
7 3 (1.94%) Ruby on Rails
7 3 (1.94%) Velocity
8 2 (1.29%) .NET
8 2 (1.29%) .NET Core
8 2 (1.29%) React
8 2 (1.29%) Spring
8 2 (1.29%) Spring Boot
Miscellaneous
1 23 (14.84%) Public Cloud
2 15 (9.68%) Distributed Systems
3 10 (6.45%) Self-Motivation
3 10 (6.45%) Tandem
4 8 (5.16%) Virtual Team
5 7 (4.52%) Data Centre
5 7 (4.52%) Management Information System
6 6 (3.87%) Cloud Native
6 6 (3.87%) CMDB
7 5 (3.23%) Enterprise Storage
7 5 (3.23%) Onboarding
8 4 (2.58%) Data Protection Act
8 4 (2.58%) Enterprise Software
8 4 (2.58%) Product Ownership
9 3 (1.94%) DataPower
9 3 (1.94%) Wiki
10 2 (1.29%) Blog
10 2 (1.29%) Linux Command Line
10 2 (1.29%) Private Cloud
11 1 (0.65%) Greenfield Project
Operating Systems
1 43 (27.74%) Linux
2 17 (10.97%) Windows
3 16 (10.32%) Unix
4 11 (7.10%) Red Hat Enterprise Linux
5 6 (3.87%) Ubuntu
6 1 (0.65%) Windows Server
6 1 (0.65%) Windows Server 2012
Processes & Methodologies
1 155 (100.00%) Site Reliability Engineering
2 89 (57.42%) DevOps
3 85 (54.84%) CI/CD
4 67 (43.23%) Agile
5 44 (28.39%) Software Engineering
6 35 (22.58%) Infrastructure as Code
7 29 (18.71%) Observability
8 27 (17.42%) Problem-Solving
9 24 (15.48%) Containerisation
9 24 (15.48%) Platform Engineering
10 23 (14.84%) Migration
11 21 (13.55%) Configuration Management
11 21 (13.55%) Release Automation
12 20 (12.90%) Open Source
13 19 (12.26%) Mentoring
14 18 (11.61%) Infrastructure Automation
15 16 (10.32%) Cloud Security
16 15 (9.68%) Continuous Integration
16 15 (9.68%) Service-Level Objective
17 14 (9.03%) Capacity Planning
Programming Languages
1 64 (41.29%) Java
1 64 (41.29%) Python
2 40 (25.81%) Go
3 34 (21.94%) Bash
4 32 (20.65%) PowerShell
5 15 (9.68%) Bicep
6 10 (6.45%) Ruby
7 8 (5.16%) SQL
8 6 (3.87%) Groovy
8 6 (3.87%) Kotlin
9 5 (3.23%) C#
9 5 (3.23%) Perl
9 5 (3.23%) Shell Script
10 4 (2.58%) Clojure
10 4 (2.58%) JavaScript
11 3 (1.94%) C++
11 3 (1.94%) TypeScript
12 1 (0.65%) MATLAB
12 1 (0.65%) PHP
12 1 (0.65%) Rust
Qualifications
1 16 (10.32%) Security Cleared
2 13 (8.39%) SC Cleared
3 4 (2.58%) Degree
4 2 (1.29%) AWS Certification
4 2 (1.29%) Azure Certification
5 1 (0.65%) AWS Certified Solutions Architect
5 1 (0.65%) DV Cleared
5 1 (0.65%) MCSA
5 1 (0.65%) MCSE
5 1 (0.65%) Microsoft Certification
Quality Assurance & Compliance
1 2 (1.29%) ISO/IEC 27001
1 2 (1.29%) SLA
2 1 (0.65%) ISO 22301
2 1 (0.65%) ISO 9001
2 1 (0.65%) QA
System Software
1 64 (41.29%) Docker
2 16 (10.32%) Virtual Machines
3 5 (3.23%) Varnish
3 5 (3.23%) VMware Infrastructure
4 1 (0.65%) Active Directory
4 1 (0.65%) NFS
Systems Management
1 108 (69.68%) Kubernetes
2 78 (50.32%) Terraform
3 25 (16.13%) Ansible
4 19 (12.26%) Argo
5 18 (11.61%) Rancher
6 17 (10.97%) Prometheus
6 17 (10.97%) Puppet
7 14 (9.03%) Grafana
8 6 (3.87%) Progress Chef
9 5 (3.23%) ZABBIX
10 4 (2.58%) Istio
10 4 (2.58%) Nagios
11 3 (1.94%) Icinga
12 1 (0.65%) Active Directory Federation Services
12 1 (0.65%) Docker Swarm
12 1 (0.65%) HP Fortify
12 1 (0.65%) Salt
12 1 (0.65%) SCCM
12 1 (0.65%) SCOM
12 1 (0.65%) Zipkin
Vendors
1 20 (12.90%) Google
2 16 (10.32%) Microsoft
3 6 (3.87%) Splunk
4 5 (3.23%) EMC
4 5 (3.23%) VMware
5 3 (1.94%) Apple
5 3 (1.94%) Cadence
5 3 (1.94%) Cisco
5 3 (1.94%) Juniper
5 3 (1.94%) Oracle
5 3 (1.94%) Salesforce
6 2 (1.29%) Dynatrace
6 2 (1.29%) Red Hat
6 2 (1.29%) SolarWinds
7 1 (0.65%) IBM
7 1 (0.65%) MathWorks
7 1 (0.65%) PagerDuty
7 1 (0.65%) PTC
7 1 (0.65%) SaltStack
7 1 (0.65%) SAP