Incident Response
UK

The following table provides summary statistics for permanent job vacancies with a requirement for Incident Response skills. Included is a benchmarking guide to the salaries offered in vacancies that have cited Incident Response over the 6 months to 28 November 2023 with a comparison to the same period in the previous 2 years.

6 months to
28 Nov 2023
Same period 2022 Same period 2021
Rank 298 460 422
Rank change year-on-year +162 -38 -91
Permanent jobs citing Incident Response 566 871 995
As % of all permanent jobs advertised in the UK 1.04% 0.69% 0.77%
As % of the Processes & Methodologies category 1.11% 0.73% 0.81%
Number of salaries quoted 437 629 711
10th Percentile £42,500 £40,973 £41,000
25th Percentile £51,250 £50,000 £48,000
Median annual salary (50th Percentile) £62,500 £65,000 £62,000
Median % change year-on-year -3.85% +4.84% -0.80%
75th Percentile £73,750 £82,500 £80,000
90th Percentile £87,050 £97,500 £91,250
UK excluding London median annual salary £60,000 £60,000 £55,000
% change year-on-year - +9.09% -

All Process and Methodology Skills
UK

Incident Response is in the Processes and Methodologies category. The following table is for comparison with the above and provides summary statistics for all permanent job vacancies with a requirement for process or methodology skills.

Permanent vacancies with a requirement for process or methodology skills 51,121 120,104 122,523
As % of all permanent jobs advertised in the UK 94.09% 95.72% 95.43%
Number of salaries quoted 36,956 73,203 81,032
10th Percentile £32,500 £34,313 £32,500
25th Percentile £43,750 £45,000 £42,500
Median annual salary (50th Percentile) £60,000 £60,000 £59,000
Median % change year-on-year - +1.69% +7.27%
75th Percentile £80,000 £81,250 £77,500
90th Percentile £98,750 £100,000 £95,000
UK excluding London median annual salary £52,500 £53,000 £50,000
% change year-on-year -0.94% +6.00% +4.17%

Incident Response
Job Vacancy Trend

Job postings citing Incident Response as a proportion of all IT jobs advertised.
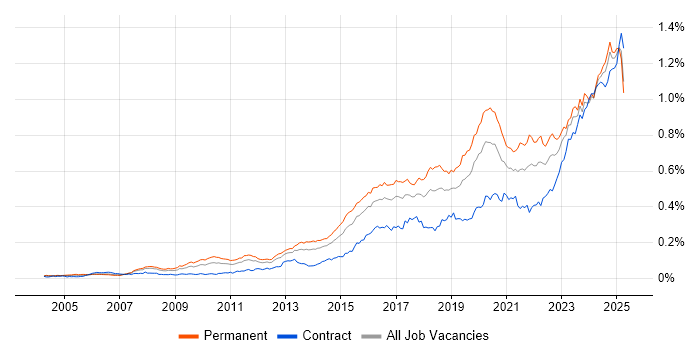
Job vacancy trend for Incident Response in the UK

Incident Response
Salary Trend

3-month moving average salary quoted in jobs citing Incident Response.

Salary trend for Incident Response in the UK

Incident Response
Salary Histogram

Salary distribution for jobs citing Incident Response over the 6 months to 28 November 2023.

Salary histogram for Incident Response in the UK

Incident Response
Top 17 Job Locations

The table below looks at the demand and provides a guide to the median salaries quoted in IT jobs citing Incident Response within the UK over the 6 months to 28 November 2023. The 'Rank Change' column provides an indication of the change in demand within each location based on the same 6 month period last year.

Location Rank Change
on Same Period
Last Year
Matching
Permanent
IT Job Ads
Median Salary
Past 6 Months
Median Salary
% Change
on Same Period
Last Year
Live
Jobs
England +183 516 £62,500 -5.20% 274
UK excluding London +166 337 £60,000 - 154
Work from Home +184 292 £62,500 -7.41% 139
London +117 199 £70,000 -6.67% 133
North of England +122 108 £60,000 -7.69% 33
South East +155 92 £60,500 +0.83% 49
Midlands +127 56 £55,000 -8.33% 23
Yorkshire +118 52 £62,500 +2.04% 16
North West +86 50 £57,500 -11.54% 15
West Midlands +114 37 £55,000 -6.38% 15
South West +65 27 £57,500 +9.52% 19
East of England +104 22 £72,500 +18.37% 12
Scotland +7 18 £52,500 -19.23% 17
East Midlands +46 16 £57,500 -19.74% 8
Northern Ireland +43 12 £63,625 +59.06% 2
North East +33 6 £40,000 -3.65% 2
Wales -1 6 £52,500 -6.10%

Incident Response
Co-occurring Skills and Capabilities by Category

The follow tables expand on the table above by listing co-occurrences grouped by category. The same employment type, locality and period is covered with up to 20 co-occurrences shown in each of the following categories:

Application Platforms
1 14 (2.47%) SharePoint
2 4 (0.71%) Confluence
3 3 (0.53%) IIS
3 3 (0.53%) MS Exchange
4 1 (0.18%) Apache
4 1 (0.18%) JBoss
4 1 (0.18%) nginx
4 1 (0.18%) Tomcat
Applications
1 30 (5.30%) Microsoft Office
2 18 (3.18%) Microsoft Excel
2 18 (3.18%) Microsoft PowerPoint
3 4 (0.71%) MS Visio
4 3 (0.53%) Microsoft Project
Business Applications
1 1 (0.18%) Payment Gateway
Cloud Services
1 137 (24.20%) Azure
2 81 (14.31%) AWS
3 72 (12.72%) Microsoft 365
4 30 (5.30%) SaaS
5 28 (4.95%) GCP
6 21 (3.71%) IaaS
7 18 (3.18%) Cloud Computing
8 16 (2.83%) Azure Sentinel
9 14 (2.47%) Entra ID
10 12 (2.12%) GitHub
11 9 (1.59%) Amazon CloudWatch
11 9 (1.59%) AWS Data Pipeline
11 9 (1.59%) Datadog
12 6 (1.06%) Azure DevOps
12 6 (1.06%) PaaS
13 4 (0.71%) Azure ExpressRoute
13 4 (0.71%) WhatsApp
14 3 (0.53%) Azure Key Vault
14 3 (0.53%) Serverless
15 2 (0.35%) GitHub Actions
Communications & Networking
1 174 (30.74%) Firewall
2 96 (16.96%) Network Security
3 63 (11.13%) Intrusion Detection
4 27 (4.77%) VPN
5 23 (4.06%) Internet
6 16 (2.83%) TCP/IP
7 15 (2.65%) WAN
8 13 (2.30%) Cisco ASA
8 13 (2.30%) LAN
9 12 (2.12%) Cisco Firepower
9 12 (2.12%) DNS
10 11 (1.94%) Wireless
11 9 (1.59%) SAN
12 7 (1.24%) VoIP
13 6 (1.06%) HTTP
13 6 (1.06%) NGFW
13 6 (1.06%) Remote Desktop
14 5 (0.88%) BGP
14 5 (0.88%) Wi-Fi
15 4 (0.71%) MPLS
Database & Business Intelligence
1 30 (5.30%) MySQL
2 29 (5.12%) RDBMS
2 29 (5.12%) Relational Database
3 15 (2.65%) SQL Server
4 9 (1.59%) DynamoDB
4 9 (1.59%) Metadata
5 6 (1.06%) Amazon RDS
5 6 (1.06%) Big Data
6 5 (0.88%) GIS
7 2 (0.35%) Oracle Database
7 2 (0.35%) PostgreSQL
8 1 (0.18%) Amazon Redshift
8 1 (0.18%) Geospatial Data
8 1 (0.18%) NoSQL
Development Applications
1 14 (2.47%) JIRA
2 7 (1.24%) Jenkins
3 6 (1.06%) Git
4 4 (0.71%) Burp Suite
5 2 (0.35%) Metasploit
5 2 (0.35%) SoapUI
6 1 (0.18%) Bitbucket
6 1 (0.18%) CircleCI
6 1 (0.18%) GitLab
6 1 (0.18%) TeamCity
General
1 171 (30.21%) Social Skills
2 78 (13.78%) Finance
3 58 (10.25%) Analytical Skills
4 46 (8.13%) Legal
5 36 (6.36%) Law
5 36 (6.36%) Public Sector
6 17 (3.00%) Banking
7 15 (2.65%) Influencing Skills
7 15 (2.65%) Telecoms
8 13 (2.30%) Organisational Skills
9 12 (2.12%) Inclusion and Diversity
9 12 (2.12%) Retail
10 10 (1.77%) Marketing
11 8 (1.41%) Pharmaceutical
12 6 (1.06%) Advertising
12 6 (1.06%) Military
12 6 (1.06%) Presentation Skills
13 4 (0.71%) Back Office
13 4 (0.71%) Health Technology
13 4 (0.71%) Manufacturing
Job Titles
1 177 (31.27%) Analyst
2 112 (19.79%) Security Analyst
3 97 (17.14%) Senior
4 94 (16.61%) Security Engineer
5 65 (11.48%) Lead
6 59 (10.42%) SOC Analyst
7 47 (8.30%) Security Manager
8 45 (7.95%) Cybersecurity Analyst
9 40 (7.07%) IT Engineer
9 40 (7.07%) Senior Analyst
10 36 (6.36%) Cybersecurity Engineer
11 33 (5.83%) Senior Security Analyst
12 31 (5.48%) DBA
13 30 (5.30%) MySQL DBA
13 30 (5.30%) Senior Security Engineer
14 29 (5.12%) Information Analyst
14 29 (5.12%) Information Security Analyst
15 26 (4.59%) Network Engineer
16 25 (4.42%) IT Security Engineer
17 23 (4.06%) IT Manager
Libraries, Frameworks & Software Standards
1 10 (1.77%) JSON
2 9 (1.59%) Node.js
3 4 (0.71%) Middleware
3 4 (0.71%) Web Services
3 4 (0.71%) YAML
4 2 (0.35%) .NET
4 2 (0.35%) CSS
4 2 (0.35%) ModSecurity
4 2 (0.35%) React
4 2 (0.35%) Regular Expression
4 2 (0.35%) REST
4 2 (0.35%) SOAP
4 2 (0.35%) Vue
4 2 (0.35%) web3js
5 1 (0.18%) AngularJS
5 1 (0.18%) ARM Templates
5 1 (0.18%) Kafka
5 1 (0.18%) OAuth2
5 1 (0.18%) OpenID
5 1 (0.18%) Play Framework
Miscellaneous
1 95 (16.78%) Management Information System
2 64 (11.31%) Security Operations Centre
3 52 (9.19%) Security Posture
4 48 (8.48%) Cyber Threat
5 32 (5.65%) Cyberattack
6 31 (5.48%) Operational Technology
7 23 (4.06%) Cyber Kill Chain
8 17 (3.00%) Driving Licence
9 12 (2.12%) Cyber Defence
10 11 (1.94%) Insider Threat
11 10 (1.77%) Clustering
11 10 (1.77%) PKI
11 10 (1.77%) Tandem
12 9 (1.59%) Cybercrime
12 9 (1.59%) Data Structures
12 9 (1.59%) Virtual Team
13 8 (1.41%) Data Centre
13 8 (1.41%) Data Protection Act
14 7 (1.24%) Distributed Denial-of-Service
14 7 (1.24%) Mobile App
Operating Systems
1 125 (22.08%) Windows
2 99 (17.49%) Linux
3 49 (8.66%) Unix
4 27 (4.77%) Windows Server
5 11 (1.94%) Windows Server 2012
6 9 (1.59%) Ubuntu
7 7 (1.24%) Windows Server 2016
8 6 (1.06%) Windows Server 2019
9 4 (0.71%) Mac OS X
10 3 (0.53%) Kali Linux
10 3 (0.53%) Mac OS
11 1 (0.18%) Amazon Linux
11 1 (0.18%) Android
11 1 (0.18%) Apple iOS
11 1 (0.18%) Data ONTAP
Processes & Methodologies
1 344 (60.78%) Cybersecurity
2 246 (43.46%) Information Security
3 206 (36.40%) Security Operations
4 178 (31.45%) SIEM
5 121 (21.38%) Vulnerability Management
6 105 (18.55%) Cloud Security
7 95 (16.78%) Threat Intelligence
8 87 (15.37%) Cyber Threat Intelligence
9 80 (14.13%) Problem-Solving
10 70 (12.37%) Incident Management
10 70 (12.37%) Risk Management
11 66 (11.66%) Penetration Testing
12 65 (11.48%) Vulnerability Assessment
13 63 (11.13%) Security Monitoring
14 57 (10.07%) Security Management
15 54 (9.54%) ITIL
16 49 (8.66%) Data Protection
17 48 (8.48%) MITRE ATT&CK
17 48 (8.48%) Roadmaps
18 47 (8.30%) Disaster Recovery
Programming Languages
1 53 (9.36%) Python
2 36 (6.36%) PowerShell
3 33 (5.83%) Bash
4 20 (3.53%) Java
5 12 (2.12%) Go
6 11 (1.94%) Kusto Query Language
7 10 (1.77%) TypeScript
8 9 (1.59%) C#
8 9 (1.59%) Search Processing Language
8 9 (1.59%) SQL
9 4 (0.71%) C++
10 3 (0.53%) C
10 3 (0.53%) Perl
11 2 (0.35%) JavaScript
12 1 (0.18%) Bicep
12 1 (0.18%) Kotlin
12 1 (0.18%) PHP
12 1 (0.18%) Ruby
12 1 (0.18%) Rust
12 1 (0.18%) Scala
Qualifications
1 140 (24.73%) Degree
2 133 (23.50%) Security Cleared
3 109 (19.26%) CISSP
4 98 (17.31%) SC Cleared
5 65 (11.48%) CISM
6 45 (7.95%) Cisco Certification
7 30 (5.30%) CEH
8 28 (4.95%) GIAC
9 26 (4.59%) (ISC)2 CCSP
9 26 (4.59%) CompTIA Security+
9 26 (4.59%) Computer Science Degree
10 23 (4.06%) Master's Degree
11 18 (3.18%) CCSP
11 18 (3.18%) CISA
12 16 (2.83%) DV Cleared
13 15 (2.65%) CCNP
14 14 (2.47%) CCNA
15 13 (2.30%) OSCP
15 13 (2.30%) SANS
16 12 (2.12%) CCSE
Quality Assurance & Compliance
1 136 (24.03%) ISO/IEC 27001
2 113 (19.96%) NIST
3 55 (9.72%) Cyber Essentials
4 51 (9.01%) GDPR
5 32 (5.65%) PCI DSS
6 24 (4.24%) GRC
7 22 (3.89%) NCSC
8 18 (3.18%) ISO 9001
9 16 (2.83%) ISO/IEC 17025
10 12 (2.12%) COBIT
11 11 (1.94%) QA
12 10 (1.77%) Cyber Essentials PLUS
13 7 (1.24%) ISO/IEC 27002 (supersedes ISO/IEC 17799)
13 7 (1.24%) PMO
14 6 (1.06%) Accessibility
15 5 (0.88%) RMADS
15 5 (0.88%) SOC 2
16 3 (0.53%) HMG Security Policy Framework
17 2 (0.35%) California Consumer Privacy Act
17 2 (0.35%) NIST 800
System Software
1 42 (7.42%) Active Directory
2 18 (3.18%) Docker
2 18 (3.18%) VMware Infrastructure
3 7 (1.24%) Hyper-V
4 4 (0.71%) VMware ESXi
5 3 (0.53%) Squid
6 1 (0.18%) BitLocker
Systems Management
1 25 (4.42%) Terraform
2 22 (3.89%) CSIRT
3 20 (3.53%) Kubernetes
4 17 (3.00%) EnCase
5 16 (2.83%) Microsoft Intune
6 15 (2.65%) Ansible
7 10 (1.77%) FortiGate
8 9 (1.59%) Grafana
9 7 (1.24%) Single Sign-On
10 6 (1.06%) Active Directory Federation Services
10 6 (1.06%) Microsoft Clustering
10 6 (1.06%) Nessus
11 5 (0.88%) CASB
11 5 (0.88%) Progress Chef
11 5 (0.88%) Puppet
11 5 (0.88%) SCCM
12 3 (0.53%) Computer Emergency Response Teams
12 3 (0.53%) Host Intrusion Detection System
13 2 (0.35%) Nmap
14 1 (0.18%) Oracle RMAN
Vendors
1 120 (21.20%) Microsoft
2 49 (8.66%) VMware
3 41 (7.24%) Cisco
3 41 (7.24%) Splunk
4 21 (3.71%) Palo Alto
5 16 (2.83%) CheckPoint
5 16 (2.83%) Fortinet
6 14 (2.47%) Google
7 11 (1.94%) AppDynamics
7 11 (1.94%) New Relic
7 11 (1.94%) Oracle
8 10 (1.77%) Dynatrace
8 10 (1.77%) ServiceNow
9 9 (1.59%) PagerDuty
10 8 (1.41%) LogRhythm
10 8 (1.41%) Meraki
10 8 (1.41%) Qualys
11 7 (1.24%) CrowdStrike
12 6 (1.06%) Aruba
12 6 (1.06%) Nimble Storage