Root Cause Analysis
UK

The following table provides summary statistics for permanent job vacancies with a requirement for Root Cause Analysis skills. Included is a benchmarking guide to the salaries offered in vacancies that have cited Root Cause Analysis over the 6 months to 28 November 2023 with a comparison to the same period in the previous 2 years.

6 months to
28 Nov 2023
Same period 2022 Same period 2021
Rank 280 332 391
Rank change year-on-year +52 +59 -28
Permanent jobs citing Root Cause Analysis 617 1,375 1,085
As % of all permanent jobs advertised in the UK 1.14% 1.10% 0.85%
As % of the Processes & Methodologies category 1.21% 1.14% 0.89%
Number of salaries quoted 351 849 747
10th Percentile £32,000 £31,250 £28,250
25th Percentile £41,250 £38,000 £36,250
Median annual salary (50th Percentile) £60,000 £50,000 £50,000
Median % change year-on-year +20.00% - -3.85%
75th Percentile £72,433 £70,000 £65,000
90th Percentile £81,250 £82,500 £78,750
UK excluding London median annual salary £50,000 £47,500 £42,500
% change year-on-year +5.26% +11.76% -5.56%

All Process and Methodology Skills
UK

Root Cause Analysis is in the Processes and Methodologies category. The following table is for comparison with the above and provides summary statistics for all permanent job vacancies with a requirement for process or methodology skills.

Permanent vacancies with a requirement for process or methodology skills 51,121 120,104 122,523
As % of all permanent jobs advertised in the UK 94.09% 95.72% 95.43%
Number of salaries quoted 36,956 73,203 81,032
10th Percentile £32,500 £34,313 £32,500
25th Percentile £43,750 £45,000 £42,500
Median annual salary (50th Percentile) £60,000 £60,000 £59,000
Median % change year-on-year - +1.69% +7.27%
75th Percentile £80,000 £81,250 £77,500
90th Percentile £98,750 £100,000 £95,000
UK excluding London median annual salary £52,500 £53,000 £50,000
% change year-on-year -0.94% +6.00% +4.17%

Root Cause Analysis
Job Vacancy Trend

Job postings citing Root Cause Analysis as a proportion of all IT jobs advertised.
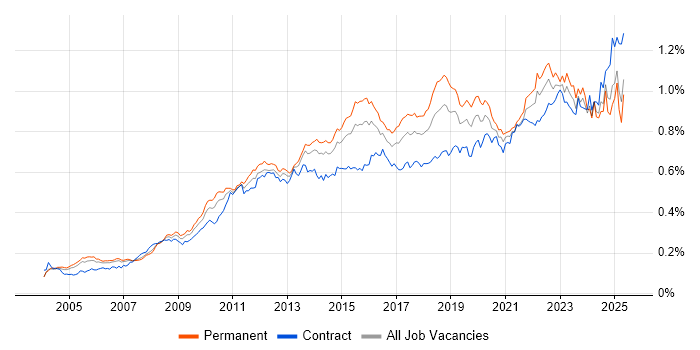
Job vacancy trend for Root Cause Analysis in the UK

Root Cause Analysis
Salary Trend

3-month moving average salary quoted in jobs citing Root Cause Analysis.

Salary trend for Root Cause Analysis in the UK

Root Cause Analysis
Salary Histogram

Salary distribution for jobs citing Root Cause Analysis over the 6 months to 28 November 2023.

Salary histogram for Root Cause Analysis in the UK

Root Cause Analysis
Top 17 Job Locations

The table below looks at the demand and provides a guide to the median salaries quoted in IT jobs citing Root Cause Analysis within the UK over the 6 months to 28 November 2023. The 'Rank Change' column provides an indication of the change in demand within each location based on the same 6 month period last year.

Location Rank Change
on Same Period
Last Year
Matching
Permanent
IT Job Ads
Median Salary
Past 6 Months
Median Salary
% Change
on Same Period
Last Year
Live
Jobs
England +22 489 £60,000 +20.00% 419
UK excluding London +23 412 £50,000 +5.26% 317
Work from Home +126 319 £62,500 +19.05% 149
London +65 167 £67,500 +3.85% 121
North of England +67 132 £39,997 -5.89% 74
North West +84 79 £36,250 -14.71% 40
South West +32 60 £59,556 +61.47% 23
South East +25 59 £55,000 +10.00% 82
Scotland +51 56 £57,500 +15.00% 16
Midlands -9 49 £52,500 +10.53% 85
Yorkshire +60 48 £46,250 -11.90% 22
West Midlands -2 26 £56,000 +17.89% 57
East Midlands +12 22 £40,250 -15.26% 27
Wales +25 21 £53,250 +42.95% 8
East of England +58 18 £60,000 +14.29% 35
Northern Ireland +52 17 - - 3
North East +28 5 £31,188 -26.62% 14

Root Cause Analysis
Co-occurring Skills and Capabilities by Category

The follow tables expand on the table above by listing co-occurrences grouped by category. The same employment type, locality and period is covered with up to 20 co-occurrences shown in each of the following categories:

Application Platforms
1 44 (7.13%) SharePoint
2 29 (4.70%) Confluence
3 19 (3.08%) WebSphere
3 19 (3.08%) WebSphere Application Server
4 9 (1.46%) MS Exchange
5 7 (1.13%) WordPress
6 3 (0.49%) IIS
6 3 (0.49%) SharePoint Server
7 2 (0.32%) CMS
7 2 (0.32%) Oracle Workflow
7 2 (0.32%) WebLogic
8 1 (0.16%) Alfresco
8 1 (0.16%) Apache Airflow
8 1 (0.16%) Jupyter
8 1 (0.16%) Sitecore CMS
8 1 (0.16%) TPMS
8 1 (0.16%) Umbraco
Applications
1 31 (5.02%) Microsoft Excel
2 27 (4.38%) Microsoft Office
3 13 (2.11%) Microsoft PowerPoint
4 5 (0.81%) MS Visio
5 1 (0.16%) CATIA
5 1 (0.16%) Microsoft Project
Business Applications
1 104 (16.86%) Hyperion Planning
2 7 (1.13%) SAP QM
3 6 (0.97%) SAP Business One
3 6 (0.97%) SAP S/4HANA
4 4 (0.65%) Dynamics CRM
4 4 (0.65%) Dynamics NAV
5 3 (0.49%) SAP CO
5 3 (0.49%) SAP FI
5 3 (0.49%) SAP FI/CO
6 2 (0.32%) Primavera
6 2 (0.32%) SAP SD
6 2 (0.32%) SAP SRM
7 1 (0.16%) Dynamics GP
7 1 (0.16%) Endur
7 1 (0.16%) IBM Planning Analytics
7 1 (0.16%) Oracle Applications
7 1 (0.16%) Oracle Manufacturing
7 1 (0.16%) SAP HR
7 1 (0.16%) SAP MM
7 1 (0.16%) SAP PS
Cloud Services
1 145 (23.50%) Azure
2 102 (16.53%) Microsoft 365
3 80 (12.97%) AWS
4 41 (6.65%) Power Platform
5 20 (3.24%) IaaS
6 19 (3.08%) Canva
6 19 (3.08%) Google Analytics
7 17 (2.76%) Cloud Computing
8 16 (2.59%) GCP
8 16 (2.59%) Power Automate
9 15 (2.43%) Dynamics 365
9 15 (2.43%) SaaS
10 14 (2.27%) Entra ID
11 13 (2.11%) Azure DevOps
12 12 (1.94%) SurveyMonkey
13 10 (1.62%) GitHub
14 7 (1.13%) Figma
14 7 (1.13%) Mimecast
15 6 (0.97%) Azure Synapse Analytics
15 6 (0.97%) WhatsApp
Communications & Networking
1 70 (11.35%) Firewall
2 40 (6.48%) DNS
3 31 (5.02%) DHCP
4 29 (4.70%) WAN
5 26 (4.21%) LAN
6 23 (3.73%) VPN
7 19 (3.08%) TCP/IP
8 17 (2.76%) Network Security
8 17 (2.76%) VLAN
9 15 (2.43%) Internet
9 15 (2.43%) Wireless
10 13 (2.11%) Wi-Fi
11 12 (1.94%) Intrusion Detection
12 11 (1.78%) SAN
12 11 (1.78%) VoIP
13 6 (0.97%) NGFW
14 4 (0.65%) IP Telephony
14 4 (0.65%) MPLS
14 4 (0.65%) Remote Desktop
14 4 (0.65%) SD-WAN
Database & Business Intelligence
1 40 (6.48%) SQL Server
2 36 (5.83%) Power BI
3 29 (4.70%) Data Warehouse
4 19 (3.08%) BusinessObjects
5 18 (2.92%) Big Data
6 16 (2.59%) PostgreSQL
7 14 (2.27%) BusinessObjects Business Intelligence
8 13 (2.11%) Data Mart
9 12 (1.94%) Amazon Redshift
9 12 (1.94%) Azure SQL Database
10 11 (1.78%) Tableau
11 9 (1.46%) MySQL
11 9 (1.46%) Oracle Database
12 8 (1.30%) Relational Database
13 6 (0.97%) Metadata
13 6 (0.97%) MS Access
13 6 (0.97%) SQL Server Integration Services
14 5 (0.81%) Data Mining
14 5 (0.81%) MongoDB
14 5 (0.81%) Power Query
Development Applications
1 49 (7.94%) JIRA
2 46 (7.46%) Git
3 16 (2.59%) Jenkins
4 14 (2.27%) Oracle APEX
5 13 (2.11%) Oracle Forms
6 11 (1.78%) Maven
7 10 (1.62%) Cucumber
7 10 (1.62%) Selenium
8 8 (1.30%) Bitbucket
8 8 (1.30%) JUnit
9 5 (0.81%) GitLab
9 5 (0.81%) Gradle
9 5 (0.81%) IBM UrbanCode
9 5 (0.81%) LoadRunner
9 5 (0.81%) Mocha
9 5 (0.81%) Sinon.JS
10 3 (0.49%) Android Studio
10 3 (0.49%) Protractor
10 3 (0.49%) TestNG
10 3 (0.49%) WebDriver
General
1 252 (40.84%) Finance
2 184 (29.82%) Social Skills
3 126 (20.42%) Analytical Skills
4 59 (9.56%) Legal
5 56 (9.08%) Retail
6 55 (8.91%) Banking
7 43 (6.97%) Presentation Skills
8 39 (6.32%) Manufacturing
9 30 (4.86%) Inclusion and Diversity
10 21 (3.40%) Influencing Skills
11 17 (2.76%) Organisational Skills
12 14 (2.27%) Public Sector
13 11 (1.78%) Pharmaceutical
14 9 (1.46%) Retail Finance
15 8 (1.30%) Law
15 8 (1.30%) Telecoms
16 6 (0.97%) Financial Institution
17 5 (0.81%) Automotive
18 4 (0.65%) Documentation Skills
18 4 (0.65%) Investment Banking
Job Titles
1 129 (20.91%) Analyst
2 110 (17.83%) Consultant
3 105 (17.02%) Oracle Consultant
4 88 (14.26%) Senior
5 43 (6.97%) Support Analyst
6 41 (6.65%) Infrastructure Engineer
7 38 (6.16%) Applications Support
8 37 (6.00%) Applications Support Analyst
8 37 (6.00%) Lead
9 33 (5.35%) Architect
9 33 (5.35%) Support Engineer
10 30 (4.86%) Senior Analyst
11 29 (4.70%) Solutions Architect
12 21 (3.40%) Administrator
13 20 (3.24%) 3rd Line Engineer
13 20 (3.24%) 3rd Line Support
14 19 (3.08%) 3rd Line Support Engineer
15 18 (2.92%) DBA
16 17 (2.76%) Developer
17 16 (2.59%) IT Support
Libraries, Frameworks & Software Standards
1 35 (5.67%) Spring Boot
2 28 (4.54%) Kafka
2 28 (4.54%) Spring
3 27 (4.38%) .NET
4 14 (2.27%) HTML
4 14 (2.27%) Middleware
5 11 (1.78%) REST
6 10 (1.62%) SOAP
7 9 (1.46%) CSS
8 7 (1.13%) Elastic Stack
8 7 (1.13%) RESTful
8 7 (1.13%) XML
9 6 (0.97%) React
10 5 (0.81%) ADO
10 5 (0.81%) Chai
10 5 (0.81%) Express.js
10 5 (0.81%) Keycloak
10 5 (0.81%) Node.js
10 5 (0.81%) Nunjucks
10 5 (0.81%) WebSphere MQ
Miscellaneous
1 41 (6.65%) Management Information System
2 25 (4.05%) Data Centre
3 23 (3.73%) Self-Motivation
4 22 (3.57%) Onboarding
5 18 (2.92%) CMDB
6 17 (2.76%) Security Posture
7 16 (2.59%) Blockchain
7 16 (2.59%) Virtual Team
8 14 (2.27%) Driving Licence
8 14 (2.27%) Product Ownership
8 14 (2.27%) Public Cloud
9 12 (1.94%) Robotics
10 11 (1.78%) Cyberattack
11 10 (1.62%) Insider Threat
11 10 (1.62%) Private Cloud
12 9 (1.46%) Replication
13 8 (1.30%) Analytical Mindset
13 8 (1.30%) Distributed Systems
13 8 (1.30%) Hybrid Cloud
14 7 (1.13%) Biopharmaceutical
Operating Systems
1 119 (19.29%) Windows
2 63 (10.21%) Windows Server
3 42 (6.81%) Unix
4 27 (4.38%) Linux
5 21 (3.40%) Windows Server 2016
6 19 (3.08%) Windows Server 2019
7 17 (2.76%) Windows Server 2012
8 13 (2.11%) AIX
9 12 (1.94%) Windows 10
10 11 (1.78%) Android
11 9 (1.46%) Windows 8
12 6 (0.97%) Apple iOS
13 4 (0.65%) Mac OS X
13 4 (0.65%) VMS
13 4 (0.65%) Windows 7
14 3 (0.49%) CentOS
15 2 (0.32%) Mac OS
15 2 (0.32%) Windows Server 2008
16 1 (0.16%) Red Hat Enterprise Linux
Processes & Methodologies
1 141 (22.85%) Actionable Insight
2 136 (22.04%) Problem-Solving
3 131 (21.23%) Agile
4 128 (20.75%) Migration
5 119 (19.29%) Validation
6 117 (18.96%) ITIL
7 106 (17.18%) Data Validation
8 104 (16.86%) Cost Management
8 104 (16.86%) Financial Modelling
9 87 (14.10%) Problem Management
10 79 (12.80%) Analytics
11 71 (11.51%) Continuous Improvement
11 71 (11.51%) DevOps
12 63 (10.21%) Mentoring
13 61 (9.89%) Business Intelligence
14 60 (9.72%) Customer Service
14 60 (9.72%) Incident Management
15 59 (9.56%) Cybersecurity
16 54 (8.75%) Infrastructure Engineering
17 53 (8.59%) ITSM
Programming Languages
1 207 (33.55%) SQL
2 78 (12.64%) Java
3 48 (7.78%) PowerShell
4 46 (7.46%) Python
5 28 (4.54%) PL/SQL
6 26 (4.21%) Bash
7 16 (2.59%) JavaScript
8 15 (2.43%) T-SQL
9 10 (1.62%) C#
10 7 (1.13%) Kusto Query Language
10 7 (1.13%) TypeScript
10 7 (1.13%) VBA
11 6 (0.97%) Shell Script
12 5 (0.81%) Kotlin
13 3 (0.49%) R
14 2 (0.32%) Swift
14 2 (0.32%) VB
15 1 (0.16%) ABAP
15 1 (0.16%) C
15 1 (0.16%) C++
Qualifications
1 116 (18.80%) Degree
2 47 (7.62%) ITIL Certification
3 41 (6.65%) Security Cleared
4 34 (5.51%) SC Cleared
5 27 (4.38%) Computer Science Degree
6 21 (3.40%) CISSP
7 15 (2.43%) Microsoft Certification
8 14 (2.27%) Master's Degree
9 13 (2.11%) Cisco Certification
10 12 (1.94%) CISM
11 10 (1.62%) Azure Certification
11 10 (1.62%) BPSS Clearance
11 10 (1.62%) DBS Check
12 9 (1.46%) GIAC
13 7 (1.13%) AWS Certification
13 7 (1.13%) ISACA
14 6 (0.97%) (ISC)2 CCSP
14 6 (0.97%) CompTIA Security+
14 6 (0.97%) MCP
14 6 (0.97%) PRINCE2 Practitioner
Quality Assurance & Compliance
1 57 (9.24%) QA
2 55 (8.91%) SLA
3 25 (4.05%) ISO/IEC 27001
4 18 (2.92%) SEPA
5 17 (2.76%) GDPR
6 15 (2.43%) ISO 20022
7 13 (2.11%) NIST
8 11 (1.78%) ISO 9001
9 7 (1.13%) Cyber Essentials
9 7 (1.13%) Data Quality
10 6 (0.97%) GRC
11 5 (0.81%) ITGC
12 4 (0.65%) GMP
12 4 (0.65%) HMG Security Policy Framework
12 4 (0.65%) PCI DSS
13 3 (0.49%) Cyber Essentials PLUS
13 3 (0.49%) ISO 14001
13 3 (0.49%) PMO
14 2 (0.32%) Accessibility
15 1 (0.16%) SOC 2
System Software
1 63 (10.21%) Active Directory
2 48 (7.78%) Docker
3 41 (6.65%) VMware Infrastructure
4 33 (5.35%) Hyper-V
5 12 (1.94%) Virtual Desktop
6 11 (1.78%) Firmware
7 8 (1.30%) Virtual Machines
7 8 (1.30%) VMware ESXi
8 7 (1.13%) XenApp
9 5 (0.81%) XenDesktop
10 3 (0.49%) NFS
11 2 (0.32%) Terminal Services
11 2 (0.32%) Virtual Servers
12 1 (0.16%) Microsoft Virtual Server
12 1 (0.16%) Snort
12 1 (0.16%) vSphere
Systems Management
1 51 (8.27%) Kubernetes
2 38 (6.16%) Microsoft Intune
3 36 (5.83%) Ansible
4 28 (4.54%) Terraform
5 13 (2.11%) Grafana
6 10 (1.62%) SCCM
7 8 (1.30%) Prometheus
8 6 (0.97%) CSIRT
8 6 (0.97%) Puppet
9 5 (0.81%) Kibana
10 4 (0.65%) VxRail
11 3 (0.49%) SCOM
12 2 (0.32%) FortiGate
12 2 (0.32%) Progress Chef
12 2 (0.32%) Salt
12 2 (0.32%) vRealize
12 2 (0.32%) vRealize Orchestrator
12 2 (0.32%) WSUS
13 1 (0.16%) CASB
13 1 (0.16%) Network Intrusion Detection System
Vendors
1 151 (24.47%) Microsoft
2 149 (24.15%) Oracle
3 104 (16.86%) Hyperion
4 65 (10.53%) VMware
5 54 (8.75%) ServiceNow
6 46 (7.46%) SAP
7 36 (5.83%) Google
8 24 (3.89%) Citrix
8 24 (3.89%) Splunk
9 23 (3.73%) Cisco
10 19 (3.08%) Hotjar
10 19 (3.08%) Salesforce
11 15 (2.43%) Meraki
12 10 (1.62%) Intel
13 8 (1.30%) HP
14 7 (1.13%) Apple
14 7 (1.13%) SolarWinds
15 6 (0.97%) Databricks
16 5 (0.81%) Dynatrace
16 5 (0.81%) Red Hat