Systems Engineer Jobs with Hybrid/Remote/WFH Options

System Engineer
UK > Work from Home

The median System Engineer salary for remote or hybrid work is £47,683 per year, according to job vacancies posted during the 6 months leading to 4 May 2025.

The table below provides salary benchmarking and summary statistics, comparing them to the same period in the previous two years.

6 months to
4 May 2025
Same period 2024 Same period 2023
Rank 52 234 360
Rank change year-on-year +182 +126 +113
Permanent jobs requiring a Systems Engineer 794 447 362
As % of all permanent jobs with a WFH option 5.18% 1.32% 0.85%
As % of the Job Titles category 5.71% 1.38% 0.89%
Number of salaries quoted 709 276 188
10th Percentile - £33,000 £36,356
25th Percentile - £41,000 £42,500
Median annual salary (50th Percentile) £47,683 £50,000 £60,000
Median % change year-on-year -4.63% -16.67% +20.00%
75th Percentile £70,600 £60,000 £76,563
90th Percentile - £65,375 £160,000
UK median annual salary £50,055 £50,000 £52,500
% change year-on-year +0.11% -4.76% +5.00%

All Permanent IT Job Vacancies
Work from Home

For comparison with the information above, the following table provides summary statistics for all permanent IT job vacancies with WFH or hybrid options. Most job vacancies include a discernible job title that can be normalized. As such, the figures in the second row provide an indication of the number of permanent jobs in our overall sample.

Permanent vacancies in Work from Home with a recognized job title 13,910 32,483 40,831
% of permanent jobs with a recognized job title 90.78% 96.00% 96.05%
Number of salaries quoted 9,940 24,937 29,014
10th Percentile £30,000 £33,081 £36,541
25th Percentile £43,750 £42,500 £47,393
Median annual salary (50th Percentile) £60,000 £56,000 £62,500
Median % change year-on-year +7.14% -10.40% +4.17%
75th Percentile £77,500 £75,000 £81,250
90th Percentile £100,000 £92,500 £100,000
UK median annual salary £57,500 £52,550 £60,000
% change year-on-year +9.42% -12.42% -

Systems Engineer
Trend for Jobs with a WFH Option

Job vacancies with remote working options which featured Systems Engineer in the job title as a proportion of all IT jobs advertised.
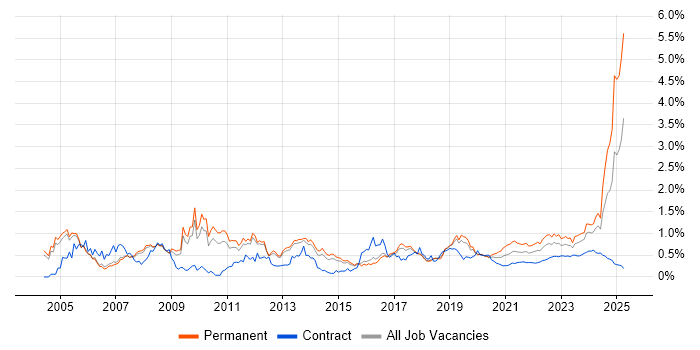
Systems Engineer trend for jobs with Hybrid/Remote/WFH options

Systems Engineer
Salary Trend for Jobs with a WFH Option

3-month moving average salary quoted in job vacancies with remote working options citing Systems Engineer.

Systems Engineer salary trend for jobs with a WFH option

Systems Engineer
Salary Histogram for Jobs with a WFH Option

Salary distribution for jobs with remote working options citing Systems Engineer over the 6 months to 4 May 2025.

Systems Engineer salary histogram for jobs with a WFH option

Systems Engineer Skill Set
Top 30 Co-occurring Skills and Capabilities in Job Vacancies with WFH Options

For the 6 months to 4 May 2025, Systems Engineer job roles required the following skills and capabilities in order of popularity. The figures indicate the absolute number co-occurrences and as a proportion of all permanent jobs with hybrid or remote work options featuring Systems Engineer in the job title.

1 704 (88.66%) Systems Engineering
2 680 (85.64%) BPSS Clearance
3 530 (66.75%) Agile
4 523 (65.87%) Degree
5 522 (65.74%) SysML
6 482 (60.71%) UML
7 469 (59.07%) Cybersecurity
8 468 (58.94%) MATLAB
9 464 (58.44%) Presentation Skills
10 462 (58.19%) MODAF
11 198 (24.94%) Technical Leadership
12 166 (20.91%) Electronics
13 162 (20.40%) IBM
14 159 (20.03%) Rational DOORS
14 159 (20.03%) Algorithms
15 158 (19.90%) Test Planning
15 158 (19.90%) Signal Processing
15 158 (19.90%) ISO/IEC 15288
16 70 (8.82%) Microsoft
17 61 (7.68%) Social Skills
18 60 (7.56%) Model-Based Systems Engineering
19 54 (6.80%) Aerospace
20 47 (5.92%) Project Management
21 44 (5.54%) Coaching
22 42 (5.29%) Simulink
23 41 (5.16%) Software Delivery
24 40 (5.04%) System Testing
24 40 (5.04%) MathWorks
24 40 (5.04%) Microsoft Office
24 40 (5.04%) Safety Engineering

Systems Engineer Skill Set
Co-occurring Skills and Capabilities with WFH Options by Category

The follow tables expand on the table above by listing co-occurrences grouped by category. The same employment type, locality and period is covered with up to 20 co-occurrences shown in each of the following categories:

Application Platforms
1 12 (1.51%) Microsoft Exchange
1 12 (1.51%) SharePoint
2 4 (0.50%) Apache
2 4 (0.50%) Apache Airflow
3 2 (0.25%) Confluence
Applications
1 42 (5.29%) Simulink
2 40 (5.04%) Microsoft Office
3 3 (0.38%) AutoCAD
4 2 (0.25%) Zemax
5 1 (0.13%) Blender
Business Applications
1 4 (0.50%) Q-Pulse
Cloud Services
1 25 (3.15%) Azure
2 23 (2.90%) Microsoft 365
3 18 (2.27%) AWS
4 16 (2.02%) Microsoft Purview
5 12 (1.51%) Cloud Computing
5 12 (1.51%) OneDrive
6 9 (1.13%) GitHub
6 9 (1.13%) Microsoft Copilot
7 5 (0.63%) Entra ID
8 4 (0.50%) CloudBees
8 4 (0.50%) SaaS
9 2 (0.25%) Azure Logic Apps
9 2 (0.25%) Azure Monitor
9 2 (0.25%) GCP
9 2 (0.25%) PaaS
9 2 (0.25%) Power Platform
9 2 (0.25%) PowerApps
10 1 (0.13%) Nutanix
Communications & Networking
1 4 (0.50%) DNS
2 3 (0.38%) Firewall
3 2 (0.25%) DHCP
3 2 (0.25%) Ethernet
3 2 (0.25%) Modbus
3 2 (0.25%) Profibus
3 2 (0.25%) VoIP
4 1 (0.13%) 5G
4 1 (0.13%) Kerberos
4 1 (0.13%) LAN
4 1 (0.13%) NAS
4 1 (0.13%) SAN
4 1 (0.13%) SD-WAN
4 1 (0.13%) TCP/IP
4 1 (0.13%) VPN
4 1 (0.13%) WAN
4 1 (0.13%) WLAN
Database & Business Intelligence
1 6 (0.76%) MongoDB
2 5 (0.63%) SQL Server
3 2 (0.25%) MS Access
3 2 (0.25%) Power BI
3 2 (0.25%) SQL Server Reporting Services
4 1 (0.13%) MySQL
4 1 (0.13%) QGIS
Development Applications
1 159 (20.03%) Rational DOORS
2 5 (0.63%) Eclipse
3 4 (0.50%) Jenkins
3 4 (0.50%) JIRA
4 1 (0.13%) Git
General
1 464 (58.44%) Presentation Skills
2 166 (20.91%) Electronics
3 61 (7.68%) Social Skills
4 54 (6.80%) Aerospace
5 20 (2.52%) Avionics
6 15 (1.89%) Analytical Skills
7 13 (1.64%) Legal
8 12 (1.51%) Inclusion and Diversity
9 9 (1.13%) Law
9 9 (1.13%) Public Sector
10 8 (1.01%) Finance
11 7 (0.88%) Military
12 6 (0.76%) Aviation
13 5 (0.63%) Manufacturing
14 3 (0.38%) Advertising
14 3 (0.38%) Pharmaceutical
15 2 (0.25%) Back Office
15 2 (0.25%) Organisational Skills
16 1 (0.13%) Games
16 1 (0.13%) Telecoms
Libraries, Frameworks & Software Standards
1 6 (0.76%) Flash
1 6 (0.76%) Kafka
2 4 (0.50%) XML
3 2 (0.25%) CSS
3 2 (0.25%) HTML
3 2 (0.25%) Middleware
4 1 (0.13%) .NET
4 1 (0.13%) Elastic Stack
4 1 (0.13%) REST
Miscellaneous
1 159 (20.03%) Algorithms
2 10 (1.26%) SCADA
3 9 (1.13%) NHS
4 8 (1.01%) Embedded Systems
5 6 (0.76%) Renewable Energy
6 4 (0.50%) Cloud Native
6 4 (0.50%) e-Learning
6 4 (0.50%) Reference Data
7 3 (0.38%) Management Information System
8 2 (0.25%) Client/Server
8 2 (0.25%) Data Centre
8 2 (0.25%) Distributed Systems
8 2 (0.25%) Life Science
8 2 (0.25%) PDA
9 1 (0.13%) GNSS
9 1 (0.13%) Greenfield Project
9 1 (0.13%) Hybrid Cloud
9 1 (0.13%) PKI
9 1 (0.13%) Self-Driving Car
9 1 (0.13%) Self-Motivation
Operating Systems
1 26 (3.27%) Linux
2 23 (2.90%) Windows
3 7 (0.88%) Windows Server
4 2 (0.25%) SUSE
4 2 (0.25%) Windows Server 2019
5 1 (0.13%) AIX
5 1 (0.13%) CentOS
5 1 (0.13%) Solaris
5 1 (0.13%) Ubuntu
5 1 (0.13%) Windows 10
5 1 (0.13%) Windows Server 2008
Processes & Methodologies
1 704 (88.66%) Systems Engineering
2 530 (66.75%) Agile
3 522 (65.74%) SysML
4 482 (60.71%) UML
5 469 (59.07%) Cybersecurity
6 462 (58.19%) MODAF
7 198 (24.94%) Technical Leadership
8 158 (19.90%) Signal Processing
8 158 (19.90%) Test Planning
9 60 (7.56%) Model-Based Systems Engineering
10 47 (5.92%) Project Management
11 44 (5.54%) Coaching
12 41 (5.16%) Software Delivery
13 40 (5.04%) Safety Engineering
13 40 (5.04%) System Testing
14 27 (3.40%) Line Management
15 25 (3.15%) Business Continuity
16 20 (2.52%) Requirements Analysis
16 20 (2.52%) Situational Awareness
17 15 (1.89%) Problem-Solving
Programming Languages
1 468 (58.94%) MATLAB
2 16 (2.02%) Python
3 13 (1.64%) PowerShell
4 9 (1.13%) C
4 9 (1.13%) C++
4 9 (1.13%) SQL
5 6 (0.76%) Bash
6 4 (0.50%) Embedded C++
6 4 (0.50%) PL/SQL
7 3 (0.38%) Ladder Logic
8 2 (0.25%) Go
8 2 (0.25%) Rust
9 1 (0.13%) Perl
9 1 (0.13%) R
9 1 (0.13%) Shell Script
Qualifications
1 680 (85.64%) BPSS Clearance
2 523 (65.87%) Degree
3 19 (2.39%) Security Cleared
4 12 (1.51%) SC Cleared
5 6 (0.76%) Chartered Engineer
5 6 (0.76%) Microsoft Certification
6 4 (0.50%) Computer Science Degree
7 3 (0.38%) MCSA
8 2 (0.25%) AWS Certification
8 2 (0.25%) Azure Certification
8 2 (0.25%) HND
9 1 (0.13%) AWS Certified Cloud Practitioner
9 1 (0.13%) DV Cleared
9 1 (0.13%) HNC
9 1 (0.13%) Linux+ Certification
9 1 (0.13%) Master's Degree
9 1 (0.13%) MCSE
9 1 (0.13%) RHCE
9 1 (0.13%) VMware Certified Professional (VCP)
Quality Assurance & Compliance
1 158 (19.90%) ISO/IEC 15288
2 8 (1.01%) GDPR
3 7 (0.88%) Def Stans
4 5 (0.63%) Accessibility
4 5 (0.63%) IEC 61131
5 4 (0.50%) Data Quality
6 3 (0.38%) QA
7 2 (0.25%) ECSS
7 2 (0.25%) HL7
7 2 (0.25%) SLA
8 1 (0.13%) HIPAA
8 1 (0.13%) Sarbanes-Oxley
System Software
1 13 (1.64%) Docker
2 11 (1.39%) VMware Infrastructure
3 10 (1.26%) Active Directory
4 5 (0.63%) Firmware
5 3 (0.38%) Hyper-V
6 2 (0.25%) Virtual Machines
6 2 (0.25%) vSphere
7 1 (0.13%) Dovecot
7 1 (0.13%) Postfix
Systems Management
1 7 (0.88%) Microsoft Intune
1 7 (0.88%) SCCM
2 6 (0.76%) Ansible
2 6 (0.76%) SCOM
2 6 (0.76%) Terraform
3 4 (0.50%) SCOrch
4 2 (0.25%) Kubernetes
5 1 (0.13%) Nagios
5 1 (0.13%) NetBackup
5 1 (0.13%) Single Sign-On
Vendors
1 162 (20.40%) IBM
2 70 (8.82%) Microsoft
3 40 (5.04%) MathWorks
4 17 (2.14%) VMware
5 8 (1.01%) Siemens
6 5 (0.63%) Cadence
6 5 (0.63%) Rockwell
6 5 (0.63%) Wonderware
7 4 (0.50%) IBM Sterling
8 3 (0.38%) Allen-Bradley
9 2 (0.25%) Ab Initio
9 2 (0.25%) arcserve
9 2 (0.25%) Aruba
9 2 (0.25%) Avaya
9 2 (0.25%) Cisco
9 2 (0.25%) Citrix
9 2 (0.25%) Linksys
9 2 (0.25%) MuleSoft
9 2 (0.25%) Veeam
10 1 (0.13%) Okta