C++ Jobs in England

C++
UK > England

The table below provides summary statistics for permanent job vacancies advertised in England requiring C++ skills. It includes a benchmarking guide to the annual salaries offered in vacancies that cited C++ over the 6 months leading up to 29 May 2025, comparing them to the same period in the previous two years.

6 months to
29 May 2025
Same period 2024 Same period 2023
Rank 104 137 154
Rank change year-on-year +33 +17 -66
Permanent jobs citing C++ 1,461 1,816 2,028
As % of all permanent jobs advertised in England 3.01% 2.04% 2.34%
As % of the Programming Languages category 9.97% 6.48% 5.44%
Number of salaries quoted 545 1,426 1,415
10th Percentile £36,450 £37,625 £37,500
25th Percentile £51,250 £46,250 £48,750
Median annual salary (50th Percentile) £66,225 £60,000 £67,500
Median % change year-on-year +10.38% -11.11% -
75th Percentile £95,000 £73,750 £90,000
90th Percentile £130,000 £95,000 £122,500
UK median annual salary £66,212 £60,000 £65,000
% change year-on-year +10.35% -7.69% -

All Programming Languages
England

C++ falls under the Programming Languages category. For comparison with the information above, the following table provides summary statistics for all permanent job vacancies requiring coding skills in England.

Permanent vacancies with a requirement for coding skills 14,652 28,024 37,268
As % of all permanent jobs advertised in England 30.18% 31.54% 43.05%
Number of salaries quoted 9,481 22,545 24,192
10th Percentile £37,500 £35,000 £40,000
25th Percentile £47,683 £45,000 £50,000
Median annual salary (50th Percentile) £60,000 £60,000 £65,000
Median % change year-on-year - -7.69% +4.00%
75th Percentile £82,500 £80,000 £87,500
90th Percentile £110,000 £100,000 £110,000
UK median annual salary £60,000 £60,000 £65,000
% change year-on-year - -7.69% +4.00%

C++
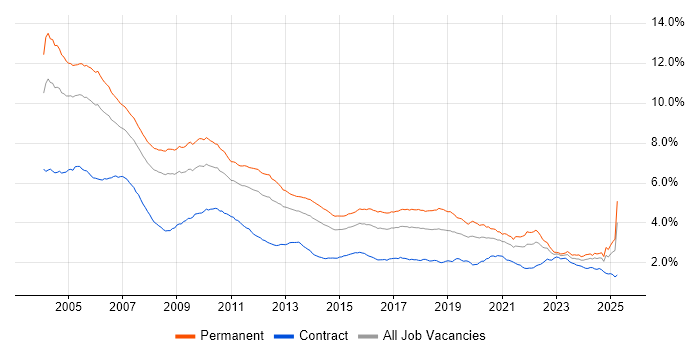
Job Vacancy Trend in England

Job postings citing C++ as a proportion of all IT jobs advertised in England.

Job vacancy trend for C++ in England

C++
Salary Trend in England

3-month moving average salary quoted in jobs citing C++ in England.

Salary trend for C++ in England

C++
Salary Histogram in England

Salary distribution for jobs citing C++ in England over the 6 months to 29 May 2025.

Salary histogram for C++ in England

C++
Job Locations in England

The table below looks at the demand and provides a guide to the median salaries quoted in IT jobs citing C++ within the England region over the 6 months to 29 May 2025. The 'Rank Change' column provides an indication of the change in demand within each location based on the same 6 month period last year.

Location Rank Change
on Same Period
Last Year
Matching
Permanent
IT Job Ads
Median Salary
Past 6 Months
Median Salary
% Change
on Same Period
Last Year
Live
Jobs
North of England +133 622 £50,000 -13.04% 217
North West +139 583 £55,000 -12.00% 114
London +78 309 £110,000 +22.22% 894
East of England +44 205 £66,206 +10.34% 338
South East -54 203 £60,000 +4.35% 444
Midlands -78 56 £31,000 -38.00% 117
South West -46 54 £60,000 +7.62% 181
Yorkshire +14 32 £46,000 -3.16% 59
West Midlands -33 31 £31,000 -47.23% 63
East Midlands -37 24 £47,500 +5.56% 48
North East +27 7 £25,000 -54.95% 44
C++
UK

C++
Co-occurring Skills and Capabilities in England by Category

The follow tables expand on the table above by listing co-occurrences grouped by category. The same employment type, locality and period is covered with up to 20 co-occurrences shown in each of the following categories:

Application Platforms
1 15 (1.03%) Kinematics
2 3 (0.21%) Apache
2 3 (0.21%) Apache Spark
2 3 (0.21%) OpenStack
2 3 (0.21%) WinCC
3 2 (0.14%) CMS
3 2 (0.14%) WordPress
4 1 (0.068%) Ethereum
4 1 (0.068%) Jupyter
4 1 (0.068%) Microsoft Exchange
4 1 (0.068%) MTS
4 1 (0.068%) OpenEdge
4 1 (0.068%) Oracle Workflow
4 1 (0.068%) SharePoint
Applications
1 108 (7.39%) Chatbot
2 9 (0.62%) Simulink
3 8 (0.55%) Microsoft Excel
4 6 (0.41%) Microsoft Office
5 4 (0.27%) GNU Octave
5 4 (0.27%) OrCAD
6 2 (0.14%) Microsoft Project
7 1 (0.068%) 3ds Max
7 1 (0.068%) Adobe Creative Suite
7 1 (0.068%) CANalyzer
7 1 (0.068%) Houdini
7 1 (0.068%) Microsoft PowerPoint
Business Applications
1 4 (0.27%) Dynamics NAV
1 4 (0.27%) Remedy ITSM
2 3 (0.21%) Orchestrade
3 1 (0.068%) Refinitiv Enterprise Platform
Cloud Services
1 302 (20.67%) Azure
2 286 (19.58%) AWS
3 190 (13.00%) GCP
4 63 (4.31%) Amazon EKS
5 49 (3.35%) AWS CloudFormation
6 17 (1.16%) Amazon S3
6 17 (1.16%) AWS Lambda
6 17 (1.16%) Serverless
7 14 (0.96%) Amazon EC2
7 14 (0.96%) Datadog
8 8 (0.55%) GitHub
9 7 (0.48%) Power Platform
10 5 (0.34%) Azure Synapse Analytics
10 5 (0.34%) Cloud Computing
10 5 (0.34%) Microsoft 365
11 4 (0.27%) Amazon Bedrock
12 2 (0.14%) Asana
12 2 (0.14%) Google Analytics
12 2 (0.14%) PaaS
13 1 (0.068%) Azure Data Factory
Communications & Networking
1 407 (27.86%) VPN
2 399 (27.31%) DNS
3 35 (2.40%) TCP/IP
4 32 (2.19%) Wireless
5 17 (1.16%) Software-Defined Radio
6 13 (0.89%) WAN
7 12 (0.82%) RS-485
8 11 (0.75%) HTTP
8 11 (0.75%) Internet
8 11 (0.75%) Multicast
9 10 (0.68%) Modbus
9 10 (0.68%) Network Security
10 9 (0.62%) Bluetooth
11 8 (0.55%) 5G
12 7 (0.48%) Firewall
12 7 (0.48%) Profibus
12 7 (0.48%) RS-232
12 7 (0.48%) SD-WAN
13 6 (0.41%) FTP
13 6 (0.41%) ZigBee
Database & Business Intelligence
1 52 (3.56%) Elasticsearch
2 44 (3.01%) SQL Server
3 34 (2.33%) MySQL
4 21 (1.44%) Relational Database
5 17 (1.16%) PostgreSQL
6 14 (0.96%) NoSQL
7 10 (0.68%) MongoDB
8 7 (0.48%) Power BI
8 7 (0.48%) RDBMS
9 6 (0.41%) KDB
10 5 (0.34%) Big Data
11 4 (0.27%) Hadoop
11 4 (0.27%) Metabase
11 4 (0.27%) Tick Data
12 3 (0.21%) ClickHouse
12 3 (0.21%) Kdb+
12 3 (0.21%) Metadata
12 3 (0.21%) Pinecone
12 3 (0.21%) Weaviate
13 2 (0.14%) Scylla
Development Applications
1 68 (4.65%) Git
2 31 (2.12%) Jenkins
3 22 (1.51%) GitLab
4 20 (1.37%) JIRA
5 16 (1.10%) JUnit
5 16 (1.10%) Maven
6 15 (1.03%) Cucumber
6 15 (1.03%) Mockito
7 14 (0.96%) IntelliJ
8 13 (0.89%) Subversion
9 12 (0.82%) Visual Studio
10 7 (0.48%) MagicDraw
11 6 (0.41%) CMake
11 6 (0.41%) Rational DOORS
12 4 (0.27%) Eclipse
12 4 (0.27%) GDB
13 3 (0.21%) IDA Disassembler
13 3 (0.21%) MLflow
13 3 (0.21%) Rational Rhapsody
14 2 (0.14%) Postman
General
1 653 (44.70%) Inclusion and Diversity
2 598 (40.93%) Finance
3 499 (34.15%) Analytical Skills
4 129 (8.83%) Social Skills
5 87 (5.95%) Electronics
6 58 (3.97%) Banking
7 47 (3.22%) Aerospace
7 47 (3.22%) Front Office
8 41 (2.81%) Manufacturing
9 36 (2.46%) Investment Banking
10 24 (1.64%) Marketing
11 17 (1.16%) Law
12 14 (0.96%) Presentation Skills
12 14 (0.96%) Publishing
12 14 (0.96%) Telecoms
13 12 (0.82%) Military
14 10 (0.68%) Organisational Skills
15 9 (0.62%) Legal
15 9 (0.62%) Public Sector
16 8 (0.55%) Automotive
Job Titles
1 714 (48.87%) Developer
2 499 (34.15%) Software Developer
3 431 (29.50%) Software Engineer
4 385 (26.35%) Senior
5 276 (18.89%) Senior Software Engineer
6 104 (7.12%) C++ Developer
7 103 (7.05%) Lead
8 101 (6.91%) Trainer
9 73 (5.00%) Senior Developer
10 69 (4.72%) Embedded Engineer
11 55 (3.76%) Embedded Software Engineer
12 53 (3.63%) Cloud Engineer
12 53 (3.63%) Low Latency C++ Developer
13 47 (3.22%) Graduate
14 45 (3.08%) Quantitative Developer
15 42 (2.87%) C++ Software Engineer
16 41 (2.81%) Cloud Software Engineer
17 39 (2.67%) Senior C++ Developer
18 37 (2.53%) C++ Quantitative Developer
19 36 (2.46%) Linux Developer
Libraries, Frameworks & Software Standards
1 290 (19.85%) .NET
2 239 (16.36%) Node.js
3 175 (11.98%) HTML
4 52 (3.56%) Pandas
5 46 (3.15%) ASP.NET
6 43 (2.94%) CSS
7 35 (2.40%) jQuery
8 28 (1.92%) Boost C++ Libraries
9 25 (1.71%) Middleware
10 20 (1.37%) Qt
11 19 (1.30%) FIX Protocol
12 17 (1.16%) React
12 17 (1.16%) Spring
12 17 (1.16%) Spring Boot
13 15 (1.03%) ActiveMQ
14 14 (0.96%) JMS
15 12 (0.82%) .NET Core
16 11 (0.75%) XML
17 10 (0.68%) .NET Framework
17 10 (0.68%) pytest
Miscellaneous
1 624 (42.71%) Cyberattack
2 204 (13.96%) Self-Motivation
3 184 (12.59%) Linux Command Line
4 123 (8.42%) Algorithms
5 74 (5.07%) Embedded Systems
6 52 (3.56%) Hedge funds
7 47 (3.22%) Distributed Systems
7 47 (3.22%) FPGA
8 44 (3.01%) Equities
9 43 (2.94%) Cloud Native
10 41 (2.81%) Data Structures
11 38 (2.60%) Robotics
12 36 (2.46%) Management Information System
13 35 (2.40%) Legacy Code
14 30 (2.05%) Derivative
15 26 (1.78%) Foreign Exchange (FX)
16 24 (1.64%) Enterprise Software
17 20 (1.37%) e-Learning
18 19 (1.30%) MicroBlaze
19 16 (1.10%) RISC-V
Operating Systems
1 892 (61.05%) Linux
2 470 (32.17%) Android
3 36 (2.46%) Windows
4 33 (2.26%) Embedded Linux
5 24 (1.64%) Unix
6 16 (1.10%) Apple iOS
7 7 (0.48%) FreeRTOS
8 5 (0.34%) Red Hat Enterprise Linux
9 4 (0.27%) Robot Operating System
10 3 (0.21%) Ubuntu
11 2 (0.14%) Mac OS
11 2 (0.14%) Rocky
11 2 (0.14%) VMS
12 1 (0.068%) Debian
Processes & Methodologies
1 783 (53.59%) Agile
2 577 (39.49%) Mathematics
3 554 (37.92%) Software Engineering
4 537 (36.76%) OO
5 494 (33.81%) OOP
6 455 (31.14%) Android Development
7 454 (31.07%) Design Patterns
7 454 (31.07%) Line Management
8 290 (19.85%) Machine Learning
9 230 (15.74%) Mentoring
10 224 (15.33%) Computer Science
11 214 (14.65%) Artificial Intelligence
12 204 (13.96%) Scrum
13 193 (13.21%) User Experience
14 190 (13.00%) Data Engineering
14 190 (13.00%) Microservices
15 181 (12.39%) Cloud Security
16 179 (12.25%) Site Reliability Engineering
17 116 (7.94%) Low Latency
18 109 (7.46%) Conversational UI
Programming Languages
1 1,094 (74.88%) Python
2 880 (60.23%) Java
3 686 (46.95%) Go
4 418 (28.61%) JavaScript
5 354 (24.23%) Rust
6 344 (23.55%) C
7 307 (21.01%) C#
8 239 (16.36%) SQL
9 95 (6.50%) MATLAB
10 91 (6.23%) PHP
11 69 (4.72%) TypeScript
12 64 (4.38%) R
13 50 (3.42%) Ruby
14 49 (3.35%) Dart
15 25 (1.71%) Bash
16 18 (1.23%) Kotlin
17 15 (1.03%) Perl
18 14 (0.96%) Embedded C++
18 14 (0.96%) Fortran
19 13 (0.89%) Ada
Qualifications
1 707 (48.39%) Security Cleared
2 655 (44.83%) DV Cleared
3 387 (26.49%) Degree
4 180 (12.32%) AWS Certification
5 179 (12.25%) AWS Certified Solutions Architect
6 178 (12.18%) AWS Certified Developer
7 119 (8.15%) Computer Science Degree
8 65 (4.45%) PhD
9 55 (3.76%) Master's Degree
10 54 (3.70%) SC Cleared
11 11 (0.75%) Numerate Degree
12 9 (0.62%) BPSS Clearance
13 4 (0.27%) A+ Certification
13 4 (0.27%) Dell Certification
13 4 (0.27%) MCP
13 4 (0.27%) Microsoft Certification
13 4 (0.27%) Postgraduate
14 3 (0.21%) CISSP
15 2 (0.14%) CompTIA Security+
15 2 (0.14%) PMP
Quality Assurance & Compliance
1 23 (1.57%) QA
2 4 (0.27%) PMO
3 3 (0.21%) Accessibility
3 3 (0.21%) Def Stans
3 3 (0.21%) GDPR
3 3 (0.21%) ISO/IEC 27001
3 3 (0.21%) NIST
4 2 (0.14%) Data Quality
4 2 (0.14%) HIPAA
4 2 (0.14%) IEC 61508
4 2 (0.14%) ISO 9001
5 1 (0.068%) COBIT
5 1 (0.068%) ECSS
5 1 (0.068%) HL7
5 1 (0.068%) ISO 13485
5 1 (0.068%) MISRA
System Software
1 472 (32.31%) Docker
2 50 (3.42%) Firmware
3 37 (2.53%) Embedded Firmware
4 3 (0.21%) HDFS
5 1 (0.068%) Xen
Systems Management
1 464 (31.76%) Ansible
2 114 (7.80%) Kubernetes
3 67 (4.59%) Terraform
4 7 (0.48%) Grafana
4 7 (0.48%) Prometheus
5 6 (0.41%) QRadar
6 3 (0.21%) Functional Safety
6 3 (0.21%) Kubeflow
7 1 (0.068%) Kibana
Vendors
1 104 (7.12%) PayPal
2 25 (1.71%) Microsoft
3 17 (1.16%) IBM
4 11 (0.75%) Siemens
5 9 (0.62%) EMC
6 8 (0.55%) Google
6 8 (0.55%) Red Hat
6 8 (0.55%) Xilinx
7 7 (0.48%) Oracle
7 7 (0.48%) Splunk
8 5 (0.34%) Intel
8 5 (0.34%) SAP
9 4 (0.27%) Agilent
9 4 (0.27%) Databricks
9 4 (0.27%) Dell
9 4 (0.27%) Foundry
9 4 (0.27%) OpenAI
9 4 (0.27%) Palantir
9 4 (0.27%) Remedy
9 4 (0.27%) ServiceNow