Digital Engineering
UK

The following table provides summary statistics for permanent job vacancies with a requirement for Digital Engineering skills. Included is a benchmarking guide to the salaries offered in vacancies that have cited Digital Engineering over the 6 months to 30 November 2023 with a comparison to the same period in the previous 2 years.

6 months to
30 Nov 2023
Same period 2022 Same period 2021
Rank 395 397 698
Rank change year-on-year +2 +301 -70
Permanent jobs citing Digital Engineering 376 1,029 434
As % of all permanent jobs advertised in the UK 0.70% 0.81% 0.34%
As % of the Processes & Methodologies category 0.74% 0.85% 0.35%
Number of salaries quoted 29 235 72
10th Percentile £27,000 £43,000 £55,500
25th Percentile £43,750 £52,500 £75,000
Median annual salary (50th Percentile) £80,000 £70,117 £85,000
Median % change year-on-year +14.10% -17.51% +6.25%
75th Percentile £155,000 £105,000 -
90th Percentile £163,000 £120,000 £99,500
UK excluding London median annual salary £80,750 £68,500 £60,000
% change year-on-year +17.88% +14.17% -25.00%

All Process and Methodology Skills
UK

Digital Engineering is in the Processes and Methodologies category. The following table is for comparison with the above and provides summary statistics for all permanent job vacancies with a requirement for process or methodology skills.

Permanent vacancies with a requirement for process or methodology skills 50,664 120,987 123,563
As % of all permanent jobs advertised in the UK 94.08% 95.74% 95.44%
Number of salaries quoted 36,731 73,454 82,144
10th Percentile £32,500 £34,347 £32,500
25th Percentile £43,750 £45,000 £42,500
Median annual salary (50th Percentile) £60,000 £60,000 £59,500
Median % change year-on-year - +0.84% +8.18%
75th Percentile £80,000 £81,250 £77,500
90th Percentile £98,750 £100,000 £95,000
UK excluding London median annual salary £52,500 £53,000 £50,000
% change year-on-year -0.94% +6.00% +4.17%

Digital Engineering
Job Vacancy Trend

Job postings citing Digital Engineering as a proportion of all IT jobs advertised.
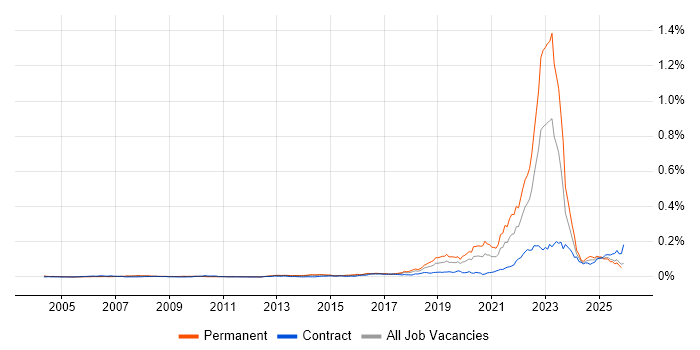
Job vacancy trend for Digital Engineering in the UK

Digital Engineering
Salary Trend

3-month moving average salary quoted in jobs citing Digital Engineering.

Salary trend for Digital Engineering in the UK

Digital Engineering
Salary Histogram

Salary distribution for jobs citing Digital Engineering over the 6 months to 30 November 2023.

Salary histogram for Digital Engineering in the UK

Digital Engineering
Top 15 Job Locations

The table below looks at the demand and provides a guide to the median salaries quoted in IT jobs citing Digital Engineering within the UK over the 6 months to 30 November 2023. The 'Rank Change' column provides an indication of the change in demand within each location based on the same 6 month period last year.

Location Rank Change
on Same Period
Last Year
Matching
Permanent
IT Job Ads
Median Salary
Past 6 Months
Median Salary
% Change
on Same Period
Last Year
Live
Jobs
England +12 370 £80,000 +6.67% 71
Work from Home +276 187 £63,750 -8.93% 26
London +98 117 £60,000 -27.27% 28
UK excluding London -33 60 £80,750 +17.88% 38
North of England -22 27 £80,000 +6.67% 7
North West -48 26 £80,000 +6.67% 3
South West +78 9 £81,500 +16.24% 12
East of England +122 7 £150,000 +106.90% 1
South East +155 6 - - 7
Midlands +101 6 £42,661 -39.06% 10
West Midlands +113 5 £42,661 -39.06% 9
Northern Ireland +39 3 - - 1
Scotland -33 2 - -
Yorkshire +81 1 - - 3
East Midlands +47 1 - - 1

Digital Engineering
Co-occurring Skills and Capabilities by Category

The follow tables expand on the table above by listing co-occurrences grouped by category. The same employment type, locality and period is covered with up to 20 co-occurrences shown in each of the following categories:

Application Platforms
1 39 (10.37%) SharePoint
2 24 (6.38%) Confluence
3 2 (0.53%) NetWeaver
4 1 (0.27%) Apache
4 1 (0.27%) Apache Airflow
4 1 (0.27%) Apache Spark
4 1 (0.27%) Kinematics
Applications
1 10 (2.66%) Microsoft Office
2 7 (1.86%) Microsoft Excel
3 4 (1.06%) Chatbot
4 2 (0.53%) 3ds Max
4 2 (0.53%) Adobe XD
4 2 (0.53%) Blender
4 2 (0.53%) CINEMA 4D
4 2 (0.53%) InVision
4 2 (0.53%) Microsoft Project
4 2 (0.53%) MicroStation
4 2 (0.53%) Sketch
5 1 (0.27%) CATIA
5 1 (0.27%) Microsoft PowerPoint
5 1 (0.27%) MS Visio
5 1 (0.27%) Open Workbench
Business Applications
1 31 (8.24%) SAP S/4HANA
2 25 (6.65%) SAP SCM
3 6 (1.60%) SAP GTS
3 6 (1.60%) SAP PM
3 6 (1.60%) SAP WM
4 5 (1.33%) SAP CRM
4 5 (1.33%) SAP CX
4 5 (1.33%) SAP MM
4 5 (1.33%) SAP Payroll
4 5 (1.33%) SAP SD
5 3 (0.80%) SAP CO
5 3 (0.80%) SAP ERP
5 3 (0.80%) SAP FI
5 3 (0.80%) SAP FI/CO
5 3 (0.80%) SAP PS
5 3 (0.80%) Workday HCM
6 2 (0.53%) Oracle Cash Management
6 2 (0.53%) Oracle General Ledger
6 2 (0.53%) Oracle Payables
6 2 (0.53%) Oracle Receivables
Cloud Services
1 92 (24.47%) Azure
2 59 (15.69%) GCP
3 57 (15.16%) AWS
4 28 (7.45%) Azure DevOps
5 26 (6.91%) PaaS
6 25 (6.65%) BlazeMeter
6 25 (6.65%) IaaS
6 25 (6.65%) Serverless
6 25 (6.65%) SuccessFactors
7 21 (5.59%) Power Platform
8 17 (4.52%) SaaS
9 13 (3.46%) GitHub
10 12 (3.19%) Amazon SQS
10 12 (3.19%) AWS CodeCommit
10 12 (3.19%) Azure Monitor
11 10 (2.66%) Azure Data Factory
12 8 (2.13%) Dynamics 365
13 7 (1.86%) Amazon SageMaker
13 7 (1.86%) Azure Machine Learning
13 7 (1.86%) Microsoft Purview
Communications & Networking
1 13 (3.46%) WAN
2 12 (3.19%) AMQP
3 11 (2.93%) Firewall
4 9 (2.39%) Network Security
5 8 (2.13%) DNS
5 8 (2.13%) LAN
6 7 (1.86%) Cisco Firepower
6 7 (1.86%) Cisco IOS
6 7 (1.86%) Cisco ISE
6 7 (1.86%) Ethernet
6 7 (1.86%) F5 BIG-IP GTM
6 7 (1.86%) F5 BIG-IP LTM
6 7 (1.86%) NX-OS
6 7 (1.86%) SD-WAN
7 3 (0.80%) SAN
8 2 (0.53%) Intranet
8 2 (0.53%) Wireless
9 1 (0.27%) Converged Networks
9 1 (0.27%) VPN
9 1 (0.27%) Wireless Security
Database & Business Intelligence
1 27 (7.18%) SQL Server
2 24 (6.38%) Data Warehouse
3 20 (5.32%) Oracle Database
3 20 (5.32%) Oracle Database 10g
3 20 (5.32%) Oracle Database 11g
4 15 (3.99%) Big Data
5 12 (3.19%) MongoDB
6 11 (2.93%) Power BI
7 10 (2.66%) Metadata
8 8 (2.13%) QGIS
9 7 (1.86%) Data Lake
9 7 (1.86%) GIS
9 7 (1.86%) NoSQL
10 6 (1.60%) Azure SQL Database
11 5 (1.33%) BigQuery
11 5 (1.33%) Geospatial Data
12 4 (1.06%) OLAP
12 4 (1.06%) OLTP
12 4 (1.06%) SQL Server Analysis Services
13 3 (0.80%) BusinessObjects
Development Applications
1 33 (8.78%) Jenkins
2 27 (7.18%) Git
2 27 (7.18%) GitLab
3 25 (6.65%) Cucumber
4 24 (6.38%) JIRA
5 20 (5.32%) eggPlant
5 20 (5.32%) JMeter
5 20 (5.32%) Postman
5 20 (5.32%) REST Assured
5 20 (5.32%) SoapUI
5 20 (5.32%) The Grinder
6 18 (4.79%) LoadRunner
7 13 (3.46%) Octopus Deploy
7 13 (3.46%) TeamCity
8 12 (3.19%) ClearCase
8 12 (3.19%) JUnit
8 12 (3.19%) Maven
8 12 (3.19%) Mockito
9 6 (1.60%) Bitbucket
9 6 (1.60%) ERwin
General
1 172 (45.74%) Inclusion and Diversity
2 69 (18.35%) Social Skills
3 62 (16.49%) Finance
4 43 (11.44%) Public Sector
5 24 (6.38%) Retail
6 19 (5.05%) Manufacturing
7 15 (3.99%) Aerospace
8 14 (3.72%) Analytical Skills
8 14 (3.72%) Banking
9 12 (3.19%) Influencing Skills
10 11 (2.93%) Automotive
10 11 (2.93%) Legal
11 6 (1.60%) Military
11 6 (1.60%) Presentation Skills
12 5 (1.33%) Marketing
13 3 (0.80%) German Language
13 3 (0.80%) Japanese Language
13 3 (0.80%) Law
13 3 (0.80%) Organisational Skills
13 3 (0.80%) Spanish Language
Job Titles
1 111 (29.52%) Consultant
2 47 (12.50%) Senior
3 39 (10.37%) Architect
4 37 (9.84%) Lead
5 30 (7.98%) Project Manager
5 30 (7.98%) SAP Consultant
6 23 (6.12%) Analyst
6 23 (6.12%) DevOps Engineer
6 23 (6.12%) Senior Consultant
7 21 (5.59%) Data Consultant
8 20 (5.32%) SAP S/4HANA Consultant
9 17 (4.52%) Solutions Architect
10 16 (4.26%) Developer
11 14 (3.72%) Microsoft Engineer
12 13 (3.46%) Data Migration Consultant
12 13 (3.46%) Migration Consultant
12 13 (3.46%) SAP Supply Chain Consultant
12 13 (3.46%) Supply Chain Consultant
12 13 (3.46%) Test Leader
13 12 (3.19%) Automation Test Analyst
Libraries, Frameworks & Software Standards
1 24 (6.38%) Middleware
2 22 (5.85%) .NET
2 22 (5.85%) JSON
3 20 (5.32%) Gherkin
4 14 (3.72%) SAPUI5
4 14 (3.72%) XML
5 13 (3.46%) LDAP
6 12 (3.19%) Flask
6 12 (3.19%) OpenAPI
6 12 (3.19%) RabbitMQ
6 12 (3.19%) Swagger
6 12 (3.19%) WireMock
7 11 (2.93%) REST
7 11 (2.93%) Spring
8 10 (2.66%) Apache Camel
8 10 (2.66%) CSS
8 10 (2.66%) HTML
8 10 (2.66%) Spring Integration
9 8 (2.13%) Lightning Web Components
9 8 (2.13%) Node.js
Miscellaneous
1 18 (4.79%) IoT
2 17 (4.52%) Virtual Team
3 13 (3.46%) Blog
3 13 (3.46%) Social Media
4 12 (3.19%) Cloud Native
4 12 (3.19%) Mobile App
5 10 (2.66%) Management Information System
5 10 (2.66%) Self-Motivation
6 9 (2.39%) Public Cloud
7 8 (2.13%) Data Centre
7 8 (2.13%) Reference Data
8 7 (1.86%) Operational Technology
9 6 (1.60%) Greenfield Project
9 6 (1.60%) Hybrid Cloud
9 6 (1.60%) Life Science
10 5 (1.33%) Learning Management System
10 5 (1.33%) Private Cloud
11 4 (1.06%) Augmented Reality
11 4 (1.06%) Product Ownership
11 4 (1.06%) Security Posture
Operating Systems
1 29 (7.71%) Windows
2 16 (4.26%) Unix
3 13 (3.46%) VMS
4 9 (2.39%) Linux
5 8 (2.13%) Mac OS
6 7 (1.86%) Apple iOS
7 4 (1.06%) Android
8 2 (0.53%) Red Hat Enterprise Linux
8 2 (0.53%) Solaris
9 1 (0.27%) CentOS
9 1 (0.27%) Mac OS X
9 1 (0.27%) Windows 10
9 1 (0.27%) Windows 7
9 1 (0.27%) Windows 8
9 1 (0.27%) Windows Server
Processes & Methodologies
1 207 (55.05%) Artificial Intelligence
2 137 (36.44%) Agile
3 136 (36.17%) People Management
4 86 (22.87%) DevOps
4 86 (22.87%) Roadmaps
5 79 (21.01%) Mentoring
6 74 (19.68%) Analytics
6 74 (19.68%) Project Delivery
7 60 (15.96%) Project Management
8 56 (14.89%) Presales
9 48 (12.77%) Continuous Integration
10 43 (11.44%) Migration
11 42 (11.17%) CI/CD
12 37 (9.84%) Test Automation
13 36 (9.57%) ERP
13 36 (9.57%) Workshop Facilitation
14 33 (8.78%) Data Management
14 33 (8.78%) SDLC
14 33 (8.78%) Software Engineering
15 32 (8.51%) Stakeholder Management
Programming Languages
1 52 (13.83%) Java
2 50 (13.30%) Python
3 39 (10.37%) C#
3 39 (10.37%) JavaScript
4 34 (9.04%) SQL
5 20 (5.32%) C
6 17 (4.52%) Groovy
7 16 (4.26%) PowerShell
8 14 (3.72%) Bash
8 14 (3.72%) Go
9 13 (3.46%) Perl
10 12 (3.19%) Ruby
10 12 (3.19%) Tcl
11 8 (2.13%) VBScript
12 7 (1.86%) ABAP
12 7 (1.86%) Apex Code
13 6 (1.60%) Shell Script
14 4 (1.06%) VB
15 3 (0.80%) T-SQL
15 3 (0.80%) X++
Qualifications
1 184 (48.94%) Security Cleared
2 87 (23.14%) SC Cleared
3 46 (12.23%) BPSS Clearance
4 38 (10.11%) DV Cleared
5 36 (9.57%) Degree
6 7 (1.86%) AWS Certification
6 7 (1.86%) Computer Science Degree
7 4 (1.06%) ACCA
7 4 (1.06%) CIMA
7 4 (1.06%) Microsoft Certification
8 2 (0.53%) AWS Certified Solutions Architect
8 2 (0.53%) CCNA
8 2 (0.53%) Cisco Certification
9 1 (0.27%) (ISC)2 CCSP
9 1 (0.27%) CCSP
9 1 (0.27%) CISSP
9 1 (0.27%) CRISC
9 1 (0.27%) CWNA
9 1 (0.27%) ISEB
9 1 (0.27%) Master's Degree
Quality Assurance & Compliance
1 30 (7.98%) Data Quality
2 8 (2.13%) Accessibility
2 8 (2.13%) QA
3 5 (1.33%) IFRS
4 4 (1.06%) PMO
5 2 (0.53%) GAAP
6 1 (0.27%) COBIT
6 1 (0.27%) DO-254
6 1 (0.27%) ISO 31000
6 1 (0.27%) ISO/IEC 27001
System Software
1 31 (8.24%) Docker
2 12 (3.19%) Virtual Machines
3 7 (1.86%) VMware Infrastructure
3 7 (1.86%) VMware NSX
4 6 (1.60%) Active Directory
5 4 (1.06%) Virtual Desktop
6 3 (0.80%) SRDF
7 2 (0.53%) Firmware
8 1 (0.27%) HDFS
Systems Management
1 33 (8.78%) Terraform
2 30 (7.98%) Kubernetes
3 18 (4.79%) HP Quality Center
4 15 (3.99%) Ansible
5 7 (1.86%) FortiGate
5 7 (1.86%) Progress Chef
5 7 (1.86%) Puppet
6 5 (1.33%) Fortio
6 5 (1.33%) Istio
6 5 (1.33%) Kiali
6 5 (1.33%) Microsoft Intune
6 5 (1.33%) SysTrack
7 3 (0.80%) SCCM
8 1 (0.27%) Consul
8 1 (0.27%) Grafana
8 1 (0.27%) Graphite
8 1 (0.27%) Packer
8 1 (0.27%) Prometheus
8 1 (0.27%) Single Sign-On
8 1 (0.27%) WMI
Vendors
1 92 (24.47%) SAP
2 68 (18.09%) Microsoft
3 57 (15.16%) Oracle
4 33 (8.78%) Google
5 22 (5.85%) Databricks
5 22 (5.85%) Salesforce
6 20 (5.32%) Qualtrics
7 18 (4.79%) HP
8 13 (3.46%) IBM
8 13 (3.46%) Informatica
8 13 (3.46%) Talend
9 12 (3.19%) MKS
10 9 (2.39%) Hitachi
11 8 (2.13%) Cisco
11 8 (2.13%) MuleSoft
12 7 (1.86%) Dataiku
12 7 (1.86%) F5
12 7 (1.86%) Fortinet
12 7 (1.86%) ServiceNow
12 7 (1.86%) SolarWinds