Data Security Jobs in England

Data Security
UK > England

The following table provides summary statistics for permanent job vacancies advertised in England with a requirement for Data Security skills. Included is a benchmarking guide to the salaries offered in vacancies that have cited Data Security over the 6 months to 24 May 2024 with a comparison to the same period in the previous 2 years.

6 months to
24 May 2024
Same period 2023 Same period 2022
Rank 340 439 449
Rank change year-on-year +99 +10 +4
Permanent jobs citing Data Security 678 571 1,127
As % of all permanent jobs advertised in England 0.77% 0.65% 0.82%
As % of the Processes & Methodologies category 0.91% 0.68% 0.85%
Number of salaries quoted 445 347 522
10th Percentile £32,500 £26,250 £31,025
25th Percentile £44,250 £38,438 £45,750
Median annual salary (50th Percentile) £67,500 £55,500 £57,500
Median % change year-on-year +21.62% -3.48% +21.05%
75th Percentile £87,500 £72,500 £74,688
90th Percentile £100,000 £97,500 £92,500
UK median annual salary £67,000 £55,250 £57,500
% change year-on-year +21.27% -3.91% +21.05%

All Process and Methodology Skills
England

Data Security is in the Processes and Methodologies category. The following table is for comparison with the above and provides summary statistics for all permanent job vacancies advertised in England with a requirement for process or methodology skills.

Permanent vacancies with a requirement for process or methodology skills 74,116 83,365 132,167
As % of all permanent jobs advertised in England 84.52% 95.60% 95.90%
Number of salaries quoted 54,232 49,528 73,258
10th Percentile £29,000 £34,452 £33,326
25th Percentile £40,000 £46,125 £44,000
Median annual salary (50th Percentile) £55,000 £62,500 £60,000
Median % change year-on-year -12.00% +4.17% +9.09%
75th Percentile £72,500 £82,500 £80,000
90th Percentile £93,750 £102,500 £97,500
UK median annual salary £55,000 £61,000 £60,000
% change year-on-year -9.84% +1.67% +9.09%

Data Security
Job Vacancy Trend in England

Job postings citing Data Security as a proportion of all IT jobs advertised in England.
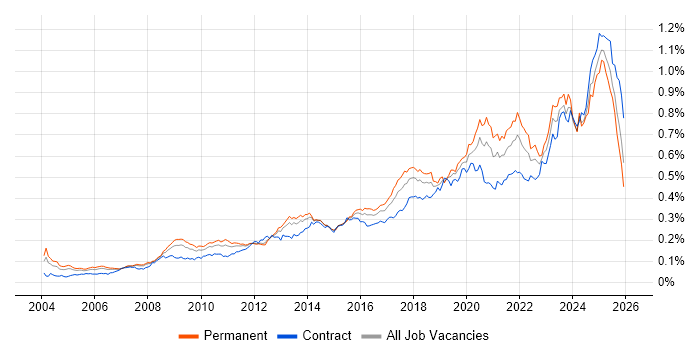
Job vacancy trend for Data Security in England

Data Security
Salary Trend in England

3-month moving average salary quoted in jobs citing Data Security in England.

Salary trend for Data Security in England

Data Security
Salary Histogram in England

Salary distribution for jobs citing Data Security in England over the 6 months to 24 May 2024.

Salary histogram for Data Security in England

Data Security
Job Locations in England

The table below looks at the demand and provides a guide to the median salaries quoted in IT jobs citing Data Security within the England region over the 6 months to 24 May 2024. The 'Rank Change' column provides an indication of the change in demand within each location based on the same 6 month period last year.

Location Rank Change
on Same Period
Last Year
Matching
Permanent
IT Job Ads
Median Salary
Past 6 Months
Median Salary
% Change
on Same Period
Last Year
Live
Jobs
London +24 203 £75,000 +15.38% 102
South East +88 133 £75,000 +53.85% 56
North of England +102 132 £46,250 -15.91% 50
Midlands +55 113 £57,500 +7.98% 35
West Midlands +57 80 £65,000 +22.07% 14
North West +34 75 £50,000 +2.56% 27
South West -51 47 £40,000 +45.45% 11
Yorkshire +95 42 £45,000 -24.40% 20
East Midlands +11 28 £55,000 -13.73% 20
East of England +27 25 £60,000 - 19
North East +7 15 £42,000 -4.55% 4
Data Security
UK

Data Security
Co-occurring Skills and Capabilities in England by Category

The follow tables expand on the table above by listing co-occurrences grouped by category. The same employment type, locality and period is covered with up to 20 co-occurrences shown in each of the following categories:

Application Platforms
1 29 (4.28%) Apache
2 28 (4.13%) SharePoint
3 24 (3.54%) IIS
3 24 (3.54%) Tomcat
4 20 (2.95%) Microsoft Exchange
5 12 (1.77%) WordPress
6 6 (0.88%) Apache Spark
7 5 (0.74%) WebLogic
8 4 (0.59%) CMS
8 4 (0.59%) Umbraco
9 3 (0.44%) Apache Airflow
10 2 (0.29%) Confluence
10 2 (0.29%) Exchange Server 2003
10 2 (0.29%) Exchange Server 2007
10 2 (0.29%) Exchange Server 2010
10 2 (0.29%) Exchange Server 2013
10 2 (0.29%) Moodle
10 2 (0.29%) SAS
11 1 (0.15%) Drupal
Applications
1 41 (6.05%) Microsoft Office
2 34 (5.01%) Microsoft Excel
3 3 (0.44%) Spreadsheet
4 1 (0.15%) Microsoft PowerPoint
4 1 (0.15%) MS Visio
Business Applications
1 27 (3.98%) NEC Housing
2 10 (1.47%) Dynamics CRM
3 5 (0.74%) NetSuite
4 2 (0.29%) Shopify
5 1 (0.15%) iTrent
5 1 (0.15%) Salesforce CRM
5 1 (0.15%) SAP S/4HANA
5 1 (0.15%) Workday HCM
Cloud Services
1 317 (46.76%) Azure
2 216 (31.86%) AWS
3 146 (21.53%) GCP
4 84 (12.39%) Microsoft 365
5 67 (9.88%) Power Platform
6 54 (7.96%) SaaS
7 25 (3.69%) Entra ID
8 21 (3.10%) Cloud Computing
8 21 (3.10%) Dynamics 365
9 20 (2.95%) PowerApps
10 19 (2.80%) PaaS
11 18 (2.65%) Azure DevOps
11 18 (2.65%) IaaS
12 16 (2.36%) OneDrive
12 16 (2.36%) Serverless
13 12 (1.77%) Matillion
13 12 (1.77%) Snowflake
14 9 (1.33%) Azure Data Factory
14 9 (1.33%) Google Drive
14 9 (1.33%) Microsoft Purview
Communications & Networking
1 58 (8.55%) Firewall
2 30 (4.42%) Network Security
3 26 (3.83%) VPN
4 24 (3.54%) DHCP
4 24 (3.54%) DNS
5 19 (2.80%) Wi-Fi
6 16 (2.36%) WAN
7 14 (2.06%) LAN
8 10 (1.47%) Intrusion Detection
9 9 (1.33%) Internet
9 9 (1.33%) VLAN
10 7 (1.03%) IPsec
11 6 (0.88%) Wireshark
12 5 (0.74%) Wireless
13 4 (0.59%) Ethernet
13 4 (0.59%) IP Telephony
13 4 (0.59%) VoIP
14 3 (0.44%) TCP/IP
15 2 (0.29%) NAS
15 2 (0.29%) WLAN
Database & Business Intelligence
1 144 (21.24%) Data Warehouse
2 115 (16.96%) BigQuery
3 113 (16.67%) Looker
4 63 (9.29%) Power BI
5 60 (8.85%) SQL Server
6 31 (4.57%) Oracle Database
7 27 (3.98%) Metadata
8 24 (3.54%) Data Lake
9 17 (2.51%) Relational Database
10 16 (2.36%) SQL Server Integration Services
11 13 (1.92%) PostgreSQL
12 12 (1.77%) SQL Server Reporting Services
13 8 (1.18%) MySQL
14 6 (0.88%) Azure SQL Database
14 6 (0.88%) Big Data
14 6 (0.88%) GIS
15 5 (0.74%) Amazon Redshift
15 5 (0.74%) Azure SQL Data Warehouse
15 5 (0.74%) NoSQL
16 4 (0.59%) MongoDB
Development Applications
1 17 (2.51%) Git
2 8 (1.18%) Jenkins
3 7 (1.03%) JIRA
4 6 (0.88%) Visual Studio
5 4 (0.59%) ESLint
5 4 (0.59%) IntelliJ
5 4 (0.59%) Team Foundation Server
6 2 (0.29%) GitLab
6 2 (0.29%) Snyk
6 2 (0.29%) SonarQube
7 1 (0.15%) CircleCI
7 1 (0.15%) Cypress.io
7 1 (0.15%) JUnit
7 1 (0.15%) MLflow
General
1 216 (31.86%) Analytical Skills
2 168 (24.78%) Social Skills
3 135 (19.91%) Finance
4 46 (6.78%) Inclusion and Diversity
5 40 (5.90%) Legal
5 40 (5.90%) Public Sector
6 32 (4.72%) Local Government
7 27 (3.98%) Marketing
7 27 (3.98%) Police
8 25 (3.69%) Law
9 23 (3.39%) Retail
10 18 (2.65%) Organisational Skills
11 16 (2.36%) Banking
12 13 (1.92%) Presentation Skills
13 10 (1.47%) Influencing Skills
14 9 (1.33%) Back Office
15 7 (1.03%) Billing
15 7 (1.03%) Documentation Skills
15 7 (1.03%) Telecoms
16 5 (0.74%) Manufacturing
Job Titles
1 216 (31.86%) Architect
2 142 (20.94%) Data Architect
3 64 (9.44%) Analyst
3 64 (9.44%) Senior
4 49 (7.23%) Lead
5 33 (4.87%) Data Engineer
5 33 (4.87%) Security Analyst
6 32 (4.72%) Developer
7 26 (3.83%) IT Manager
8 24 (3.54%) Administrator
8 24 (3.54%) Applications Support
9 23 (3.39%) Security Engineer
10 21 (3.10%) Enterprise Architect
11 19 (2.80%) Security Architect
11 19 (2.80%) Security Manager
11 19 (2.80%) Solutions Architect
12 18 (2.65%) DBA
13 16 (2.36%) Data Manager
13 16 (2.36%) Technical Analyst
14 15 (2.21%) Cybersecurity Architect
Libraries, Frameworks & Software Standards
1 33 (4.87%) Web Services
2 22 (3.24%) .NET
3 12 (1.77%) React
4 11 (1.62%) .NET Framework
4 11 (1.62%) Entity Framework
4 11 (1.62%) RESTful
5 10 (1.47%) Kafka
6 9 (1.33%) .NET Core
6 9 (1.33%) REST
7 8 (1.18%) ASP.NET
7 8 (1.18%) HTML
7 8 (1.18%) Middleware
8 7 (1.03%) CSS
8 7 (1.03%) Lightning Web Components
8 7 (1.03%) Visualforce
9 6 (0.88%) Blazor
10 5 (0.74%) ASP.NET Web API
10 5 (0.74%) Jest
10 5 (0.74%) Node.js
10 5 (0.74%) SOAP
Miscellaneous
1 124 (18.29%) Self-Motivation
2 99 (14.60%) Management Information System
3 50 (7.37%) Public Cloud
4 32 (4.72%) Security Posture
5 26 (3.83%) Cyber Threat
6 19 (2.80%) Product Ownership
7 18 (2.65%) Algorithms
8 17 (2.51%) Cloud Native
8 17 (2.51%) Onboarding
9 15 (2.21%) Legacy Systems
10 14 (2.06%) Hybrid Cloud
11 11 (1.62%) Data Centre
12 10 (1.47%) Cloud Security Posture
12 10 (1.47%) PKI
13 9 (1.33%) Housing Association
14 8 (1.18%) NHS
15 7 (1.03%) Data Protection Act
15 7 (1.03%) Driving Licence
15 7 (1.03%) Enterprise Software
16 6 (0.88%) Blog
Operating Systems
1 101 (14.90%) Windows
2 48 (7.08%) Linux
3 31 (4.57%) Unix
4 28 (4.13%) Solaris
5 26 (3.83%) Windows Server
6 12 (1.77%) Mac OS
7 11 (1.62%) Windows 10
8 9 (1.33%) Android
8 9 (1.33%) Apple iOS
9 5 (0.74%) CentOS
9 5 (0.74%) Kali Linux
9 5 (0.74%) Ubuntu
10 4 (0.59%) DC/OS
10 4 (0.59%) Mac OS X
10 4 (0.59%) zOS
11 2 (0.29%) VMS
11 2 (0.29%) Windows 8
11 2 (0.29%) Windows Server 2003
11 2 (0.29%) Windows Server 2008
12 1 (0.15%) Windows Server 2019
Processes & Methodologies
1 264 (38.94%) Problem-Solving
2 188 (27.73%) ETL
3 187 (27.58%) Data Governance
4 179 (26.40%) Data Modelling
5 173 (25.52%) Mentoring
6 146 (21.53%) Data Architecture
7 145 (21.39%) Cybersecurity
8 140 (20.65%) Data Integration
9 133 (19.62%) Data Engineering
10 119 (17.55%) Innovative Thinking
11 116 (17.11%) Platform Engineering
12 112 (16.52%) Information Security
13 111 (16.37%) ERD
14 101 (14.90%) Computer Science
15 91 (13.42%) Data Protection
16 79 (11.65%) Agile
17 75 (11.06%) Data Management
18 74 (10.91%) Analytics
19 72 (10.62%) Business Intelligence
20 70 (10.32%) Project Management
Programming Languages
1 89 (13.13%) SQL
2 52 (7.67%) Python
3 33 (4.87%) PowerShell
4 30 (4.42%) T-SQL
5 27 (3.98%) Shell Script
6 21 (3.10%) C#
7 17 (2.51%) Java
8 14 (2.06%) Scala
9 8 (1.18%) JavaScript
9 8 (1.18%) PL/SQL
10 7 (1.03%) Apex Code
10 7 (1.03%) R
10 7 (1.03%) TypeScript
11 6 (0.88%) Bash
11 6 (0.88%) C
12 5 (0.74%) Bicep
13 2 (0.29%) Gremlin
14 1 (0.15%) Data Analysis Expressions
14 1 (0.15%) Kotlin
14 1 (0.15%) Perl
Qualifications
1 183 (26.99%) Degree
2 83 (12.24%) CISSP
3 55 (8.11%) Computer Science Degree
4 52 (7.67%) CISM
5 35 (5.16%) Security Cleared
6 27 (3.98%) CISA
7 25 (3.69%) Azure Certification
8 24 (3.54%) Master's Degree
9 20 (2.95%) Microsoft Certification
10 18 (2.65%) Cisco Certification
10 18 (2.65%) PCI QSA
11 17 (2.51%) CEH
12 12 (1.77%) AWS Certification
12 12 (1.77%) CCSP
13 11 (1.62%) CRISC
14 10 (1.47%) PMI Certification
14 10 (1.47%) PMP
14 10 (1.47%) SANS
15 9 (1.33%) (ISC)2 CCSP
16 8 (1.18%) CCSK
Quality Assurance & Compliance
1 178 (26.25%) GDPR
2 155 (22.86%) Data Quality
3 89 (13.13%) ISO/IEC 27001
4 50 (7.37%) NIST
5 49 (7.23%) PCI DSS
6 42 (6.19%) Cyber Essentials
7 37 (5.46%) Accessibility
8 18 (2.65%) NCSC
9 16 (2.36%) Cyber Essentials PLUS
9 16 (2.36%) ISO/IEC 27002 (supersedes ISO/IEC 17799)
10 12 (1.77%) SOC 2
11 11 (1.62%) GRC
12 7 (1.03%) HIPAA
12 7 (1.03%) QA
13 6 (0.88%) ISO 9001
13 6 (0.88%) NIST 800
14 5 (0.74%) SOC 1
15 4 (0.59%) TickIT
16 3 (0.44%) California Consumer Privacy Act
17 2 (0.29%) Sarbanes-Oxley
System Software
1 66 (9.73%) Active Directory
2 30 (4.42%) Docker
3 12 (1.77%) VMware Infrastructure
4 7 (1.03%) XenApp
4 7 (1.03%) XenDesktop
5 5 (0.74%) Oracle RAC
5 5 (0.74%) Virtual Machines
6 3 (0.44%) Hyper-V
6 3 (0.44%) Virtual Desktop
7 2 (0.29%) Citrix Hypervisor
7 2 (0.29%) Virtual Servers
8 1 (0.15%) Dovecot
8 1 (0.15%) Postfix
Systems Management
1 27 (3.98%) Kubernetes
2 20 (2.95%) Microsoft Intune
3 17 (2.51%) Terraform
4 11 (1.62%) Ansible
4 11 (1.62%) Single Sign-On
5 9 (1.33%) CSIRT
6 6 (0.88%) Active Directory Federation Services
6 6 (0.88%) CASB
6 6 (0.88%) SCCM
7 5 (0.74%) Data Guard
7 5 (0.74%) Oracle RMAN
7 5 (0.74%) PaperCut
7 5 (0.74%) Suricata
8 4 (0.59%) AirWatch
9 3 (0.44%) HP Fortify
10 1 (0.15%) DatAdvantage
10 1 (0.15%) FortiGate
10 1 (0.15%) Progress Chef
10 1 (0.15%) QRadar
10 1 (0.15%) Symantec Endpoint Protection
Vendors
1 193 (28.47%) Microsoft
2 153 (22.57%) Google
3 45 (6.64%) Oracle
4 27 (3.98%) NEC
5 23 (3.39%) Databricks
6 22 (3.24%) VMware
7 19 (2.80%) Cisco
8 12 (1.77%) Qualys
9 11 (1.62%) ServiceNow
9 11 (1.62%) Splunk
10 10 (1.47%) Salesforce
10 10 (1.47%) SAP
10 10 (1.47%) Xero
11 8 (1.18%) Guidewire
11 8 (1.18%) Zscaler
12 7 (1.03%) Citrix
12 7 (1.03%) CyberArk
12 7 (1.03%) WatchGuard
13 6 (0.88%) CA
13 6 (0.88%) Varonis