Actionable Insight Jobs

Actionable Insights (or Actionable Intelligence, Actionable Recommendations)
UK

The table below provides summary statistics for permanent job vacancies requiring Actionable Insight skills. It includes a benchmarking guide to the annual salaries offered in vacancies that cited Actionable Insight over the 6 months leading up to 29 May 2025, comparing them to the same period in the previous two years.

6 months to
29 May 2025
Same period 2024 Same period 2023
Rank 265 57 62
Rank change year-on-year -208 +5 +356
Permanent jobs citing Actionable Insight 654 4,080 4,870
As % of all permanent jobs advertised in the UK 1.19% 3.98% 5.00%
As % of the Processes & Methodologies category 1.27% 4.72% 5.23%
Number of salaries quoted 370 556 262
10th Percentile £36,250 £31,250 £34,723
25th Percentile £42,500 £41,500 £42,500
Median annual salary (50th Percentile) £55,000 £51,250 £56,000
Median % change year-on-year +7.32% -8.48% +1.82%
75th Percentile £72,188 £66,250 £70,000
90th Percentile £95,125 £80,435 £87,419
UK excluding London median annual salary £50,000 £48,750 £52,500
% change year-on-year +2.56% -7.14% +5.00%

All Process and Methodology Skills
UK

Actionable Insight falls under the Processes and Methodologies category. For comparison with the information above, the following table provides summary statistics for all permanent job vacancies requiring process or methodology skills.

Permanent vacancies with a requirement for process or methodology skills 51,417 86,448 93,028
As % of all permanent jobs advertised in the UK 93.74% 84.24% 95.56%
Number of salaries quoted 25,323 60,550 54,986
10th Percentile £29,000 £29,250 £34,000
25th Percentile £41,250 £40,000 £45,000
Median annual salary (50th Percentile) £57,500 £55,000 £61,000
Median % change year-on-year +4.55% -9.84% +1.67%
75th Percentile £75,000 £72,500 £81,250
90th Percentile £97,500 £92,500 £100,000
UK excluding London median annual salary £51,564 £50,000 £55,000
% change year-on-year +3.13% -9.09% +4.76%

Actionable Insight
Job Vacancy Trend

Job postings citing Actionable Insight as a proportion of all IT jobs advertised.
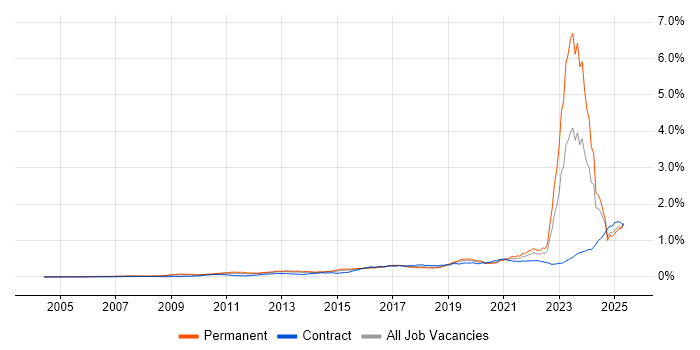
Job vacancy trend for Actionable Insight in the UK

Actionable Insight
Salary Trend

3-month moving average salary quoted in jobs citing Actionable Insight.

Salary trend for Actionable Insight in the UK

Actionable Insight
Salary Histogram

Salary distribution for jobs citing Actionable Insight over the 6 months to 29 May 2025.

Salary histogram for Actionable Insight in the UK

Actionable Insight
Top 17 Job Locations

The table below looks at the demand and provides a guide to the median salaries quoted in IT jobs citing Actionable Insight within the UK over the 6 months to 29 May 2025. The 'Rank Change' column provides an indication of the change in demand within each location based on the same 6 month period last year.

Location Rank Change
on Same Period
Last Year
Matching
Permanent
IT Job Ads
Median Salary
Past 6 Months
Median Salary
% Change
on Same Period
Last Year
Live
Jobs
England -202 568 £57,500 +9.52% 3,829
UK excluding London -232 335 £50,000 +2.56% 3,274
London -101 249 £70,000 +14.29% 1,025
Work from Home -247 212 £50,000 - 2,193
South East -155 98 £50,000 +11.11% 1,041
Midlands -86 79 £47,500 -17.39% 576
North of England -193 79 £51,250 -6.82% 761
West Midlands +12 59 £50,000 -13.04% 320
North West -187 49 £50,000 -16.67% 380
South West -109 35 £57,443 -0.10% 328
Yorkshire -69 27 £60,000 +41.18% 299
Scotland -89 20 £51,250 -0.49% 142
East Midlands -93 19 £39,919 +14.05% 223
East of England +15 16 £72,500 +68.60% 406
Northern Ireland -27 7 £30,000 -14.29% 46
North East +43 3 £51,000 +32.94% 82
Wales -72 1 £50,393 +18.57% 81

Actionable Insight
Co-occurring Skills and Capabilities by Category

The follow tables expand on the table above by listing co-occurrences grouped by category. The same employment type, locality and period is covered with up to 20 co-occurrences shown in each of the following categories:

Application Platforms
1 20 (3.06%) CMS
2 13 (1.99%) Apache Spark
3 10 (1.53%) WordPress
4 6 (0.92%) SharePoint
4 6 (0.92%) Sitecore CMS
5 5 (0.76%) IBM Domino
6 4 (0.61%) Apache Airflow
6 4 (0.61%) SAS
7 3 (0.46%) Confluence
8 2 (0.31%) Apache
8 2 (0.31%) Microsoft Exchange
9 1 (0.15%) Headless CMS
9 1 (0.15%) Jupyter
Applications
1 136 (20.80%) Microsoft Excel
2 18 (2.75%) Microsoft PowerPoint
3 16 (2.45%) Microsoft Office
4 8 (1.22%) Photoshop
5 7 (1.07%) Microsoft Project
6 4 (0.61%) Adobe XD
7 3 (0.46%) MS Visio
7 3 (0.46%) Spreadsheet
8 2 (0.31%) Adobe Creative Suite
8 2 (0.31%) Sketch
8 2 (0.31%) Trello
9 1 (0.15%) SPSS
Business Applications
1 5 (0.76%) Dynamics GP
2 4 (0.61%) NetSuite
3 3 (0.46%) Raiser’s Edge
4 2 (0.31%) Dynamics CRM
5 1 (0.15%) Dynamics NAV
5 1 (0.15%) iTrent
5 1 (0.15%) Oracle ERP
5 1 (0.15%) Oracle SCM
5 1 (0.15%) Relativity
5 1 (0.15%) Sage 200
5 1 (0.15%) Salesforce CRM
5 1 (0.15%) SAP BPC
5 1 (0.15%) Sparx Enterprise Architect
Cloud Services
1 217 (33.18%) Power Platform
2 124 (18.96%) Azure
3 71 (10.86%) Google Analytics
4 62 (9.48%) AWS
5 30 (4.59%) GCP
6 26 (3.98%) Azure Data Factory
7 25 (3.82%) Google Ads
8 24 (3.67%) Azure Synapse Analytics
9 23 (3.52%) Snowflake
10 20 (3.06%) Microsoft 365
11 19 (2.91%) SaaS
12 15 (2.29%) Dynamics 365
13 14 (2.14%) dbt
14 11 (1.68%) Serverless
15 10 (1.53%) Amazon S3
15 10 (1.53%) Google Sheets
16 9 (1.38%) Canva
17 8 (1.22%) GitHub
17 8 (1.22%) Microsoft Advertising
18 7 (1.07%) SuccessFactors
Communications & Networking
1 7 (1.07%) Firewall
2 5 (0.76%) Network Security
3 4 (0.61%) Bluetooth
3 4 (0.61%) HTTP
4 3 (0.46%) Internet
4 3 (0.46%) TCP/IP
4 3 (0.46%) Wireless
5 2 (0.31%) Intranet
5 2 (0.31%) VoIP
5 2 (0.31%) Wi-Fi
6 1 (0.15%) LTE
6 1 (0.15%) VPN
6 1 (0.15%) ZigBee
Database & Business Intelligence
1 217 (33.18%) Power BI
2 88 (13.46%) Tableau
3 48 (7.34%) Data Warehouse
4 41 (6.27%) Data Lake
5 22 (3.36%) BigQuery
5 22 (3.36%) Looker
5 22 (3.36%) Relational Database
6 20 (3.06%) Amazon Redshift
7 14 (2.14%) SQL Server
8 13 (1.99%) Metadata
8 13 (1.99%) Power Query
8 13 (1.99%) SQL Server Reporting Services
9 11 (1.68%) Big Data
9 11 (1.68%) Hadoop
10 9 (1.38%) Data Hub
10 9 (1.38%) SQL Server Integration Services
11 8 (1.22%) NoSQL
12 7 (1.07%) BusinessObjects
12 7 (1.07%) Data Mining
12 7 (1.07%) Snowflake Schema
Development Applications
1 23 (3.52%) Git
2 17 (2.60%) JIRA
3 4 (0.61%) Bazaar
4 3 (0.46%) Burp Suite
4 3 (0.46%) Jenkins
4 3 (0.46%) Metasploit
5 2 (0.31%) Axure RP
5 2 (0.31%) Balsamiq
5 2 (0.31%) GitLab
5 2 (0.31%) Visual Website Optimizer
5 2 (0.31%) WaveMaker
6 1 (0.15%) ER Studio
6 1 (0.15%) ERwin
6 1 (0.15%) MLflow
General
1 331 (50.61%) Social Skills
2 315 (48.17%) Analytical Skills
3 202 (30.89%) Finance
4 159 (24.31%) Marketing
5 70 (10.70%) Law
6 53 (8.10%) Retail
7 42 (6.42%) Advertising
8 37 (5.66%) Inclusion and Diversity
9 31 (4.74%) Influencing Skills
10 30 (4.59%) Banking
11 29 (4.43%) Presentation Skills
12 23 (3.52%) Public Sector
13 22 (3.36%) Legal
14 20 (3.06%) Manufacturing
15 13 (1.99%) Billing
16 12 (1.83%) Organisational Skills
17 10 (1.53%) Documentation Skills
18 9 (1.38%) Games
19 8 (1.22%) Automotive
19 8 (1.22%) Police
Job Titles
1 219 (33.49%) Analyst
2 123 (18.81%) Senior
3 63 (9.63%) Lead
4 54 (8.26%) Data Analyst
5 40 (6.12%) Senior Analyst
6 39 (5.96%) Insight Analyst
7 31 (4.74%) Business Analyst
8 29 (4.43%) Data Scientist
9 28 (4.28%) Data Engineer
10 27 (4.13%) Developer
11 22 (3.36%) Business Intelligence Analyst
12 18 (2.75%) Business Intelligence Developer
12 18 (2.75%) Financial Analyst
12 18 (2.75%) Senior Data Scientist
13 17 (2.60%) Insight Manager
14 16 (2.45%) User Researcher
15 15 (2.29%) IT Manager
16 14 (2.14%) Data Manager
17 13 (1.99%) Senior Business Intelligence Analyst
18 12 (1.83%) Analytics Manager
Libraries, Frameworks & Software Standards
1 26 (3.98%) HTML
2 24 (3.67%) CSS
3 14 (2.14%) Kafka
3 14 (2.14%) scikit-learn
3 14 (2.14%) TensorFlow
4 13 (1.99%) PySpark
5 12 (1.83%) Pandas
6 6 (0.92%) JSON
6 6 (0.92%) XML
7 5 (0.76%) PyTorch
7 5 (0.76%) React
8 4 (0.61%) Django
8 4 (0.61%) Node.js
9 3 (0.46%) .NET
9 3 (0.46%) FastAPI
9 3 (0.46%) NumPy
9 3 (0.46%) WebSockets
10 2 (0.31%) htmx
10 2 (0.31%) Next.js
10 2 (0.31%) Spring Boot
Miscellaneous
1 67 (10.24%) Analytical Mindset
2 36 (5.50%) Social Media
3 28 (4.28%) Management Information System
4 26 (3.98%) Algorithms
5 23 (3.52%) Self-Motivation
6 18 (2.75%) Product Ownership
7 15 (2.29%) Credit Risk
8 13 (1.99%) Cyber Threat
9 11 (1.68%) Digital Media
9 11 (1.68%) FMCG
10 10 (1.53%) Data Structures
10 10 (1.53%) Marketing Technology
11 9 (1.38%) Blog
12 8 (1.22%) BBC
12 8 (1.22%) Robotics
13 7 (1.07%) Derivative
13 7 (1.07%) Legacy Systems
13 7 (1.07%) OTC Derivatives
13 7 (1.07%) Security Posture
14 6 (0.92%) Reinsurance
Operating Systems
1 6 (0.92%) Linux
2 3 (0.46%) Ubuntu
3 2 (0.31%) Windows
Processes & Methodologies
1 336 (51.38%) Analytics
2 270 (41.28%) Decision-Making
3 241 (36.85%) Business Intelligence
4 213 (32.57%) Problem-Solving
5 176 (26.91%) Visualisation
6 145 (22.17%) Data Analysis
7 135 (20.64%) Continuous Improvement
7 135 (20.64%) Data Science
8 116 (17.74%) Data Visualisation
9 114 (17.43%) Agile
9 114 (17.43%) Machine Learning
10 99 (15.14%) Stakeholder Management
11 86 (13.15%) Data-Driven Decision Making
12 84 (12.84%) Artificial Intelligence
13 82 (12.54%) Data Modelling
14 79 (12.08%) Data Analytics
15 74 (11.31%) Data Governance
16 65 (9.94%) ETL
17 59 (9.02%) Roadmaps
18 56 (8.56%) Project Management
Programming Languages
1 204 (31.19%) SQL
2 148 (22.63%) Python
3 41 (6.27%) R
4 30 (4.59%) Data Analysis Expressions
5 13 (1.99%) JavaScript
6 11 (1.68%) T-SQL
7 10 (1.53%) C++
7 10 (1.53%) Java
8 7 (1.07%) C
8 7 (1.07%) VBA
9 5 (0.76%) Bash
10 4 (0.61%) C#
10 4 (0.61%) TypeScript
11 3 (0.46%) Ladder Logic
11 3 (0.46%) PowerShell
12 2 (0.31%) Go
12 2 (0.31%) MATLAB
13 1 (0.15%) Bicep
13 1 (0.15%) Scala
13 1 (0.15%) VC++
Qualifications
1 163 (24.92%) Degree
2 52 (7.95%) DBS Check
3 27 (4.13%) Master's Degree
4 22 (3.36%) Computer Science Degree
5 19 (2.91%) Security Cleared
6 14 (2.14%) ACCA
7 11 (1.68%) SC Cleared
8 10 (1.53%) CIMA
9 9 (1.38%) CREST Certified
9 9 (1.38%) DV Cleared
9 9 (1.38%) Microsoft Certification
10 8 (1.22%) Azure Certification
10 8 (1.22%) CBAP
11 7 (1.07%) AWS Certified Cloud Practitioner
11 7 (1.07%) BPSS Clearance
12 6 (0.92%) IIBA
12 6 (0.92%) ITIL Certification
12 6 (0.92%) ITIL Foundation Certificate
12 6 (0.92%) Numerate Degree
13 4 (0.61%) CISSP
Quality Assurance & Compliance
1 75 (11.47%) Actionable Recommendations
2 62 (9.48%) Data Quality
3 31 (4.74%) Accessibility
3 31 (4.74%) GDPR
4 24 (3.67%) QA
5 7 (1.07%) California Consumer Privacy Act
6 5 (0.76%) ISO/IEC 27001
6 5 (0.76%) PMO
6 5 (0.76%) SLA
7 4 (0.61%) WCAG
8 3 (0.46%) NIST
9 1 (0.15%) COBIT
9 1 (0.15%) GRC
9 1 (0.15%) ISO 22301
9 1 (0.15%) PCI DSS
9 1 (0.15%) Software Quality Assurance
System Software
1 11 (1.68%) Active Directory
2 2 (0.31%) Docker
3 1 (0.15%) zsh
Systems Management
1 5 (0.76%) Terraform
2 3 (0.46%) Grafana
2 3 (0.46%) Kubernetes
2 3 (0.46%) Prometheus
3 2 (0.31%) Nessus
3 2 (0.31%) Nmap
3 2 (0.31%) Systems Management Server (SMS)
4 1 (0.15%) Ansible
4 1 (0.15%) Control-M
4 1 (0.15%) Kibana
4 1 (0.15%) Microsoft Intune
4 1 (0.15%) RSA Archer
Vendors
1 149 (22.78%) Microsoft
2 109 (16.67%) Google
3 40 (6.12%) Salesforce
4 35 (5.35%) Databricks
5 18 (2.75%) Ahrefs
5 18 (2.75%) SAP
6 15 (2.29%) Adobe
7 13 (1.99%) Oracle
7 13 (1.99%) TikTok
8 12 (1.83%) YouTube
9 10 (1.53%) ServiceNow
10 9 (1.38%) JD Edwards
11 8 (1.22%) Instagram
11 8 (1.22%) Mercator
11 8 (1.22%) Screaming Frog
12 6 (0.92%) Alteryx
12 6 (0.92%) Sitecore
12 6 (0.92%) Yahoo!
13 5 (0.76%) Facebook
13 5 (0.76%) Intel