Kanban
UK

The table below provides summary statistics for permanent job vacancies requiring Kanban skills. It includes a benchmarking guide to the annual salaries offered in vacancies that cited Kanban over the 6 months leading up to 11 October 2024, comparing them to the same period in the previous two years.

6 months to
11 Oct 2024
Same period 2023 Same period 2022
Rank 327 277 172
Rank change year-on-year -50 -105 +28
Permanent jobs citing Kanban 638 749 3,394
As % of all permanent jobs advertised in the UK 0.82% 1.24% 2.35%
As % of the Processes & Methodologies category 0.98% 1.31% 2.44%
Number of salaries quoted 318 494 1,413
10th Percentile £42,750 £45,000 £42,500
25th Percentile £50,313 £51,141 £51,250
Median annual salary (50th Percentile) £65,000 £65,000 £62,500
Median % change year-on-year - +4.00% -
75th Percentile £87,500 £82,500 £81,250
90th Percentile £102,500 £95,950 £95,000
UK excluding London median annual salary £60,000 £60,000 £57,500
% change year-on-year - +4.35% +4.55%

All Process and Methodology Skills
UK

Kanban falls under the Processes and Methodologies category. For comparison with the information above, the following table provides summary statistics for all permanent job vacancies requiring process or methodology skills.

Permanent vacancies with a requirement for process or methodology skills 65,317 57,192 139,110
As % of all permanent jobs advertised in the UK 83.49% 94.47% 96.16%
Number of salaries quoted 32,274 40,876 77,262
10th Percentile £33,000 £32,500 £33,950
25th Percentile £43,750 £45,000 £45,000
Median annual salary (50th Percentile) £60,000 £60,000 £60,000
Median % change year-on-year - - +4.35%
75th Percentile £77,500 £80,000 £80,000
90th Percentile £96,250 £97,500 £97,500
UK excluding London median annual salary £52,500 £53,760 £52,500
% change year-on-year -2.34% +2.40% +5.00%

Kanban
Job Vacancy Trend

Job postings citing Kanban as a proportion of all IT jobs advertised.
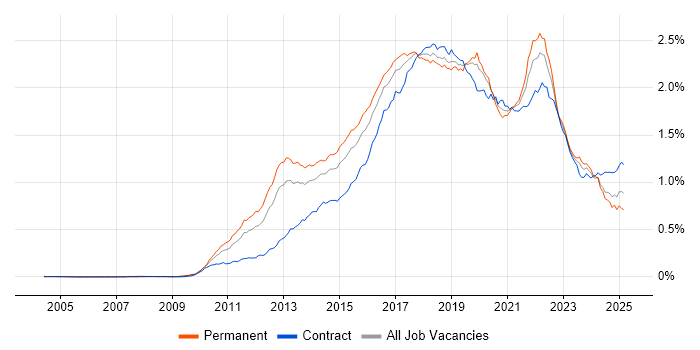
Job vacancy trend for Kanban in the UK

Kanban
Salary Trend

3-month moving average salary quoted in jobs citing Kanban.

Salary trend for Kanban in the UK

Kanban
Salary Histogram

Salary distribution for jobs citing Kanban over the 6 months to 11 October 2024.

Salary histogram for Kanban in the UK

Kanban
Top 17 Job Locations

The table below looks at the demand and provides a guide to the median salaries quoted in IT jobs citing Kanban within the UK over the 6 months to 11 October 2024. The 'Rank Change' column provides an indication of the change in demand within each location based on the same 6 month period last year.

Location Rank Change
on Same Period
Last Year
Matching
Permanent
IT Job Ads
Median Salary
Past 6 Months
Median Salary
% Change
on Same Period
Last Year
Live
Jobs
England -61 545 £62,500 -4.36% 228
UK excluding London -17 442 £60,000 - 146
Work from Home -76 241 £62,500 -3.85% 297
London -55 182 £72,500 -6.45% 90
South East -6 122 £65,000 - 32
North of England -3 110 £51,250 -14.58% 37
North West -14 81 £47,000 -21.67% 22
South West -16 81 £75,000 +20.00% 22
Scotland +13 63 £71,000 +29.09% 4
Midlands -34 33 £60,000 +9.09% 30
Yorkshire +22 28 £55,000 -20.80% 14
West Midlands -15 28 £61,250 +11.36% 18
East of England -48 19 £65,000 - 11
Wales +6 12 £60,000 +20.00% 4
East Midlands -45 5 £51,000 -4.67% 12
Northern Ireland +20 2 - - 7
North East -42 1 £60,000 -7.69% 1

Kanban
Co-occurring Skills and Capabilities by Category

The follow tables expand on the table above by listing co-occurrences grouped by category. The same employment type, locality and period is covered with up to 20 co-occurrences shown in each of the following categories:

Application Platforms
1 35 (5.49%) Confluence
2 23 (3.61%) WebLogic
3 21 (3.29%) Apache
4 14 (2.19%) Apache Spark
5 13 (2.04%) nginx
6 12 (1.88%) SharePoint
7 9 (1.41%) OpenStack
8 8 (1.25%) ArcGIS
9 7 (1.10%) Apache Airflow
9 7 (1.10%) IIS
10 6 (0.94%) CMS
11 4 (0.63%) JBoss
11 4 (0.63%) Red Hat Fuse
12 3 (0.47%) Oracle Workflow
13 2 (0.31%) Microsoft Exchange
14 1 (0.16%) Apache Pulsar
14 1 (0.16%) Oracle SOA Suite
14 1 (0.16%) Sitecore CMS
14 1 (0.16%) Umbraco
14 1 (0.16%) WordPress
Applications
1 12 (1.88%) Microsoft Office
2 9 (1.41%) Microsoft Project
3 7 (1.10%) MadCap Flare
3 7 (1.10%) RoboHelp
4 5 (0.78%) Microsoft Excel
4 5 (0.78%) Trello
5 2 (0.31%) Microsoft PowerPoint
6 1 (0.16%) MS Visio
Business Applications
1 24 (3.76%) Sparx Enterprise Architect
2 8 (1.25%) Maximo
3 3 (0.47%) SAP S/4HANA
4 2 (0.31%) Dynamics CRM
4 2 (0.31%) Shopify
5 1 (0.16%) Magento
5 1 (0.16%) Payment Gateway
5 1 (0.16%) SAP ERP
5 1 (0.16%) SAP SD
5 1 (0.16%) SDL Web 8
Cloud Services
1 226 (35.42%) Azure
2 208 (32.60%) AWS
3 64 (10.03%) GCP
4 55 (8.62%) Amazon EKS
5 40 (6.27%) Azure DevOps
6 37 (5.80%) Serverless
7 27 (4.23%) AWS CloudFormation
8 25 (3.92%) SaaS
9 23 (3.61%) Amazon SQS
10 22 (3.45%) Amazon ECS
11 19 (2.98%) GitHub
12 18 (2.82%) Amazon S3
12 18 (2.82%) AWS Lambda
13 15 (2.35%) Amazon CloudWatch
14 13 (2.04%) OpenShift
14 13 (2.04%) PaaS
15 12 (1.88%) IaaS
15 12 (1.88%) Snowflake
16 11 (1.72%) Entra ID
16 11 (1.72%) MinIO
Communications & Networking
1 50 (7.84%) DNS
2 42 (6.58%) Broadband
3 40 (6.27%) Firewall
4 29 (4.55%) TCP/IP
5 27 (4.23%) Internet
6 26 (4.08%) BGP
7 23 (3.61%) SSL
8 12 (1.88%) VPN
9 8 (1.25%) AMQP
10 5 (0.78%) Cisco ASA
10 5 (0.78%) Cisco IOS
10 5 (0.78%) Network Security
11 4 (0.63%) IPv6
11 4 (0.63%) MPLS
11 4 (0.63%) VLAN
12 3 (0.47%) ASN.1
12 3 (0.47%) EIGRP
12 3 (0.47%) FCoE
12 3 (0.47%) SMS
12 3 (0.47%) Wireless
Database & Business Intelligence
1 68 (10.66%) SQL Server
2 43 (6.74%) NoSQL
3 41 (6.43%) Relational Database
4 29 (4.55%) MongoDB
5 28 (4.39%) RDBMS
6 27 (4.23%) Oracle Database
7 26 (4.08%) Amazon RDS
8 21 (3.29%) PostgreSQL
9 19 (2.98%) Elasticsearch
10 14 (2.19%) Data Warehouse
11 13 (2.04%) Tableau
12 11 (1.72%) Big Data
12 11 (1.72%) MySQL
13 9 (1.41%) SQL Server Integration Services
14 8 (1.25%) Cloudera CDH
14 8 (1.25%) Hadoop
15 7 (1.10%) Amazon Redshift
15 7 (1.10%) Power BI
15 7 (1.10%) SQL Server Reporting Services
16 6 (0.94%) Apache Hive
Development Applications
1 121 (18.97%) JIRA
2 66 (10.34%) Git
3 33 (5.17%) GitLab
4 28 (4.39%) Jenkins
5 16 (2.51%) Visual Studio
6 13 (2.04%) Maven
7 9 (1.41%) Bitbucket
7 9 (1.41%) JUnit
8 8 (1.25%) Mercurial
9 6 (0.94%) JMeter
10 4 (0.63%) Cypress.io
10 4 (0.63%) Mockito
10 4 (0.63%) Selenium
10 4 (0.63%) Team Foundation Server
11 3 (0.47%) CircleCI
11 3 (0.47%) Postman
11 3 (0.47%) Sonatype Nexus
11 3 (0.47%) Visual Studio Team System
12 2 (0.31%) MSTest
12 2 (0.31%) Vagrant
General
1 234 (36.68%) Social Skills
2 103 (16.14%) Finance
3 92 (14.42%) Analytical Skills
4 59 (9.25%) Military
5 40 (6.27%) Public Sector
6 29 (4.55%) Games
7 25 (3.92%) Aerospace
8 23 (3.61%) Banking
8 23 (3.61%) Marketing
8 23 (3.61%) Presentation Skills
9 16 (2.51%) Legal
9 16 (2.51%) Telecoms
10 14 (2.19%) Influencing Skills
10 14 (2.19%) Retail
11 13 (2.04%) Inclusion and Diversity
12 10 (1.57%) Organisational Skills
13 9 (1.41%) Back Office
14 8 (1.25%) Front Office
15 7 (1.10%) Electronics
15 7 (1.10%) Publishing
Job Titles
1 167 (26.18%) Developer
2 137 (21.47%) Architect
3 132 (20.69%) Senior
4 83 (13.01%) Solutions Architect
5 69 (10.82%) Senior Developer
6 67 (10.50%) Software Engineer
7 64 (10.03%) Lead
8 40 (6.27%) .NET Developer
9 36 (5.64%) Analyst
10 27 (4.23%) C# Developer
11 26 (4.08%) Delivery Manager
11 26 (4.08%) Software Architect
12 24 (3.76%) Lead Architect
13 23 (3.61%) DevOps Engineer
13 23 (3.61%) Full-Stack Developer
13 23 (3.61%) Lead Solutions Architect
14 22 (3.45%) Business Analyst
15 21 (3.29%) Technical Architect
16 20 (3.13%) Product Owner
17 19 (2.98%) Data Architect
Libraries, Frameworks & Software Standards
1 98 (15.36%) .NET
2 91 (14.26%) React
3 87 (13.64%) Spring Boot
4 74 (11.60%) Middleware
5 70 (10.97%) Spring
6 68 (10.66%) REST
7 55 (8.62%) AngularJS
8 49 (7.68%) .NET Framework
9 46 (7.21%) Node.js
10 44 (6.90%) CSS
11 41 (6.43%) HTML
12 39 (6.11%) RabbitMQ
13 34 (5.33%) ASP.NET
14 32 (5.02%) .NET Core
14 32 (5.02%) ASP.NET Web API
15 31 (4.86%) OAuth
16 29 (4.55%) Entity Framework
16 29 (4.55%) Web Services
17 25 (3.92%) Vue
18 23 (3.61%) SAML
Miscellaneous
1 69 (10.82%) Product Ownership
2 60 (9.40%) Management Information System
3 46 (7.21%) Cloud Native
4 45 (7.05%) Public Cloud
5 25 (3.92%) Self-Motivation
6 24 (3.76%) Enterprise Software
7 20 (3.13%) Mobile Games
8 14 (2.19%) Distributed Systems
8 14 (2.19%) Private Cloud
9 11 (1.72%) Greenfield Project
10 10 (1.57%) Renewable Energy
10 10 (1.57%) Sports Betting
11 9 (1.41%) Legacy Systems
11 9 (1.41%) Onboarding
12 6 (0.94%) Algorithms
12 6 (0.94%) Analytical Mindset
12 6 (0.94%) BBC
12 6 (0.94%) Blog
12 6 (0.94%) Hybrid Cloud
12 6 (0.94%) Mobile App
Operating Systems
1 133 (20.85%) Linux
2 36 (5.64%) Red Hat Enterprise Linux
3 20 (3.13%) Windows
4 12 (1.88%) Ubuntu
5 10 (1.57%) CentOS
6 8 (1.25%) Debian
7 5 (0.78%) Android
8 4 (0.63%) Apple iOS
8 4 (0.63%) Windows Server 2019
9 3 (0.47%) Solaris
9 3 (0.47%) Unix
10 2 (0.31%) Windows 10
10 2 (0.31%) Windows Server
10 2 (0.31%) Windows Server 2012
10 2 (0.31%) Windows Server 2016
11 1 (0.16%) zOS
Processes & Methodologies
1 608 (95.30%) Agile
2 569 (89.18%) Scrum
3 186 (29.15%) DevOps
4 163 (25.55%) CI/CD
5 131 (20.53%) Software Engineering
6 127 (19.91%) TDD
7 120 (18.81%) Scaled Agile Framework
8 117 (18.34%) Microservices
9 114 (17.87%) Roadmaps
10 112 (17.55%) Continuous Integration
11 109 (17.08%) Problem-Solving
12 102 (15.99%) SDLC
13 99 (15.52%) Stakeholder Management
14 97 (15.20%) Full-Stack Development
15 90 (14.11%) Project Management
16 78 (12.23%) Infrastructure as Code
17 75 (11.76%) Collaborative Working
18 71 (11.13%) Project Delivery
18 71 (11.13%) Test Automation
19 65 (10.19%) Open Source
Programming Languages
1 170 (26.65%) Java
2 121 (18.97%) JavaScript
3 110 (17.24%) Python
3 110 (17.24%) SQL
4 106 (16.61%) C#
5 65 (10.19%) TypeScript
6 55 (8.62%) Kotlin
7 22 (3.45%) Scala
8 19 (2.98%) PowerShell
9 11 (1.72%) PHP
10 5 (0.78%) Shell Script
11 4 (0.63%) Bash
12 3 (0.47%) Data Analysis Expressions
12 3 (0.47%) T-SQL
13 2 (0.31%) Apex Code
13 2 (0.31%) C++
13 2 (0.31%) Go
13 2 (0.31%) Ruby
13 2 (0.31%) Swift
14 1 (0.16%) R
Qualifications
1 182 (28.53%) Security Cleared
2 152 (23.82%) SC Cleared
3 55 (8.62%) Azure Certification
4 53 (8.31%) Degree
5 40 (6.27%) DV Cleared
6 30 (4.70%) AWS Certification
7 29 (4.55%) Computer Science Degree
8 27 (4.23%) AWS Certified Solutions Architect
9 10 (1.57%) PMI Certification
9 10 (1.57%) PMP
10 8 (1.25%) ISTQB
10 8 (1.25%) TOGAF Certification
11 7 (1.10%) ISTQB Foundation Certification
12 6 (0.94%) CBAP
13 5 (0.78%) APMP
13 5 (0.78%) CISSP
14 4 (0.63%) CSPO
14 4 (0.63%) Microsoft Certification
15 3 (0.47%) Master's Degree
15 3 (0.47%) PRINCE2 Practitioner
Quality Assurance & Compliance
1 50 (7.84%) QA
2 10 (1.57%) PMO
3 6 (0.94%) Accessibility
4 5 (0.78%) Data Quality
4 5 (0.78%) ISO/IEC 27001
5 4 (0.63%) ISO 9001
6 3 (0.47%) GDPR
6 3 (0.47%) PCI DSS
7 1 (0.16%) Software Quality Assurance
System Software
1 60 (9.40%) Docker
2 20 (3.13%) Virtual Machines
3 17 (2.66%) Virtual Servers
4 15 (2.35%) Active Directory
5 8 (1.25%) NDS
5 8 (1.25%) NetIQ eDirectory
6 4 (0.63%) VMware ESXi
6 4 (0.63%) VMware Infrastructure
7 2 (0.31%) NFS
7 2 (0.31%) vSphere
8 1 (0.16%) Microsoft App-V
Systems Management
1 87 (13.64%) Kubernetes
2 75 (11.76%) Terraform
3 59 (9.25%) Ansible
4 28 (4.39%) Puppet
5 16 (2.51%) Prometheus
6 15 (2.35%) Grafana
7 13 (2.04%) Single Sign-On
8 11 (1.72%) Istio
8 11 (1.72%) NetIQ Identity Manager
9 10 (1.57%) Progress Chef
10 9 (1.41%) Kibana
11 5 (0.78%) CSIRT
12 4 (0.63%) vCenter Server
13 3 (0.47%) HP ALM
13 3 (0.47%) SCCM
14 2 (0.31%) HAProxy
15 1 (0.16%) Hadoop YARN
15 1 (0.16%) Jamf Pro
15 1 (0.16%) Microsoft Intune
15 1 (0.16%) Packer
Vendors
1 81 (12.70%) Microsoft
2 52 (8.15%) Google
3 50 (7.84%) Oracle
4 24 (3.76%) Sparx
5 18 (2.82%) ForgeRock
6 11 (1.72%) NetIQ
6 11 (1.72%) Red Hat
7 10 (1.57%) Databricks
7 10 (1.57%) VMware
8 9 (1.41%) Splunk
9 8 (1.25%) CyberArk
9 8 (1.25%) ESRI
9 8 (1.25%) IBM
9 8 (1.25%) Novell
9 8 (1.25%) SaltStack
9 8 (1.25%) ServiceNow
10 7 (1.10%) Atlassian
10 7 (1.10%) Dynatrace
10 7 (1.10%) Zscaler
11 6 (0.94%) Cisco