Requirements Analysis
UK

The following table provides summary statistics for permanent job vacancies with a requirement for Requirements Analysis skills. Included is a benchmarking guide to the salaries offered in vacancies that have cited Requirements Analysis over the 6 months to 28 November 2023 with a comparison to the same period in the previous 2 years.

6 months to
28 Nov 2023
Same period 2022 Same period 2021
Rank 379 634 507
Rank change year-on-year +255 -127 +98
Permanent jobs citing Requirements Analysis 403 506 724
As % of all permanent jobs advertised in the UK 0.74% 0.40% 0.56%
As % of the Processes & Methodologies category 0.79% 0.42% 0.59%
Number of salaries quoted 152 253 374
10th Percentile £42,439 £36,250 £39,325
25th Percentile £45,000 £46,750 £46,250
Median annual salary (50th Percentile) £60,000 £60,000 £55,000
Median % change year-on-year - +9.09% +12.24%
75th Percentile £75,000 £73,750 £73,000
90th Percentile £89,041 £85,000 £83,750
UK excluding London median annual salary £60,000 £57,500 £50,000
% change year-on-year +4.35% +15.00% +11.11%

All Process and Methodology Skills
UK

Requirements Analysis is in the Processes and Methodologies category. The following table is for comparison with the above and provides summary statistics for all permanent job vacancies with a requirement for process or methodology skills.

Permanent vacancies with a requirement for process or methodology skills 51,121 120,104 122,523
As % of all permanent jobs advertised in the UK 94.09% 95.72% 95.43%
Number of salaries quoted 36,956 73,203 81,032
10th Percentile £32,500 £34,313 £32,500
25th Percentile £43,750 £45,000 £42,500
Median annual salary (50th Percentile) £60,000 £60,000 £59,000
Median % change year-on-year - +1.69% +7.27%
75th Percentile £80,000 £81,250 £77,500
90th Percentile £98,750 £100,000 £95,000
UK excluding London median annual salary £52,500 £53,000 £50,000
% change year-on-year -0.94% +6.00% +4.17%

Requirements Analysis
Job Vacancy Trend

Job postings citing Requirements Analysis as a proportion of all IT jobs advertised.
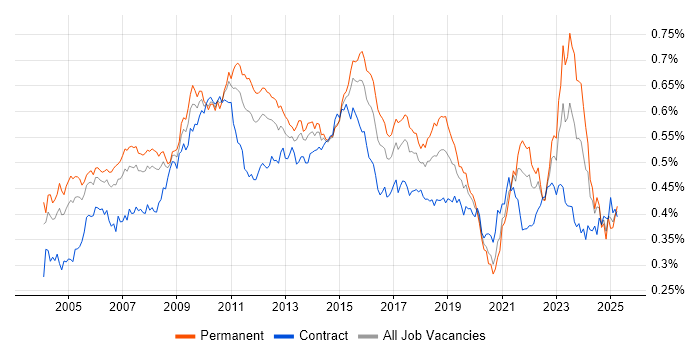
Job vacancy trend for Requirements Analysis in the UK

Requirements Analysis
Salary Trend

3-month moving average salary quoted in jobs citing Requirements Analysis.

Salary trend for Requirements Analysis in the UK

Requirements Analysis
Salary Histogram

Salary distribution for jobs citing Requirements Analysis over the 6 months to 28 November 2023.

Salary histogram for Requirements Analysis in the UK

Requirements Analysis
Top 16 Job Locations

The table below looks at the demand and provides a guide to the median salaries quoted in IT jobs citing Requirements Analysis within the UK over the 6 months to 28 November 2023. The 'Rank Change' column provides an indication of the change in demand within each location based on the same 6 month period last year.

Location Rank Change
on Same Period
Last Year
Matching
Permanent
IT Job Ads
Median Salary
Past 6 Months
Median Salary
% Change
on Same Period
Last Year
Live
Jobs
UK excluding London +235 316 £60,000 +4.35% 94
England +235 302 £60,000 - 107
Work from Home +186 175 £62,500 - 52
South West +86 78 £59,250 +7.73% 23
North of England +151 59 £57,500 +15.00% 11
London +179 55 £65,000 -7.80% 24
South East +128 50 £62,500 +4.17% 25
Midlands +108 41 £60,000 +20.00% 11
North West +123 34 £48,750 -25.00% 10
Scotland +42 34 £50,000 -13.04% 7
Northern Ireland +60 27 £77,500 +27.05% 2
Yorkshire +106 25 £80,000 +139.88% 1
West Midlands +108 22 £50,000 +2.56% 11
East of England +124 19 £67,500 +22.73% 13
East Midlands +36 19 £60,000 +20.00%
Wales +22 12 £60,000 +48.37% 4

Requirements Analysis
Co-occurring Skills and Capabilities by Category

The follow tables expand on the table above by listing co-occurrences grouped by category. The same employment type, locality and period is covered with up to 20 co-occurrences shown in each of the following categories:

Application Platforms
1 6 (1.49%) IIS
2 5 (1.24%) Confluence
Applications
1 9 (2.23%) Microsoft Office
2 7 (1.74%) MS Visio
3 5 (1.24%) Microsoft Excel
3 5 (1.24%) Microsoft PowerPoint
4 3 (0.74%) Simulink
5 1 (0.25%) Spreadsheet
Business Applications
1 4 (0.99%) Dynamics CRM
2 2 (0.50%) Dynamics NAV
2 2 (0.50%) SAP S/4HANA
3 1 (0.25%) SAP CO
3 1 (0.25%) SAP ERP
3 1 (0.25%) SAP FI
3 1 (0.25%) SAP FI/CO
3 1 (0.25%) SAP HCM
3 1 (0.25%) SAP PSCD
Cloud Services
1 166 (41.19%) Azure
2 120 (29.78%) AWS
3 96 (23.82%) GCP
4 41 (10.17%) SaaS
5 40 (9.93%) IaaS
6 36 (8.93%) PaaS
7 9 (2.23%) Amazon EC2
7 9 (2.23%) Amazon S3
8 8 (1.99%) AWS Lambda
8 8 (1.99%) Serverless
9 6 (1.49%) Azure DevOps
10 4 (0.99%) Cloud Computing
10 4 (0.99%) Power Platform
11 3 (0.74%) Azure Sentinel
11 3 (0.74%) Dynamics 365
12 1 (0.25%) Azure AKS
12 1 (0.25%) Azure Data Factory
12 1 (0.25%) Azure Synapse Analytics
12 1 (0.25%) IBM Cloud
12 1 (0.25%) Snowflake
Communications & Networking
1 48 (11.91%) SAN
2 20 (4.96%) 5G
2 20 (4.96%) SD-WAN
2 20 (4.96%) WAN
3 9 (2.23%) Internet
4 5 (1.24%) Ethernet
5 4 (0.99%) DNS
5 4 (0.99%) Firewall
5 4 (0.99%) HTTP
5 4 (0.99%) SMTP
5 4 (0.99%) TCP/IP
6 3 (0.74%) Intrusion Detection
6 3 (0.74%) Network Security
7 2 (0.50%) Multicast
8 1 (0.25%) FlexRay
8 1 (0.25%) VPN
Database & Business Intelligence
1 27 (6.70%) SQL Server
2 10 (2.48%) SQL Server Integration Services
3 9 (2.23%) Amazon RDS
3 9 (2.23%) Data Warehouse
3 9 (2.23%) MySQL
4 8 (1.99%) PostgreSQL
4 8 (1.99%) Relational Database
5 5 (1.24%) Data Lake
5 5 (1.24%) NoSQL
5 5 (1.24%) SQL Server Reporting Services
6 4 (0.99%) Big Data
6 4 (0.99%) Power BI
6 4 (0.99%) SQL Server Analysis Services
7 3 (0.74%) MongoDB
8 2 (0.50%) Amazon QuickSight
8 2 (0.50%) Amazon Redshift
9 1 (0.25%) Ataccama
9 1 (0.25%) BusinessObjects Business Intelligence
9 1 (0.25%) Metabase
9 1 (0.25%) SAP HANA
Development Applications
1 18 (4.47%) GitLab
2 12 (2.98%) Git
3 9 (2.23%) Visual Studio
4 8 (1.99%) JIRA
4 8 (1.99%) Selenium
5 6 (1.49%) TestRail
6 5 (1.24%) FitNesse
6 5 (1.24%) Jenkins
6 5 (1.24%) Octopus Deploy
6 5 (1.24%) SonarQube
6 5 (1.24%) TeamCity
6 5 (1.24%) WebDriver
7 2 (0.50%) NUnit
7 2 (0.50%) Postman
8 1 (0.25%) Balsamiq
8 1 (0.25%) Bitbucket
8 1 (0.25%) Subversion
General
1 115 (28.54%) Finance
2 96 (23.82%) Social Skills
3 91 (22.58%) Telecoms
4 75 (18.61%) Presentation Skills
5 65 (16.13%) Organisational Skills
6 36 (8.93%) Analytical Skills
7 31 (7.69%) Banking
8 28 (6.95%) Retail
9 24 (5.96%) Public Sector
10 23 (5.71%) Aerospace
11 22 (5.46%) Influencing Skills
11 22 (5.46%) Marketing
12 13 (3.23%) Law
13 10 (2.48%) Legal
14 8 (1.99%) Electronics
15 7 (1.74%) Automotive
15 7 (1.74%) Investment Banking
16 4 (0.99%) Front Office
16 4 (0.99%) Police
17 3 (0.74%) Documentation Skills
Job Titles
1 198 (49.13%) Architect
2 111 (27.54%) Solutions Architect
3 89 (22.08%) Enterprise Architect
3 89 (22.08%) Enterprise Solutions Architect
4 65 (16.13%) Senior
5 49 (12.16%) Infrastructure Architect
6 30 (7.44%) Analyst
6 30 (7.44%) Developer
7 27 (6.70%) Software Engineer
8 25 (6.20%) Senior Architect
9 24 (5.96%) Business Analyst
10 23 (5.71%) Project Manager
11 22 (5.46%) Lead
12 20 (4.96%) Capability Manager
12 20 (4.96%) Data Manager
13 18 (4.47%) Cloud Architect
14 13 (3.23%) C++ Software Engineer
14 13 (3.23%) Principal Architect
14 13 (3.23%) Senior Software Architect
14 13 (3.23%) Software Architect
Libraries, Frameworks & Software Standards
1 22 (5.46%) .NET
2 12 (2.98%) .NET Core
3 11 (2.73%) ASP.NET
3 11 (2.73%) React
4 9 (2.23%) .NET Framework
4 9 (2.23%) CSS
4 9 (2.23%) HTML
4 9 (2.23%) JSON
4 9 (2.23%) Web Services
5 8 (1.99%) AngularJS
5 8 (1.99%) REST
5 8 (1.99%) XML
6 7 (1.74%) Entity Framework
7 6 (1.49%) ASP.NET MVC
7 6 (1.49%) ASP.NET Web API
7 6 (1.49%) Oracle Fusion
8 5 (1.24%) ASP.NET MVC 4
8 5 (1.24%) LINQ
8 5 (1.24%) Silverlight
8 5 (1.24%) WCF
Miscellaneous
1 53 (13.15%) Private Cloud
2 49 (12.16%) Virtual Team
3 36 (8.93%) Public Cloud
4 22 (5.46%) Embedded Systems
5 21 (5.21%) Algorithms
6 15 (3.72%) GNSS
7 13 (3.23%) Mali
7 13 (3.23%) Management Information System
8 10 (2.48%) Greenfield Project
8 10 (2.48%) Self-Motivation
9 9 (2.23%) Product Ownership
10 5 (1.24%) Data Centre
10 5 (1.24%) Foreign Exchange (FX)
11 4 (0.99%) Cloud Native
11 4 (0.99%) Distributed Systems
12 3 (0.74%) Augmented Reality
12 3 (0.74%) Equities
12 3 (0.74%) Linux Command Line
12 3 (0.74%) PCIe
12 3 (0.74%) Virtual Reality
Operating Systems
1 82 (20.35%) Linux
2 64 (15.88%) Windows
3 13 (3.23%) Android
4 1 (0.25%) Unix
4 1 (0.25%) Windows Server
Processes & Methodologies
1 276 (68.49%) Agile
2 188 (46.65%) Actionable Insight
3 148 (36.72%) Validation
4 140 (34.74%) TOGAF
5 121 (30.02%) Computer Science
6 114 (28.29%) Cybersecurity
6 114 (28.29%) Software Architecture
7 105 (26.05%) DevOps
8 96 (23.82%) Waterfall
9 93 (23.08%) Mathematics
9 93 (23.08%) Model Validation
10 92 (22.83%) Technical Analysis
11 90 (22.33%) Requirements Management
12 89 (22.08%) Enterprise Architecture
12 89 (22.08%) Network Architecture
12 89 (22.08%) Physics
12 89 (22.08%) Project Management
13 79 (19.60%) Mentoring
14 70 (17.37%) Stakeholder Management
15 62 (15.38%) Business Analysis
Programming Languages
1 46 (11.41%) C++
2 33 (8.19%) SQL
3 31 (7.69%) C#
3 31 (7.69%) Java
3 31 (7.69%) Python
4 23 (5.71%) C
5 13 (3.23%) Bash
5 13 (3.23%) JavaScript
6 12 (2.98%) PowerShell
6 12 (2.98%) T-SQL
7 9 (2.23%) Perl
8 5 (1.24%) XAML
9 4 (0.99%) Data Analysis Expressions
9 4 (0.99%) Go
9 4 (0.99%) PL/SQL
9 4 (0.99%) Ruby
9 4 (0.99%) TypeScript
10 3 (0.74%) Kusto Query Language
11 2 (0.50%) MATLAB
12 1 (0.25%) PHP
Qualifications
1 138 (34.24%) Degree
2 99 (24.57%) Computer Science Degree
3 91 (22.58%) Security Cleared
4 89 (22.08%) TOGAF Certification
5 69 (17.12%) SC Cleared
6 23 (5.71%) DV Cleared
7 9 (2.23%) ISTQB
8 6 (1.49%) ISTQB Foundation Certification
8 6 (1.49%) PRINCE2 Practitioner
9 5 (1.24%) PMP
10 4 (0.99%) Azure Certification
10 4 (0.99%) IIBA
11 3 (0.74%) (ISC)2 CCSP
11 3 (0.74%) CCSP
11 3 (0.74%) Cisco Certification
11 3 (0.74%) CISMP
11 3 (0.74%) CompTIA Security+
11 3 (0.74%) GSEC
11 3 (0.74%) Master's Degree
11 3 (0.74%) SSCP
Quality Assurance & Compliance
1 31 (7.69%) QA
2 18 (4.47%) PMO
3 5 (1.24%) Automotive SPICE
4 4 (0.99%) ISO/IEC 27001
5 3 (0.74%) Cyber Essentials
5 3 (0.74%) PCI DSS
6 2 (0.50%) COBIT
7 1 (0.25%) DO-178B
7 1 (0.25%) ISO 20022
7 1 (0.25%) SLA
7 1 (0.25%) WCAG
System Software
1 16 (3.97%) Firmware
2 13 (3.23%) Embedded Firmware
3 12 (2.98%) Docker
4 6 (1.49%) Active Directory
5 1 (0.25%) Virtual Servers
Systems Management
1 40 (9.93%) Terraform
2 36 (8.93%) Ansible
3 13 (3.23%) Kubernetes
4 5 (1.24%) Control-M
5 4 (0.99%) Progress Chef
5 4 (0.99%) Puppet
6 2 (0.50%) MIIS
7 1 (0.25%) Active Directory Federation Services
Vendors
1 51 (12.66%) Oracle
2 29 (7.20%) Microsoft
3 8 (1.99%) SAP
4 5 (1.24%) ServiceNow
5 4 (0.99%) Computacenter
5 4 (0.99%) Databricks
5 4 (0.99%) Google
6 3 (0.74%) Ariba
6 3 (0.74%) NEC
6 3 (0.74%) TIBCO
7 2 (0.50%) Atlassian
7 2 (0.50%) IBM
7 2 (0.50%) Informatica
8 1 (0.25%) Cadence
8 1 (0.25%) Cisco
8 1 (0.25%) EMC
8 1 (0.25%) Progress
8 1 (0.25%) Talend
8 1 (0.25%) Workday