Security Architect
UK
The median Security Architect salary in the UK is £75,000 per year, according to job vacancies posted during the 6 months leading to 30 April 2025.
The table below provides salary benchmarking and summary statistics, comparing them to the same period in the previous two years.
| 6 months to 30 Apr 2025 |
Same period 2024 | Same period 2023 | |
|---|---|---|---|
| Rank | 504 | 448 | 326 |
| Rank change year-on-year | -56 | -122 | +298 |
| Permanent jobs requiring a Security Architect | 183 | 519 | 1,095 |
| As % of all permanent jobs advertised in the UK | 0.35% | 0.53% | 1.05% |
| As % of the Job Titles category | 0.39% | 0.56% | 1.15% |
| Number of salaries quoted | 90 | 332 | 367 |
| 10th Percentile | £59,231 | £57,500 | £56,219 |
| 25th Percentile | £70,000 | £67,500 | £73,750 |
| Median annual salary (50th Percentile) | £75,000 | £79,842 | £87,500 |
| Median % change year-on-year | -6.06% | -8.75% | -2.78% |
| 75th Percentile | £95,000 | £91,250 | £100,000 |
| 90th Percentile | £112,500 | £108,750 | £111,250 |
| UK excluding London median annual salary | £75,000 | £77,500 | £85,000 |
| % change year-on-year | -3.23% | -8.82% | +9.68% |
All Permanent IT Job Vacancies
UK
For comparison with the information above, the following table provides summary statistics for all permanent IT job vacancies. Most job vacancies include a discernible job title that can be normalized. As such, the figures in the second row provide an indication of the number of permanent jobs in our overall sample.
| Permanent vacancies in the UK with a recognized job title | 46,971 | 93,051 | 95,196 |
| % of permanent jobs with a recognized job title | 90.06% | 94.62% | 91.53% |
| Number of salaries quoted | 27,308 | 66,827 | 59,871 |
| 10th Percentile | £30,000 | £28,500 | £32,500 |
| 25th Percentile | £42,500 | £38,500 | £45,000 |
| Median annual salary (50th Percentile) | £57,500 | £52,750 | £60,000 |
| Median % change year-on-year | +9.00% | -12.08% | - |
| 75th Percentile | £75,000 | £71,250 | £81,250 |
| 90th Percentile | £97,500 | £90,000 | £100,000 |
| UK excluding London median annual salary | £52,344 | £50,000 | £52,500 |
| % change year-on-year | +4.69% | -4.76% | +5.00% |
Security Architect
Job Vacancy Trend
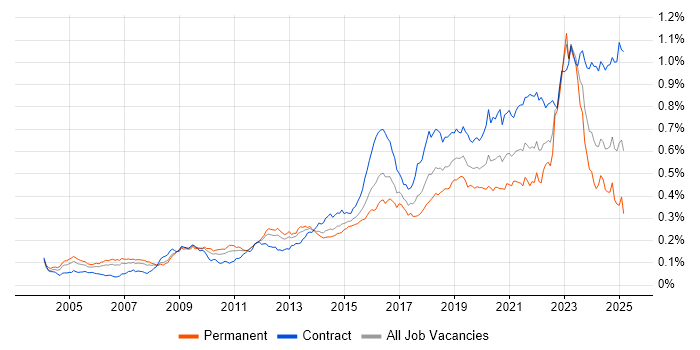
Job postings that featured Security Architect in the job title as a proportion of all IT jobs advertised.

Security Architect
Salary Trend
3-month moving average salary quoted in jobs citing Security Architect.
Security Architect
Salary Histogram
Salary distribution for jobs citing Security Architect over the 6 months to 30 April 2025.
Security Architect
Top 17 Job Locations
The table below looks at the demand and provides a guide to the median salaries quoted in IT jobs citing Security Architect within the UK over the 6 months to 30 April 2025. The 'Rank Change' column provides an indication of the change in demand within each location based on the same 6 month period last year.
| Location | Rank Change on Same Period Last Year |
Matching Permanent IT Job Ads |
Median Salary Past 6 Months |
Median Salary % Change on Same Period Last Year |
Live Jobs |
|---|---|---|---|---|---|
| England | -54 | 148 | £75,000 | -6.06% | 151 |
| UK excluding London | +3 | 123 | £75,000 | -3.23% | 113 |
| London | +30 | 46 | £95,000 | +5.56% | 57 |
| North of England | +30 | 41 | £75,000 | -4.18% | 38 |
| Work from Home | +45 | 37 | £77,500 | -0.99% | 76 |
| North West | -4 | 24 | £75,000 | +7.14% | 26 |
| South East | +42 | 23 | £67,335 | -10.22% | 30 |
| Scotland | +132 | 16 | £84,500 | +12.67% | 5 |
| South West | +74 | 14 | £70,000 | -3.45% | 17 |
| Yorkshire | +56 | 14 | £65,000 | -18.59% | 3 |
| Midlands | +14 | 13 | £95,000 | +26.67% | 11 |
| East of England | +50 | 9 | £74,000 | -4.52% | 4 |
| East Midlands | +31 | 7 | £82,500 | +5.40% | 2 |
| West Midlands | +22 | 6 | £95,000 | +35.71% | 7 |
| Northern Ireland | +37 | 4 | £110,000 | +77.42% | 10 |
| North East | +49 | 3 | £70,000 | -12.33% | 9 |
| Wales | +31 | 3 | - | - | 1 |
Security Architect Skill Set
Top 30 Co-occurring Skills and Capabilities
For the 6 months to 30 April 2025, Security Architect job roles required the following skills and capabilities in order of popularity. The figures indicate the absolute number co-occurrences and as a proportion of all permanent job ads featuring Security Architect in the job title.
|
|
Security Architect Skill Set
Co-occurring Skills and Capabilities by Category
The follow tables expand on the table above by listing co-occurrences grouped by category. The same employment type, locality and period is covered with up to 20 co-occurrences shown in each of the following categories:
|
|
||||||||||||||||||||||||||||||||||||||||||||||||||||||||||||||||||||||||||||||||||||||||||||||||||||||||||||||||||||||||||||||
|
|
||||||||||||||||||||||||||||||||||||||||||||||||||||||||||||||||||||||||||||||||||||||||||||||||||||||||||||||||||||||||||||||
|
|
||||||||||||||||||||||||||||||||||||||||||||||||||||||||||||||||||||||||||||||||||||||||||||||||||||||||||||||||||||||||||||||
|
|
||||||||||||||||||||||||||||||||||||||||||||||||||||||||||||||||||||||||||||||||||||||||||||||||||||||||||||||||||||||||||||||
|
|
||||||||||||||||||||||||||||||||||||||||||||||||||||||||||||||||||||||||||||||||||||||||||||||||||||||||||||||||||||||||||||||
|
|
||||||||||||||||||||||||||||||||||||||||||||||||||||||||||||||||||||||||||||||||||||||||||||||||||||||||||||||||||||||||||||||
|
|
||||||||||||||||||||||||||||||||||||||||||||||||||||||||||||||||||||||||||||||||||||||||||||||||||||||||||||||||||||||||||||||
|
|
||||||||||||||||||||||||||||||||||||||||||||||||||||||||||||||||||||||||||||||||||||||||||||||||||||||||||||||||||||||||||||||
|
|||||||||||||||||||||||||||||||||||||||||||||||||||||||||||||||||||||||||||||||||||||||||||||||||||||||||||||||||||||||||||||||
