Team Leader Jobs with Work from Home Options

Team Lead
UK > Work from Home

The median Team Lead salary in Work from Home is £65,000 per year according to job vacancies posted during the 6 months to 13 May 2024.

The first table below provides salary benchmarking and summary statistics including a comparison to same period in the previous 2 years.

6 months to
13 May 2024
Same period 2023 Same period 2022
Rank 249 335 455
Rank change year-on-year +86 +120 -140
Permanent jobs requiring a Team Leader 426 389 457
As % of all permanent jobs with a WFH option 1.26% 0.94% 0.66%
As % of the Job Titles category 1.32% 0.98% 0.68%
Number of salaries quoted 402 286 337
10th Percentile £39,250 £41,563 £35,810
25th Percentile £50,000 £47,500 £47,500
Median annual salary (50th Percentile) £65,000 £60,000 £65,000
Median % change year-on-year +8.33% -7.69% +8.33%
75th Percentile £85,000 £74,750 £81,250
90th Percentile £142,500 £92,500 £100,000
UK median annual salary £55,000 £57,500 £55,000
% change year-on-year -4.35% +4.55% -4.35%

All Permanent IT Job Vacancies
Work from Home

The following table is for comparison with the above and includes summary statistics for all permanent IT job vacancies with a WFH option. Most job vacancies include a discernible job title that can be normalized. As such, the figures in the second row provide an indication of the number of permanent jobs in our overall sample.

Permanent vacancies in Work from Home with a recognized job title 32,351 39,695 67,533
% of permanent jobs with a recognized job title 95.97% 96.00% 97.37%
Number of salaries quoted 24,813 28,246 42,069
10th Percentile £33,036 £36,750 £36,250
25th Percentile £42,500 £47,447 £45,000
Median annual salary (50th Percentile) £56,318 £62,500 £60,000
Median % change year-on-year -9.89% +4.17% +9.09%
75th Percentile £75,000 £81,250 £80,000
90th Percentile £93,750 £100,000 £95,000
UK median annual salary £52,500 £60,000 £60,000
% change year-on-year -12.50% - +9.09%

Team Leader
Trend for Jobs with a WFH Option

Job vacancies with a work from home option which featured Team Leader in the job title as a proportion of all IT jobs advertised.
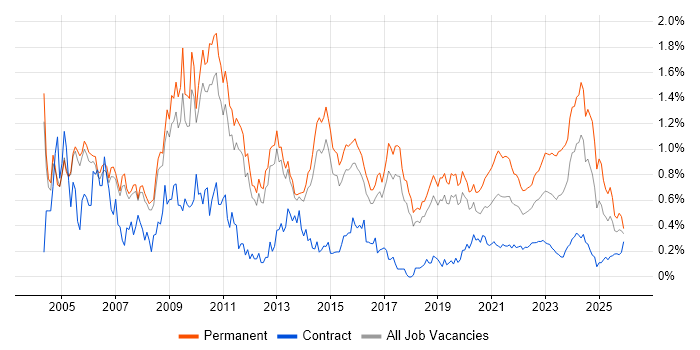
Team Leader trend for jobs with a WFH option

Team Leader
Salary Trend for Jobs with a WFH Option

3-month moving average salary quoted in job vacancies with a work from home option citing Team Leader.

Team Leader salary trend for jobs with a WFH option

Team Leader
Salary Histogram for Jobs with a WFH Option

Salary distribution for jobs with a work from home option citing Team Leader over the 6 months to 13 May 2024.

Team Leader salary histogram for jobs with a WFH option

Team Leader Skill Set
Top 30 Co-occurring Skills and Capabilities in Job Vacancies with WFH Options

For the 6 months to 13 May 2024, Team Leader job roles required the following skills and capabilities in order of popularity. The figures indicate the absolute number co-occurrences and as a proportion of all permanent jobs with remote work options featuring Team Leader in the job title.

1 115 (27.00%) Finance
2 111 (26.06%) Agile
3 109 (25.59%) Social Skills
4 101 (23.71%) AWS
5 99 (23.24%) Python
6 97 (22.77%) Mentoring
7 88 (20.66%) Software Engineering
7 88 (20.66%) Azure
8 87 (20.42%) Microsoft
9 78 (18.31%) Windows
10 76 (17.84%) Java
11 72 (16.90%) Degree
12 69 (16.20%) Microsoft 365
13 66 (15.49%) Banking
14 64 (15.02%) Line Management
15 61 (14.32%) TypeScript
16 58 (13.62%) DevOps
16 58 (13.62%) JavaScript
17 57 (13.38%) Apache Airflow
17 57 (13.38%) dbt
18 54 (12.68%) Asset Management
19 53 (12.44%) Front Office
20 52 (12.21%) Problem-Solving
21 51 (11.97%) Amazon Athena
21 51 (11.97%) Dremio
21 51 (11.97%) Apache Arrow
21 51 (11.97%) Fixed Income
21 51 (11.97%) Equities
21 51 (11.97%) Investment Banking
21 51 (11.97%) Derivative

Team Leader Skill Set
Co-occurring Skills and Capabilities with WFH Options by Category

The follow tables expand on the table above by listing co-occurrences grouped by category. The same employment type, locality and period is covered with up to 20 co-occurrences shown in each of the following categories:

Application Platforms
1 57 (13.38%) Apache Airflow
2 48 (11.27%) Apache
3 24 (5.63%) Microsoft Exchange
4 19 (4.46%) SharePoint
5 10 (2.35%) OpenStack
6 2 (0.47%) ArcGIS
6 2 (0.47%) IIS
7 1 (0.23%) Drupal
Applications
1 28 (6.57%) Microsoft Office
2 8 (1.88%) Simulink
3 3 (0.70%) Microsoft PowerPoint
4 2 (0.47%) Microsoft Excel
5 1 (0.23%) Adobe Creative Suite
5 1 (0.23%) Adobe Illustrator
5 1 (0.23%) InDesign
5 1 (0.23%) Microsoft Project
5 1 (0.23%) Photoshop
Business Applications
1 1 (0.23%) SAP CO
1 1 (0.23%) SAP FI
1 1 (0.23%) SAP FI/CO
1 1 (0.23%) SAP S/4HANA
Cloud Services
1 101 (23.71%) AWS
2 88 (20.66%) Azure
3 69 (16.20%) Microsoft 365
4 57 (13.38%) dbt
5 51 (11.97%) GCP
6 44 (10.33%) Snowflake
7 26 (6.10%) Azure DevOps
8 13 (3.05%) Cloud Computing
9 12 (2.82%) Amazon S3
9 12 (2.82%) Entra ID
10 11 (2.58%) SaaS
11 9 (2.11%) AWS CloudFormation
11 9 (2.11%) Azure Sentinel
11 9 (2.11%) Microsoft Purview
12 7 (1.64%) Serverless
13 6 (1.41%) Amazon Kinesis
13 6 (1.41%) AWS Lambda
13 6 (1.41%) GitHub
13 6 (1.41%) OneDrive
14 5 (1.17%) AWS Elastic Beanstalk
Communications & Networking
1 47 (11.03%) Firewall
2 16 (3.76%) TCP/IP
3 15 (3.52%) VPN
4 14 (3.29%) Intrusion Detection
4 14 (3.29%) LAN
4 14 (3.29%) Network Security
4 14 (3.29%) WAN
5 12 (2.82%) Wireless
6 11 (2.58%) DNS
7 9 (2.11%) Wireshark
8 7 (1.64%) IPsec
8 7 (1.64%) iSCSI
8 7 (1.64%) VLAN
8 7 (1.64%) VoIP
9 6 (1.41%) CTI
9 6 (1.41%) DHCP
10 5 (1.17%) SAN
11 4 (0.94%) OSPF
12 3 (0.70%) Internet
12 3 (0.70%) Wi-Fi
Database & Business Intelligence
1 51 (11.97%) Amazon Athena
1 51 (11.97%) Apache Arrow
1 51 (11.97%) Dremio
2 48 (11.27%) Apache Ignite
3 44 (10.33%) Data Lake
4 27 (6.34%) SQL Server
5 16 (3.76%) PostgreSQL
6 10 (2.35%) NoSQL
7 9 (2.11%) MySQL
8 6 (1.41%) Amazon Redshift
9 5 (1.17%) Couchbase
9 5 (1.17%) DynamoDB
9 5 (1.17%) GIS
9 5 (1.17%) Power BI
9 5 (1.17%) Redis
9 5 (1.17%) SQLite
10 4 (0.94%) Azure SQL Database
10 4 (0.94%) Data Warehouse
11 3 (0.70%) Oracle Database
11 3 (0.70%) Relational Database
Development Applications
1 11 (2.58%) Visual Studio
2 8 (1.88%) Git
3 6 (1.41%) Jenkins
3 6 (1.41%) Subversion
3 6 (1.41%) Team Foundation Server
4 5 (1.17%) Eclipse
5 4 (0.94%) JIRA
6 3 (0.70%) LabVIEW
6 3 (0.70%) Oracle Forms
7 1 (0.23%) Dreamweaver
7 1 (0.23%) eggPlant
7 1 (0.23%) GitLab
7 1 (0.23%) IntelliJ
7 1 (0.23%) JUnit
7 1 (0.23%) Octopus Deploy
7 1 (0.23%) Phabricator
7 1 (0.23%) TeamCity
General
1 115 (27.00%) Finance
2 109 (25.59%) Social Skills
3 66 (15.49%) Banking
4 53 (12.44%) Front Office
5 51 (11.97%) Investment Banking
6 36 (8.45%) Telecoms
7 18 (4.23%) Law
7 18 (4.23%) Retail
8 16 (3.76%) Games
9 10 (2.35%) Documentation Skills
9 10 (2.35%) Marketing
9 10 (2.35%) Public Sector
10 9 (2.11%) Police
11 8 (1.88%) Electronics
12 7 (1.64%) Legal
12 7 (1.64%) Manufacturing
13 6 (1.41%) Analytical Skills
14 5 (1.17%) Inclusion and Diversity
14 5 (1.17%) Local Government
14 5 (1.17%) Organisational Skills
Libraries, Frameworks & Software Standards
1 51 (11.97%) gRPC
1 51 (11.97%) Protocol Buffers
2 48 (11.27%) NumPy
2 48 (11.27%) Pandas
2 48 (11.27%) SciPy
3 31 (7.28%) .NET
4 13 (3.05%) React
5 8 (1.88%) HTML
6 6 (1.41%) Spring
7 5 (1.17%) OAuth
7 5 (1.17%) RESTful
8 4 (0.94%) Node.js
9 3 (0.70%) ASP.NET
9 3 (0.70%) ASP.NET Core
9 3 (0.70%) AWS CDK
9 3 (0.70%) PySpark
9 3 (0.70%) Qt
9 3 (0.70%) Redux
10 2 (0.47%) CSS
10 2 (0.47%) Next.js
Miscellaneous
1 51 (11.97%) Derivative
1 51 (11.97%) Equities
1 51 (11.97%) Fixed Income
1 51 (11.97%) Hedge funds
2 48 (11.27%) Foreign Exchange (FX)
3 34 (7.98%) Algorithms
4 17 (3.99%) Client/Server
5 16 (3.76%) Management Information System
6 12 (2.82%) Data Centre
7 9 (2.11%) Blackberry
7 9 (2.11%) BYOD
7 9 (2.11%) Public Cloud
7 9 (2.11%) Security Operations Centre
8 7 (1.64%) Cloud Native
8 7 (1.64%) Online Games
9 5 (1.17%) Replication
9 5 (1.17%) Self-Motivation
10 4 (0.94%) Onboarding
10 4 (0.94%) Private Cloud
11 3 (0.70%) Driving Licence
Operating Systems
1 78 (18.31%) Windows
2 42 (9.86%) Linux
3 24 (5.63%) Windows Server
4 20 (4.69%) Windows 10
5 10 (2.35%) Android
5 10 (2.35%) Apple iOS
6 4 (0.94%) Windows 7
6 4 (0.94%) Windows Server 2019
7 3 (0.70%) Windows Server 2016
8 2 (0.47%) Windows 8
8 2 (0.47%) Windows Server 2012
9 1 (0.23%) Mac OS
Processes & Methodologies
1 111 (26.06%) Agile
2 97 (22.77%) Mentoring
3 88 (20.66%) Software Engineering
4 64 (15.02%) Line Management
5 58 (13.62%) DevOps
6 54 (12.68%) Asset Management
7 52 (12.21%) Problem-Solving
8 44 (10.33%) Cybersecurity
9 43 (10.09%) ITIL
10 37 (8.69%) Investment Management
11 35 (8.22%) Customer Service
12 30 (7.04%) Mathematics
13 29 (6.81%) Cloud Operations
14 28 (6.57%) Project Management
15 26 (6.10%) Stakeholder Management
16 25 (5.87%) Process Improvement
17 24 (5.63%) SIEM
18 23 (5.40%) Computer Science
18 23 (5.40%) Information Security
18 23 (5.40%) Roadmaps
Programming Languages
1 99 (23.24%) Python
2 76 (17.84%) Java
3 61 (14.32%) TypeScript
4 58 (13.62%) JavaScript
5 49 (11.50%) SQL
6 31 (7.28%) C#
7 15 (3.52%) PowerShell
8 11 (2.58%) MATLAB
9 10 (2.35%) C++
10 8 (1.88%) C
10 8 (1.88%) PHP
11 6 (1.41%) T-SQL
12 5 (1.17%) Bash
12 5 (1.17%) Ruby
13 4 (0.94%) Scala
14 3 (0.70%) R
15 2 (0.47%) Embedded C
15 2 (0.47%) Embedded C++
15 2 (0.47%) PL/SQL
16 1 (0.23%) Shell Script
Qualifications
1 72 (16.90%) Degree
2 21 (4.93%) Computer Science Degree
2 21 (4.93%) Security Cleared
3 15 (3.52%) CREST Certified
4 11 (2.58%) ITIL Foundation Certificate
5 10 (2.35%) Microsoft Certification
6 9 (2.11%) (ISC)2 CCSP
6 9 (2.11%) CCSP
6 9 (2.11%) CEH
6 9 (2.11%) Cisco Certification
6 9 (2.11%) CISSP
6 9 (2.11%) SANS
6 9 (2.11%) SSCP
7 8 (1.88%) BPSS Clearance
7 8 (1.88%) SC Cleared
8 5 (1.17%) MCSE
9 4 (0.94%) ITIL Certification
9 4 (0.94%) OSCP
10 3 (0.70%) CHECK Team Leader
10 3 (0.70%) DV Cleared
Quality Assurance & Compliance
1 18 (4.23%) SLA
2 17 (3.99%) QA
3 16 (3.76%) ISO/IEC 27001
4 11 (2.58%) PCI DSS
5 9 (2.11%) NIST
6 6 (1.41%) Data Quality
7 4 (0.94%) ISO 9001
8 2 (0.47%) Automotive SPICE
8 2 (0.47%) GDPR
System Software
1 39 (9.15%) Active Directory
2 22 (5.16%) VMware Infrastructure
3 19 (4.46%) Docker
4 10 (2.35%) Virtual Desktop
5 7 (1.64%) VMware ESXi
6 4 (0.94%) Virtual Machines
7 3 (0.70%) Firmware
8 2 (0.47%) Hyper-V
8 2 (0.47%) XenDesktop
9 1 (0.23%) KVM
Systems Management
1 24 (5.63%) Microsoft Intune
2 20 (4.69%) Kubernetes
3 16 (3.76%) Ansible
4 15 (3.52%) SCCM
5 14 (3.29%) Terraform
6 10 (2.35%) Puppet
6 10 (2.35%) ZABBIX
7 9 (2.11%) Nmap
8 8 (1.88%) vCenter Server
9 4 (0.94%) Single Sign-On
9 4 (0.94%) WSUS
10 2 (0.47%) Autotask
10 2 (0.47%) Microsoft Clustering
10 2 (0.47%) Packer
11 1 (0.23%) Grafana
11 1 (0.23%) Podman
Vendors
1 87 (20.42%) Microsoft
2 31 (7.28%) VMware
3 10 (2.35%) Qualys
4 9 (2.11%) Rapid7
4 9 (2.11%) Splunk
4 9 (2.11%) Thycotic
5 8 (1.88%) Oracle
6 7 (1.64%) Cisco
6 7 (1.64%) SAP
6 7 (1.64%) ServiceNow
7 4 (0.94%) Aderant
7 4 (0.94%) Commvault
7 4 (0.94%) iManage
7 4 (0.94%) Intapp
7 4 (0.94%) Meraki
7 4 (0.94%) Sun
8 3 (0.70%) Citrix
8 3 (0.70%) Civica
8 3 (0.70%) Juniper
8 3 (0.70%) Sage