Project Planning Jobs with Hybrid/Remote/WFH Options

Project Planning
UK > Work from Home

The table below provides summary statistics for permanent remote or hybrid work requiring Project Planning skills. It includes a benchmarking guide to the annual salaries offered in vacancies that cited Project Planning over the 6 months leading up to 3 May 2025, comparing them to the same period in the previous two years.

6 months to
3 May 2025
Same period 2024 Same period 2023
Rank 326 346 296
Rank change year-on-year +20 -50 +183
Permanent jobs citing Project Planning 91 257 459
As % of all permanent jobs with a WFH option 0.60% 0.76% 1.08%
As % of the Processes & Methodologies category 0.64% 0.83% 1.12%
Number of salaries quoted 68 158 218
10th Percentile £39,700 £35,500 £41,829
25th Percentile £45,000 £38,734 £45,300
Median annual salary (50th Percentile) £56,250 £50,000 £56,500
Median % change year-on-year +12.50% -11.50% -5.83%
75th Percentile £68,125 £61,250 £71,875
90th Percentile £80,250 £75,000 £80,000
UK median annual salary £61,967 £50,000 £60,000
% change year-on-year +23.93% -16.67% +4.35%

All Process and Methodology Skills
Work from Home

Project Planning falls under the Processes and Methodologies category. For comparison with the information above, the following table provides summary statistics for all permanent job vacancies with remote or hybrid options requiring process or methodology skills.

Permanent vacancies with a requirement for process or methodology skills 14,134 30,993 40,912
As % of all permanent jobs with a WFH option 93.17% 91.62% 96.10%
Number of salaries quoted 9,780 23,560 28,419
10th Percentile £30,000 £33,750 £37,500
25th Percentile £45,000 £42,500 £47,500
Median annual salary (50th Percentile) £60,000 £57,500 £62,500
Median % change year-on-year +4.35% -8.00% +4.17%
75th Percentile £77,500 £75,000 £82,500
90th Percentile £102,500 £95,000 £100,000
UK median annual salary £57,500 £55,000 £61,500
% change year-on-year +4.55% -10.57% +2.50%

Project Planning
Trend for Jobs with a WFH Option

Job vacancies with remote working options citing Project Planning as a proportion of all IT jobs advertised.
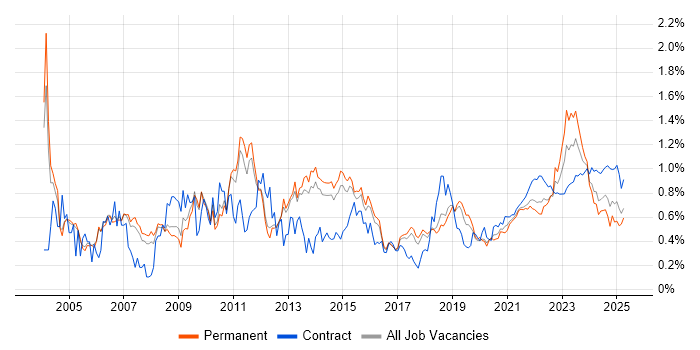
Project Planning trend for jobs with Hybrid/Remote/WFH options

Project Planning
Salary Trend for Jobs with a WFH Option

3-month moving average salary quoted in job vacancies with remote working options citing Project Planning.

Project Planning salary trend for jobs with a WFH option

Project Planning
Salary Histogram for Jobs with a WFH Option

Salary distribution for jobs with remote working options citing Project Planning over the 6 months to 3 May 2025.

Project Planning salary histogram for jobs with a WFH option

Project Planning
Co-occurring Skills and Capabilities with WFH Options by Category

The follow tables expand on the table above by listing co-occurrences grouped by category. The same employment type, locality and period is covered with up to 20 co-occurrences shown in each of the following categories:

Application Platforms
1 7 (7.69%) CMS
1 7 (7.69%) Kentico
2 6 (6.59%) IIS
Applications
1 18 (19.78%) Microsoft Project
2 10 (10.99%) Microsoft Excel
3 8 (8.79%) Microsoft Office
4 5 (5.49%) Microsoft PowerPoint
5 3 (3.30%) MS Visio
5 3 (3.30%) Trello
Business Applications
1 5 (5.49%) Dynamics CRM
2 1 (1.10%) Fidessa
2 1 (1.10%) SAP ERP
2 1 (1.10%) SAP S/4HANA
Cloud Services
1 16 (17.58%) Azure
2 7 (7.69%) Kontent
2 7 (7.69%) Power Platform
3 5 (5.49%) Dynamics 365
3 5 (5.49%) Power Automate
4 4 (4.40%) Asana
4 4 (4.40%) GitHub
4 4 (4.40%) Microsoft Copilot
5 3 (3.30%) Microsoft 365
5 3 (3.30%) Smartsheet
6 2 (2.20%) AWS
6 2 (2.20%) Azure AI
6 2 (2.20%) Azure DevOps
6 2 (2.20%) Azure Synapse Analytics
6 2 (2.20%) Collibra
7 1 (1.10%) GitHub Actions
7 1 (1.10%) Google Workspace
7 1 (1.10%) PowerApps
7 1 (1.10%) SaaS
7 1 (1.10%) SuccessFactors
Communications & Networking
1 2 (2.20%) Network Security
2 1 (1.10%) Firewall
2 1 (1.10%) FIX Connectivity
2 1 (1.10%) GSM
2 1 (1.10%) Intranet
2 1 (1.10%) VoIP
Database & Business Intelligence
1 12 (13.19%) SQL Server
2 6 (6.59%) GIS
2 6 (6.59%) Power BI
3 2 (2.20%) Ataccama
3 2 (2.20%) Azure SQL Database
3 2 (2.20%) BusinessObjects
3 2 (2.20%) Data Lake
3 2 (2.20%) Data Warehouse
3 2 (2.20%) Metadata
3 2 (2.20%) Oracle Database
3 2 (2.20%) PostgreSQL
3 2 (2.20%) SQL Server Integration Services
4 1 (1.10%) SQL Server Reporting Services
4 1 (1.10%) Tableau
Development Applications
1 12 (13.19%) JIRA
2 1 (1.10%) GCC
2 1 (1.10%) gcov
2 1 (1.10%) GDB
2 1 (1.10%) Git
2 1 (1.10%) GitLab
2 1 (1.10%) LSMW
2 1 (1.10%) Visual Studio Code
General
1 47 (51.65%) Social Skills
2 38 (41.76%) Finance
3 25 (27.47%) Analytical Skills
4 19 (20.88%) Banking
5 12 (13.19%) Legal
6 8 (8.79%) Law
7 7 (7.69%) Marketing
8 6 (6.59%) Advertising
8 6 (6.59%) Organisational Skills
8 6 (6.59%) Public Sector
9 4 (4.40%) Manufacturing
10 2 (2.20%) Front Office
10 2 (2.20%) Inclusion and Diversity
10 2 (2.20%) Investment Banking
10 2 (2.20%) Police
11 1 (1.10%) Back Office
11 1 (1.10%) General Ledger
11 1 (1.10%) Presentation Skills
11 1 (1.10%) Tech for Good
11 1 (1.10%) Telecoms
Job Titles
1 37 (40.66%) Project Manager
2 12 (13.19%) Senior
3 11 (12.09%) Technical Manager
4 10 (10.99%) Delivery Manager
4 10 (10.99%) Technical Delivery Manager
5 8 (8.79%) Developer
6 7 (7.69%) Analyst
6 7 (7.69%) Applications Support
6 7 (7.69%) Digital Project Manager
6 7 (7.69%) Web Manager
6 7 (7.69%) Web Project Manager
7 6 (6.59%) Applications Specialist
7 6 (6.59%) Applications Support Specialist
7 6 (6.59%) IT Manager
7 6 (6.59%) Support Specialist
8 5 (5.49%) Architect
8 5 (5.49%) Junior
8 5 (5.49%) Junior Project Manager
8 5 (5.49%) Transformation Manager
8 5 (5.49%) Transformation Project Manager
Libraries, Frameworks & Software Standards
1 5 (5.49%) HTML
2 4 (4.40%) XML
3 3 (3.30%) .NET
3 3 (3.30%) JSON
4 1 (1.10%) .NET Framework
4 1 (1.10%) ADO
4 1 (1.10%) ASP.NET Web API
4 1 (1.10%) Boost C++ Libraries
4 1 (1.10%) CSS
4 1 (1.10%) Django
4 1 (1.10%) FIX Protocol
4 1 (1.10%) GraphQL
4 1 (1.10%) HTML5 Canvas
4 1 (1.10%) React
4 1 (1.10%) REST
4 1 (1.10%) SAP Smart Forms
4 1 (1.10%) Yocto
Miscellaneous
1 9 (9.89%) Product Ownership
2 5 (5.49%) Onboarding
3 3 (3.30%) Analytical Mindset
3 3 (3.30%) Cloud Native
3 3 (3.30%) Data Centre
3 3 (3.30%) Virtual Team
4 2 (2.20%) Data Protection Act
4 2 (2.20%) Management Information System
4 2 (2.20%) Self-Motivation
4 2 (2.20%) Social Media
4 2 (2.20%) Tandem
5 1 (1.10%) Equities
5 1 (1.10%) Equity Derivative
5 1 (1.10%) Linux Command Line
Operating Systems
1 12 (13.19%) Windows
2 7 (7.69%) Windows Server
3 2 (2.20%) Windows Vista
4 1 (1.10%) Linux
4 1 (1.10%) Unix
Processes & Methodologies
1 59 (64.84%) Project Management
2 45 (49.45%) Agile
3 42 (46.15%) Project Delivery
4 34 (37.36%) Problem-Solving
5 23 (25.27%) PRINCE2
6 20 (21.98%) Waterfall
7 18 (19.78%) Business Case
7 18 (19.78%) Stakeholder Management
8 17 (18.68%) Scrum
9 16 (17.58%) Change Management
10 14 (15.38%) Business Strategy
10 14 (15.38%) CRM
11 13 (14.29%) Data Management
11 13 (14.29%) Roadmaps
12 12 (13.19%) Business Intelligence
12 12 (13.19%) Continuous Improvement
12 12 (13.19%) Programme Management
13 10 (10.99%) Budget Management
13 10 (10.99%) Commercial Awareness
14 9 (9.89%) Collaborative Working
Programming Languages
1 7 (7.69%) Python
1 7 (7.69%) SQL
2 6 (6.59%) Java
3 4 (4.40%) VBA
4 3 (3.30%) C#
4 3 (3.30%) C++
5 2 (2.20%) PowerShell
5 2 (2.20%) R
6 1 (1.10%) C
6 1 (1.10%) JavaScript
6 1 (1.10%) SAPscript
6 1 (1.10%) T-SQL
6 1 (1.10%) TypeScript
Qualifications
1 21 (23.08%) Degree
2 14 (15.38%) PMP
3 4 (4.40%) PMI Certification
4 3 (3.30%) DBS Check
4 3 (3.30%) Microsoft Certification
4 3 (3.30%) RIBA
5 2 (2.20%) Azure Certification
5 2 (2.20%) Computer Science Degree
5 2 (2.20%) PRINCE2 Certification
6 1 (1.10%) AWS Certification
6 1 (1.10%) Master's Degree
6 1 (1.10%) NVQ Level 4
6 1 (1.10%) Postgraduate
6 1 (1.10%) PRINCE2 Practitioner
6 1 (1.10%) SAP Certification
6 1 (1.10%) SC Cleared
6 1 (1.10%) Security Cleared
6 1 (1.10%) Six Sigma Black Belt
6 1 (1.10%) Six Sigma Green Belt
Quality Assurance & Compliance
1 9 (9.89%) QA
2 5 (5.49%) Data Quality
2 5 (5.49%) PMO
3 2 (2.20%) Accessibility
4 1 (1.10%) Cyber Essentials
4 1 (1.10%) SLA
System Software
1 2 (2.20%) Docker
2 1 (1.10%) Virtual Servers
Systems Management
1 1 (1.10%) Kubernetes
Vendors
1 33 (36.26%) Microsoft
2 4 (4.40%) Blue Prism
2 4 (4.40%) Google
2 4 (4.40%) UiPath
3 3 (3.30%) SAP
4 2 (2.20%) Oracle
5 1 (1.10%) Ariba
5 1 (1.10%) Bloomberg
5 1 (1.10%) Databricks
5 1 (1.10%) IBM
5 1 (1.10%) NYFIX
5 1 (1.10%) QNX
5 1 (1.10%) Sage
5 1 (1.10%) Sun