Infrastructure Management Jobs in England

Infrastructure Management
UK > England

The table below provides summary statistics for permanent job vacancies advertised in England requiring Infrastructure Management skills. It includes a benchmarking guide to the annual salaries offered in vacancies that cited Infrastructure Management over the 6 months leading up to 31 May 2025, comparing them to the same period in the previous two years.

6 months to
31 May 2025
Same period 2024 Same period 2023
Rank 452 512 279
Rank change year-on-year +60 -233 +569
Permanent jobs citing Infrastructure Management 235 358 1,112
As % of all permanent jobs advertised in England 0.48% 0.40% 1.31%
As % of the Processes & Methodologies category 0.51% 0.47% 1.37%
Number of salaries quoted 176 251 93
10th Percentile £34,750 £32,500 £32,550
25th Percentile £43,938 £47,500 £42,500
Median annual salary (50th Percentile) £55,000 £62,500 £60,000
Median % change year-on-year -12.00% +4.17% -
75th Percentile £76,188 £77,500 £70,000
90th Percentile £91,250 £90,000 £89,750
UK median annual salary £57,500 £57,500 £60,000
% change year-on-year - -4.17% -

All Process and Methodology Skills
England

Infrastructure Management falls under the Processes and Methodologies category. For comparison with the information above, the following table provides summary statistics for all permanent job vacancies requiring process or methodology skills in England.

Permanent vacancies with a requirement for process or methodology skills 46,342 75,409 81,364
As % of all permanent jobs advertised in England 93.97% 83.96% 95.53%
Number of salaries quoted 23,102 54,812 48,959
10th Percentile £29,250 £29,000 £34,452
25th Percentile £41,250 £40,000 £46,000
Median annual salary (50th Percentile) £57,500 £55,000 £62,500
Median % change year-on-year +4.55% -12.00% +4.17%
75th Percentile £75,000 £72,500 £82,500
90th Percentile £97,528 £93,750 £102,500
UK median annual salary £57,000 £55,000 £60,899
% change year-on-year +3.64% -9.69% +1.50%

Infrastructure Management
Job Vacancy Trend in England

Job postings citing Infrastructure Management as a proportion of all IT jobs advertised in England.
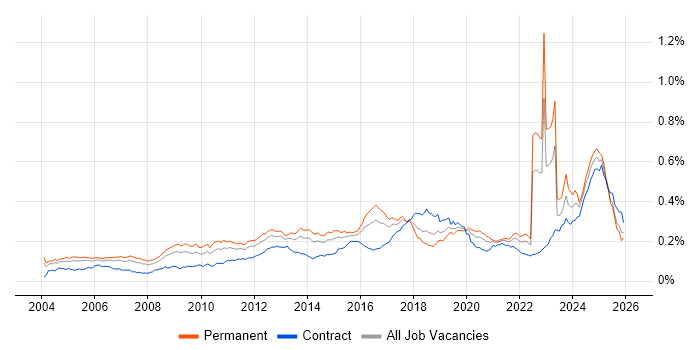
Job vacancy trend for Infrastructure Management in England

Infrastructure Management
Salary Trend in England

3-month moving average salary quoted in jobs citing Infrastructure Management in England.

Salary trend for Infrastructure Management in England

Infrastructure Management
Salary Histogram in England

Salary distribution for jobs citing Infrastructure Management in England over the 6 months to 31 May 2025.

Salary histogram for Infrastructure Management in England

Infrastructure Management
Job Locations in England

The table below looks at the demand and provides a guide to the median salaries quoted in IT jobs citing Infrastructure Management within the England region over the 6 months to 31 May 2025. The 'Rank Change' column provides an indication of the change in demand within each location based on the same 6 month period last year.

Location Rank Change
on Same Period
Last Year
Matching
Permanent
IT Job Ads
Median Salary
Past 6 Months
Median Salary
% Change
on Same Period
Last Year
Live
Jobs
London +74 100 £70,000 -6.67% 79
North of England -15 40 £62,500 +25.00% 22
Midlands +45 32 £50,000 -9.09% 22
West Midlands +62 28 £50,000 +6.95% 11
North West -27 26 £67,500 +28.57% 13
South East +49 24 £55,000 - 27
East of England +51 19 £51,500 -8.44% 19
South West +113 10 £33,750 -46.00% 13
Yorkshire +34 10 £55,000 +10.00% 5
North East +48 4 £62,500 +25.00% 4
East Midlands +17 4 - - 11
Infrastructure Management
UK

Infrastructure Management
Co-occurring Skills and Capabilities in England by Category

The follow tables expand on the table above by listing co-occurrences grouped by category. The same employment type, locality and period is covered with up to 20 co-occurrences shown in each of the following categories:

Application Platforms
1 29 (12.34%) Microsoft Exchange
2 18 (7.66%) SharePoint
3 5 (2.13%) CMS
4 2 (0.85%) Apache
4 2 (0.85%) IIS
5 1 (0.43%) Apache Airflow
5 1 (0.43%) Apache Spark
5 1 (0.43%) CICS
5 1 (0.43%) Confluence
Applications
1 11 (4.68%) Microsoft Office
Business Applications
1 5 (2.13%) Dynamics NAV
2 3 (1.28%) Sage 50
3 1 (0.43%) Sage 200
Cloud Services
1 154 (65.53%) Azure
2 93 (39.57%) Microsoft 365
3 64 (27.23%) AWS
4 44 (18.72%) Entra ID
5 21 (8.94%) GCP
6 19 (8.09%) GitHub
7 11 (4.68%) Power Platform
7 11 (4.68%) Serverless
8 10 (4.26%) Amazon S3
8 10 (4.26%) Azure DevOps
8 10 (4.26%) Google Workspace
8 10 (4.26%) OneDrive
8 10 (4.26%) SaaS
9 9 (3.83%) Amazon EC2
10 8 (3.40%) Cloud Computing
11 7 (2.98%) AWS Lambda
12 6 (2.55%) Amazon EKS
12 6 (2.55%) Azure Sentinel
12 6 (2.55%) Dynamics 365
13 5 (2.13%) GitHub Actions
Communications & Networking
1 72 (30.64%) Firewall
2 32 (13.62%) VLAN
2 32 (13.62%) WAN
3 26 (11.06%) LAN
4 22 (9.36%) DNS
5 19 (8.09%) VPN
6 18 (7.66%) DHCP
7 12 (5.11%) Wi-Fi
7 12 (5.11%) Wireless
8 10 (4.26%) SAN
9 9 (3.83%) TCP/IP
10 7 (2.98%) Internet
10 7 (2.98%) Network Security
10 7 (2.98%) SD-WAN
10 7 (2.98%) SSL
11 5 (2.13%) Wireshark
12 4 (1.70%) HTTPS
12 4 (1.70%) NAS
12 4 (1.70%) Remote Desktop
12 4 (1.70%) VoIP
Database & Business Intelligence
1 10 (4.26%) Amazon RDS
2 6 (2.55%) SQL Server
3 4 (1.70%) Data Lake
3 4 (1.70%) Power BI
4 3 (1.28%) Amazon Redshift
4 3 (1.28%) DynamoDB
5 2 (0.85%) NoSQL
5 2 (0.85%) PostgreSQL
5 2 (0.85%) SQL Server Integration Services
6 1 (0.43%) BigQuery
6 1 (0.43%) Data Warehouse
6 1 (0.43%) DB2
6 1 (0.43%) Delta Lake
6 1 (0.43%) MongoDB
6 1 (0.43%) MySQL
6 1 (0.43%) Tableau
Development Applications
1 14 (5.96%) Git
2 9 (3.83%) Jenkins
3 6 (2.55%) JIRA
4 4 (1.70%) GitLab
5 2 (0.85%) TeamCity
6 1 (0.43%) Artifactory
6 1 (0.43%) Atlassian Bamboo
6 1 (0.43%) Bitbucket
6 1 (0.43%) CircleCI
6 1 (0.43%) Maven
6 1 (0.43%) MLflow
6 1 (0.43%) Octopus Deploy
6 1 (0.43%) Subversion
General
1 89 (37.87%) Social Skills
2 42 (17.87%) Finance
3 29 (12.34%) Analytical Skills
4 13 (5.53%) Law
5 11 (4.68%) Legal
6 9 (3.83%) Inclusion and Diversity
6 9 (3.83%) Manufacturing
7 8 (3.40%) Marketing
8 7 (2.98%) Humanities
8 7 (2.98%) Organisational Skills
9 6 (2.55%) Banking
9 6 (2.55%) Influencing Skills
9 6 (2.55%) Telecoms
10 3 (1.28%) Automotive
10 3 (1.28%) Retail
11 2 (0.85%) Public Sector
12 1 (0.43%) Advertising
12 1 (0.43%) Aviation
12 1 (0.43%) Documentation Skills
12 1 (0.43%) Presentation Skills
Job Titles
1 39 (16.60%) Infrastructure Engineer
2 32 (13.62%) Infrastructure Manager
3 28 (11.91%) IT Manager
4 27 (11.49%) Senior
5 25 (10.64%) Support Engineer
6 23 (9.79%) IT Support
7 20 (8.51%) Cloud Engineer
8 17 (7.23%) 3rd Line Engineer
8 17 (7.23%) 3rd Line Support
8 17 (7.23%) Administrator
9 14 (5.96%) 2nd/3rd Line Support
9 14 (5.96%) 2nd/3rd Line Support Engineer
9 14 (5.96%) 3rd Line Support Engineer
9 14 (5.96%) Azure Engineer
9 14 (5.96%) IT Engineer
9 14 (5.96%) IT Support Manager
10 12 (5.11%) Cloud Infrastructure Engineer
10 12 (5.11%) DevOps Engineer
10 12 (5.11%) Lead
10 12 (5.11%) Systems Administrator
Libraries, Frameworks & Software Standards
1 9 (3.83%) .NET
2 6 (2.55%) CSS
3 5 (2.13%) HTML
4 4 (1.70%) AWS CDK
4 4 (1.70%) SOAP
4 4 (1.70%) Spring
4 4 (1.70%) Spring Boot
5 3 (1.28%) ARM Templates
5 3 (1.28%) Elastic Stack
5 3 (1.28%) Kafka
6 2 (0.85%) JSON
6 2 (0.85%) Laravel
6 2 (0.85%) PySpark
6 2 (0.85%) React
6 2 (0.85%) Vue
6 2 (0.85%) YAML
7 1 (0.43%) ADO
7 1 (0.43%) PyTorch
7 1 (0.43%) Tailwind CSS
7 1 (0.43%) Web Services
Miscellaneous
1 23 (9.79%) Management Information System
2 21 (8.94%) Data Centre
3 19 (8.09%) Cloud Native
4 18 (7.66%) Onboarding
5 8 (3.40%) CMDB
6 7 (2.98%) Enterprise Cloud
6 7 (2.98%) Hybrid Cloud
7 6 (2.55%) Cyber Threat
8 5 (2.13%) Legacy Systems
8 5 (2.13%) Video Conferencing
9 3 (1.28%) Enterprise Software
10 2 (0.85%) Public Cloud
10 2 (0.85%) Self-Motivation
10 2 (0.85%) Social Media
11 1 (0.43%) Algorithms
11 1 (0.43%) Digital Signage
11 1 (0.43%) Distributed Systems
11 1 (0.43%) Industrial Internet of Things
11 1 (0.43%) Operational Technology
11 1 (0.43%) Security Posture
Operating Systems
1 79 (33.62%) Windows
2 61 (25.96%) Windows Server
3 30 (12.77%) Linux
4 24 (10.21%) Windows Server 2019
5 23 (9.79%) Windows Server 2016
6 9 (3.83%) Mac OS
7 7 (2.98%) Red Hat Enterprise Linux
7 7 (2.98%) Windows 10
8 6 (2.55%) Android
8 6 (2.55%) Apple iOS
9 4 (1.70%) Unix
10 3 (1.28%) Ubuntu
10 3 (1.28%) Windows Server 2012
11 2 (0.85%) Debian
11 2 (0.85%) SUSE
11 2 (0.85%) VMS
12 1 (0.43%) zOS
Processes & Methodologies
1 87 (37.02%) Problem-Solving
2 55 (23.40%) DevOps
3 52 (22.13%) Infrastructure as Code
4 51 (21.70%) Disaster Recovery
5 47 (20.00%) CI/CD
5 47 (20.00%) ITIL
5 47 (20.00%) Mentoring
6 41 (17.45%) Continuous Improvement
7 39 (16.60%) Infrastructure Engineering
8 26 (11.06%) Project Management
9 25 (10.64%) Cybersecurity
10 23 (9.79%) Computer Science
10 23 (9.79%) High Availability
10 23 (9.79%) Network Design
11 22 (9.36%) Business Continuity
11 22 (9.36%) Containerisation
12 21 (8.94%) Data Protection
12 21 (8.94%) Risk Management
13 20 (8.51%) Cloud Security
13 20 (8.51%) Performance Optimisation
Programming Languages
1 68 (28.94%) PowerShell
2 43 (18.30%) Python
3 13 (5.53%) Bash
4 12 (5.11%) SQL
5 8 (3.40%) Java
5 8 (3.40%) JavaScript
6 4 (1.70%) Scala
6 4 (1.70%) TypeScript
7 3 (1.28%) PHP
7 3 (1.28%) Ruby
7 3 (1.28%) Shell Script
8 2 (0.85%) Bicep
8 2 (0.85%) Go
9 1 (0.43%) Elixir
9 1 (0.43%) Elm
9 1 (0.43%) Erlang
9 1 (0.43%) F#
9 1 (0.43%) Haskell
9 1 (0.43%) JCL
9 1 (0.43%) PureScript
Qualifications
1 40 (17.02%) Degree
2 30 (12.77%) Microsoft Certification
3 28 (11.91%) Azure Certification
4 21 (8.94%) AWS Certification
5 14 (5.96%) Computer Science Degree
6 11 (4.68%) AWS Certified Solutions Architect
6 11 (4.68%) Cisco Certification
7 10 (4.26%) Security Cleared
8 9 (3.83%) CCNA
9 8 (3.40%) SC Cleared
10 7 (2.98%) Postgraduate
11 5 (2.13%) ITIL Foundation Certificate
12 4 (1.70%) CompTIA Security+
12 4 (1.70%) Network+ Certification
13 3 (1.28%) CISSP
13 3 (1.28%) MCP
13 3 (1.28%) MCSA
13 3 (1.28%) MCSE
14 2 (0.85%) CISA
14 2 (0.85%) DV Cleared
Quality Assurance & Compliance
1 10 (4.26%) ISO/IEC 27001
2 9 (3.83%) Cyber Essentials
3 8 (3.40%) GDPR
4 6 (2.55%) QA
5 4 (1.70%) Data Quality
6 3 (1.28%) NIST
6 3 (1.28%) SLA
7 2 (0.85%) COBIT
7 2 (0.85%) Cyber Essentials PLUS
7 2 (0.85%) PCI DSS
8 1 (0.43%) Accessibility
8 1 (0.43%) ISO 22301
8 1 (0.43%) ISO 9001
System Software
1 82 (34.89%) Active Directory
2 49 (20.85%) VMware Infrastructure
3 23 (9.79%) Docker
4 20 (8.51%) Hyper-V
5 17 (7.23%) Virtual Machines
5 17 (7.23%) XenApp
6 11 (4.68%) vSphere
7 10 (4.26%) VMware ESXi
8 4 (1.70%) Firmware
9 3 (1.28%) Virtual Desktop
10 2 (0.85%) VMware NSX
11 1 (0.43%) pfSense
11 1 (0.43%) Virtual Servers
11 1 (0.43%) VMware Server
Systems Management
1 50 (21.28%) Terraform
2 41 (17.45%) Microsoft Intune
3 35 (14.89%) Kubernetes
4 29 (12.34%) Ansible
5 9 (3.83%) Single Sign-On
6 8 (3.40%) Grafana
6 8 (3.40%) Jamf Pro
7 7 (2.98%) Prometheus
8 5 (2.13%) Progress Chef
9 4 (1.70%) Puppet
9 4 (1.70%) SCCM
10 3 (1.28%) Iperf
11 2 (0.85%) Autotask
11 2 (0.85%) Microsoft Clustering
12 1 (0.43%) Active Directory Federation Services
12 1 (0.43%) Argo
12 1 (0.43%) Dell DRAC
12 1 (0.43%) FortiGate
12 1 (0.43%) Packer
12 1 (0.43%) ZABBIX
Vendors
1 99 (42.13%) Microsoft
2 62 (26.38%) Cisco
3 55 (23.40%) VMware
4 34 (14.47%) Meraki
5 28 (11.91%) SonicWALL
6 22 (9.36%) Citrix
6 22 (9.36%) Google
7 19 (8.09%) CheckPoint
8 18 (7.66%) Fortinet
9 11 (4.68%) ServiceNow
10 9 (3.83%) WatchGuard
11 7 (2.98%) Dell
12 6 (2.55%) HubSpot
12 6 (2.55%) Pure Storage
13 5 (2.13%) Apple
13 5 (2.13%) Veeam
14 4 (1.70%) Databricks
14 4 (1.70%) Red Hat
14 4 (1.70%) Sage
14 4 (1.70%) Samsung