Release Management Jobs in England

Release Management
UK > England

The table below provides summary statistics for permanent job vacancies advertised in England requiring Release Management skills. It includes a benchmarking guide to the annual salaries offered in vacancies that cited Release Management over the 6 months leading up to 12 May 2025, comparing them to the same period in the previous two years.

6 months to
12 May 2025
Same period 2024 Same period 2023
Rank 442 444 379
Rank change year-on-year +2 -65 +50
Permanent jobs citing Release Management 267 446 766
As % of all permanent jobs advertised in England 0.55% 0.52% 0.85%
As % of the Processes & Methodologies category 0.58% 0.61% 0.89%
Number of salaries quoted 157 309 447
10th Percentile £48,750 £35,500 £41,500
25th Percentile £53,688 £52,000 £52,000
Median annual salary (50th Percentile) £64,627 £62,500 £62,500
Median % change year-on-year +3.40% - -
75th Percentile £75,000 £72,500 £77,500
90th Percentile £95,267 £86,250 £90,000
UK median annual salary £64,627 £62,500 £62,500
% change year-on-year +3.40% - +4.17%

All Process and Methodology Skills
England

Release Management falls under the Processes and Methodologies category. For comparison with the information above, the following table provides summary statistics for all permanent job vacancies requiring process or methodology skills in England.

Permanent vacancies with a requirement for process or methodology skills 45,933 73,419 85,900
As % of all permanent jobs advertised in England 94.08% 85.47% 95.62%
Number of salaries quoted 24,038 53,988 50,920
10th Percentile £30,000 £29,000 £34,308
25th Percentile £42,500 £40,000 £46,000
Median annual salary (50th Percentile) £57,500 £55,000 £62,500
Median % change year-on-year +4.55% -12.00% +4.17%
75th Percentile £76,250 £73,500 £82,500
90th Percentile £100,000 £93,750 £101,250
UK median annual salary £57,500 £55,000 £61,000
% change year-on-year +4.55% -9.84% +1.67%

Release Management
Job Vacancy Trend in England

Job postings citing Release Management as a proportion of all IT jobs advertised in England.
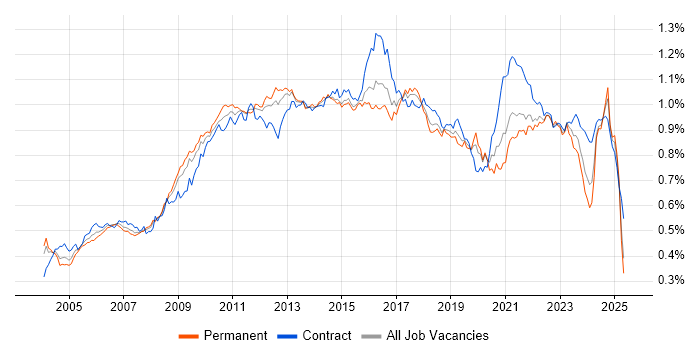
Job vacancy trend for Release Management in England

Release Management
Salary Trend in England

3-month moving average salary quoted in jobs citing Release Management in England.

Salary trend for Release Management in England

Release Management
Salary Histogram in England

Salary distribution for jobs citing Release Management in England over the 6 months to 12 May 2025.

Salary histogram for Release Management in England

Release Management
Job Locations in England

The table below looks at the demand and provides a guide to the median salaries quoted in IT jobs citing Release Management within the England region over the 6 months to 12 May 2025. The 'Rank Change' column provides an indication of the change in demand within each location based on the same 6 month period last year.

Location Rank Change
on Same Period
Last Year
Matching
Permanent
IT Job Ads
Median Salary
Past 6 Months
Median Salary
% Change
on Same Period
Last Year
Live
Jobs
London +115 121 £65,000 - 105
South East +34 40 £60,000 +1.69% 46
Midlands +18 38 £53,688 -14.10% 23
North of England +22 36 £55,000 - 43
West Midlands +26 32 £53,688 -28.42% 16
North West -34 26 £70,000 +27.27% 26
South West +84 23 £64,627 -4.26% 21
East of England +43 9 £70,000 +2.19% 14
Yorkshire +64 8 £35,000 +7.69% 11
East Midlands +25 6 £40,000 - 5
North East - 2 £55,000 - 6
Release Management
UK

Release Management
Co-occurring Skills and Capabilities in England by Category

The follow tables expand on the table above by listing co-occurrences grouped by category. The same employment type, locality and period is covered with up to 20 co-occurrences shown in each of the following categories:

Application Platforms
1 22 (8.24%) Confluence
2 16 (5.99%) SharePoint
3 12 (4.49%) Microsoft Exchange
4 6 (2.25%) IIS
5 4 (1.50%) Apache Spark
6 3 (1.12%) Apache
7 1 (0.37%) JBoss
7 1 (0.37%) Moodle
7 1 (0.37%) Oracle Workflow
7 1 (0.37%) SAS
7 1 (0.37%) WebSphere
Applications
1 20 (7.49%) Microsoft Office
2 16 (5.99%) Microsoft Excel
3 5 (1.87%) MS Visio
4 3 (1.12%) Spreadsheet
Business Applications
1 16 (5.99%) SAP ERP
1 16 (5.99%) SAP S/4HANA
2 7 (2.62%) Oracle ERP
3 6 (2.25%) Infor M3
4 3 (1.12%) Workday HCM
5 2 (0.75%) Oracle EBS
6 1 (0.37%) Dynamics CRM
6 1 (0.37%) Endur
6 1 (0.37%) Oracle EBS R12
6 1 (0.37%) Remedy ITSM
Cloud Services
1 90 (33.71%) Azure
2 53 (19.85%) Azure DevOps
3 44 (16.48%) GitHub
4 35 (13.11%) SaaS
5 31 (11.61%) GitHub Actions
6 27 (10.11%) Power Platform
7 26 (9.74%) AWS
8 24 (8.99%) Microsoft 365
9 23 (8.61%) Power Automate
10 21 (7.87%) Salesforce Sales Cloud
11 20 (7.49%) PowerApps
12 17 (6.37%) Azure Data Factory
13 15 (5.62%) Azure Logic Apps
14 14 (5.24%) Azure Synapse Analytics
15 12 (4.49%) Azure Functions
15 12 (4.49%) Datadog
15 12 (4.49%) PaaS
15 12 (4.49%) Serverless
16 10 (3.75%) OCI
17 9 (3.37%) IaaS
Communications & Networking
1 4 (1.50%) Network Security
2 2 (0.75%) Firewall
3 1 (0.37%) BGP
3 1 (0.37%) Bluetooth
3 1 (0.37%) Cisco ISE
3 1 (0.37%) Cisco Nexus
3 1 (0.37%) HTTPS
3 1 (0.37%) IPsec
3 1 (0.37%) OpenScape
3 1 (0.37%) OSPF
3 1 (0.37%) Remote Desktop
3 1 (0.37%) SAN
3 1 (0.37%) SD-WAN
3 1 (0.37%) SSH
3 1 (0.37%) VPN
3 1 (0.37%) Wi-Fi
Database & Business Intelligence
1 43 (16.10%) SQL Server
2 15 (5.62%) Relational Database
3 13 (4.87%) Oracle Reports
4 11 (4.12%) Power BI
5 9 (3.37%) Data Lake
5 9 (3.37%) Data Warehouse
6 6 (2.25%) Data Hub
6 6 (2.25%) SQL CLR
7 4 (1.50%) Big Data
7 4 (1.50%) Delta Lake
8 3 (1.12%) Azure SQL Database
9 2 (0.75%) SQL Server Reporting Services
10 1 (0.37%) Amazon RDS
10 1 (0.37%) Crystal Reports
10 1 (0.37%) Data Vault
10 1 (0.37%) MySQL
10 1 (0.37%) Oracle BI Publisher
10 1 (0.37%) Oracle Database
10 1 (0.37%) PostgreSQL
10 1 (0.37%) SQL Server Integration Services
Development Applications
1 31 (11.61%) JIRA
2 29 (10.86%) Git
3 22 (8.24%) Selenium
4 20 (7.49%) SonarQube
5 18 (6.74%) Jenkins
6 10 (3.75%) Postman
6 10 (3.75%) Visual Studio
7 4 (1.50%) FitNesse
7 4 (1.50%) JMeter
7 4 (1.50%) Locust
7 4 (1.50%) Oracle Forms
7 4 (1.50%) Robot Framework
7 4 (1.50%) TeamCity
7 4 (1.50%) Visual Studio Code
8 3 (1.12%) Octopus Deploy
8 3 (1.12%) SpecFlow
9 2 (0.75%) Appium
9 2 (0.75%) Crucible
9 2 (0.75%) Cucumber
9 2 (0.75%) Xcode
General
1 108 (40.45%) Finance
2 75 (28.09%) Social Skills
3 27 (10.11%) Law
3 27 (10.11%) Marketing
4 26 (9.74%) Analytical Skills
5 23 (8.61%) Banking
6 22 (8.24%) Manufacturing
7 15 (5.62%) Police
7 15 (5.62%) Retail
8 14 (5.24%) Public Sector
9 9 (3.37%) Investment Banking
10 8 (3.00%) Back Office
11 7 (2.62%) Inclusion and Diversity
11 7 (2.62%) Organisational Skills
12 2 (0.75%) Documentation Skills
12 2 (0.75%) Fire and Rescue
12 2 (0.75%) Influencing Skills
12 2 (0.75%) Legal
12 2 (0.75%) Local Government
12 2 (0.75%) Telecoms
Job Titles
1 40 (14.98%) DevOps Engineer
2 32 (11.99%) Analyst
3 27 (10.11%) Developer
4 25 (9.36%) Architect
5 24 (8.99%) Senior
6 21 (7.87%) Enterprise Architect
6 21 (7.87%) Salesforce Architect
7 19 (7.12%) Configuration Management Engineer
7 19 (7.12%) Principal Engineer
7 19 (7.12%) SCM Engineer
8 16 (5.99%) SAP Manager
8 16 (5.99%) Support Analyst
9 15 (5.62%) Lead
9 15 (5.62%) Release Manager
10 13 (4.87%) IT Manager
11 12 (4.49%) Change and Release Manager
11 12 (4.49%) Change Manager
12 9 (3.37%) Infrastructure Engineer
12 9 (3.37%) IT Change Manager
12 9 (3.37%) Unix Support
Libraries, Frameworks & Software Standards
1 39 (14.61%) .NET
2 28 (10.49%) REST
3 27 (10.11%) Middleware
4 23 (8.61%) SOAP
5 21 (7.87%) Lightning Web Components
6 16 (5.99%) SAP Fiori
7 15 (5.62%) .NET Framework
8 13 (4.87%) React
9 12 (4.49%) XML
10 10 (3.75%) CSS
10 10 (3.75%) HTML
11 9 (3.37%) ARM Templates
11 9 (3.37%) Entity Framework
12 8 (3.00%) AngularJS
12 8 (3.00%) Azure Blueprints
12 8 (3.00%) Oracle Fusion
13 7 (2.62%) Web Services
14 6 (2.25%) .NET Core
14 6 (2.25%) Dapper ORM
14 6 (2.25%) JSON
Miscellaneous
1 27 (10.11%) Management Information System
2 23 (8.61%) Enterprise Software
3 19 (7.12%) Cloud Native
4 9 (3.37%) Onboarding
4 9 (3.37%) Private Cloud
5 7 (2.62%) Product Ownership
5 7 (2.62%) Virtual Team
6 6 (2.25%) Team-Oriented Environment
7 5 (1.87%) Client/Server
8 4 (1.50%) Mobile App
9 3 (1.12%) Data Centre
9 3 (1.12%) Enterprise Storage
9 3 (1.12%) Legacy Applications
9 3 (1.12%) Public Cloud
10 2 (0.75%) Analytical Mindset
10 2 (0.75%) Market Risk
11 1 (0.37%) Clustering
Operating Systems
1 23 (8.61%) Linux
2 20 (7.49%) Unix
3 17 (6.37%) Windows
4 8 (3.00%) Windows Server
5 4 (1.50%) Windows Server 2012
6 3 (1.12%) Android
6 3 (1.12%) Apple iOS
7 1 (0.37%) Red Hat Enterprise Linux
7 1 (0.37%) Windows Server 2016
Processes & Methodologies
1 114 (42.70%) Agile
2 112 (41.95%) DevOps
3 87 (32.58%) CI/CD
4 59 (22.10%) Continuous Improvement
5 56 (20.97%) Stakeholder Management
6 55 (20.60%) Change Management
7 51 (19.10%) ITIL
8 48 (17.98%) Computer Science
9 34 (12.73%) ERP
9 34 (12.73%) Test Automation
10 31 (11.61%) Problem-Solving
10 31 (11.61%) Software Delivery
10 31 (11.61%) Waterfall
11 30 (11.24%) Data Modelling
11 30 (11.24%) Roadmaps
12 29 (10.86%) Incident Management
12 29 (10.86%) Microservices
13 28 (10.49%) Data Management
13 28 (10.49%) Data Privacy
14 27 (10.11%) Project Management
Programming Languages
1 59 (22.10%) SQL
2 34 (12.73%) C#
3 29 (10.86%) Java
4 25 (9.36%) T-SQL
5 22 (8.24%) Python
6 21 (7.87%) Apex Code
7 18 (6.74%) PowerShell
8 16 (5.99%) ABAP
9 11 (4.12%) TypeScript
10 9 (3.37%) Bash
10 9 (3.37%) JavaScript
11 3 (1.12%) C++
11 3 (1.12%) PL/SQL
11 3 (1.12%) R
11 3 (1.12%) Shell Script
12 2 (0.75%) Objective-C
12 2 (0.75%) Swift
13 1 (0.37%) ActionScript 2.0
13 1 (0.37%) Data Analysis Expressions
13 1 (0.37%) XPath
Qualifications
1 58 (21.72%) Degree
2 27 (10.11%) Computer Science Degree
3 24 (8.99%) BPSS Clearance
4 21 (7.87%) Master's Degree
5 19 (7.12%) Chartered Engineer
5 19 (7.12%) Security Cleared
6 8 (3.00%) Microsoft Certification
7 7 (2.62%) ITIL Certification
8 5 (1.87%) AWS Certification
8 5 (1.87%) AWS Certified DevOps Engineer
8 5 (1.87%) Azure Certification
8 5 (1.87%) ISTQB
8 5 (1.87%) SC Cleared
9 4 (1.50%) Cisco Certification
10 3 (1.12%) (ISC)2 CCSP
10 3 (1.12%) CCSK
10 3 (1.12%) CCSP
10 3 (1.12%) CISA
11 1 (0.37%) AWS Certified Solutions Architect
11 1 (0.37%) CCNP
Quality Assurance & Compliance
1 33 (12.36%) QA
2 22 (8.24%) Data Quality
3 8 (3.00%) NCSC
4 6 (2.25%) GxP
5 2 (0.75%) Accessibility
5 2 (0.75%) Cyber Essentials
6 1 (0.37%) GRC
System Software
1 26 (9.74%) Docker
2 11 (4.12%) VMware Infrastructure
3 7 (2.62%) Active Directory
4 2 (0.75%) Firmware
4 2 (0.75%) Hyper-V
5 1 (0.37%) KVM
5 1 (0.37%) Xen
Systems Management
1 28 (10.49%) Kubernetes
2 24 (8.99%) Terraform
3 15 (5.62%) Ansible
4 6 (2.25%) Prometheus
5 3 (1.12%) Control-M
6 2 (0.75%) Puppet
7 1 (0.37%) CFEngine
7 1 (0.37%) Failover Clustering
7 1 (0.37%) Microsoft Intune
7 1 (0.37%) Podman
7 1 (0.37%) Progress Chef
7 1 (0.37%) Single Sign-On
Vendors
1 59 (22.10%) Microsoft
2 37 (13.86%) Oracle
3 25 (9.36%) Salesforce
4 22 (8.24%) SAP
5 21 (7.87%) Salesforce Marketing Cloud
6 19 (7.12%) Micro Focus
7 15 (5.62%) VMware
8 14 (5.24%) Databricks
9 6 (2.25%) Infor
9 6 (2.25%) ServiceNow
10 4 (1.50%) Dell
10 4 (1.50%) Google
11 3 (1.12%) Citrix
11 3 (1.12%) IBM
11 3 (1.12%) Isilon
11 3 (1.12%) Trayport
11 3 (1.12%) Workday
12 2 (0.75%) Apple
12 2 (0.75%) Atlassian
12 2 (0.75%) Cisco