Virtual Team Jobs in England

Virtual Team (including Distributed Team, Remote Team, Dispersed Team)
UK > England

The table below looks at the prevalence of the term Virtual Team in permanent job vacancies in England. Included is a benchmarking guide to the salaries offered in vacancies that cited Virtual Team over the 6 months leading up to 12 May 2025, comparing them to the same period in the previous two years.

6 months to
12 May 2025
Same period 2024 Same period 2023
Rank 433 447 222
Rank change year-on-year +14 -225 +17
Permanent jobs citing Virtual Team 279 440 1,499
As % of all permanent jobs advertised in England 0.57% 0.51% 1.67%
As % of the Miscellaneous category 1.58% 1.47% 3.79%
Number of salaries quoted 160 282 488
10th Percentile £39,875 £42,625 £42,500
25th Percentile £47,500 £50,000 £58,563
Median annual salary (50th Percentile) £63,750 £62,500 £60,899
Median % change year-on-year +2.00% +2.63% -13.00%
75th Percentile £83,125 £87,500 £80,000
90th Percentile £106,250 £120,000 £101,185
UK median annual salary £62,500 £62,500 £60,899
% change year-on-year - +2.63% -13.00%

All Generic Skills
England

Virtual Team falls under the General and Transferable Skills category. For comparison with the information above, the following table provides summary statistics for all permanent job vacancies requiring generic IT skills in England.

Permanent vacancies with a requirement for generic IT skills 17,611 29,869 39,523
As % of all permanent jobs advertised in England 36.07% 34.77% 43.99%
Number of salaries quoted 8,937 20,885 21,231
10th Percentile £31,250 £28,000 £35,483
25th Percentile £42,500 £38,000 £46,570
Median annual salary (50th Percentile) £60,000 £55,000 £65,000
Median % change year-on-year +9.09% -15.38% +4.00%
75th Percentile £80,000 £75,000 £87,500
90th Percentile £111,250 £100,000 £110,000
UK median annual salary £60,000 £55,000 £65,000
% change year-on-year +9.09% -15.38% +4.00%

Virtual Team
Job Vacancy Trend in England

Job postings citing Virtual Team as a proportion of all IT jobs advertised in England.
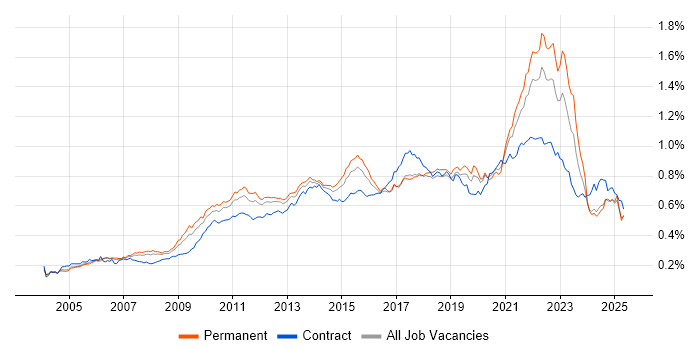
Job vacancy trend for Virtual Team in England

Virtual Team
Salary Trend in England

3-month moving average salary quoted in jobs citing Virtual Team in England.

Salary trend for Virtual Team in England

Virtual Team
Salary Histogram in England

Salary distribution for jobs citing Virtual Team in England over the 6 months to 12 May 2025.

Salary histogram for Virtual Team in England

Virtual Team
Job Locations in England

The table below looks at the demand and provides a guide to the median salaries quoted in IT jobs citing Virtual Team within the England region over the 6 months to 12 May 2025. The 'Rank Change' column provides an indication of the change in demand within each location based on the same 6 month period last year.

Location Rank Change
on Same Period
Last Year
Matching
Permanent
IT Job Ads
Median Salary
Past 6 Months
Median Salary
% Change
on Same Period
Last Year
Live
Jobs
London +35 103 £75,000 -6.25% 418
South East +112 66 £40,000 -33.33% 107
North of England +41 32 £59,000 +7.27% 56
East of England +59 26 £72,500 +48.26% 26
Yorkshire +80 24 £62,500 +13.64% 15
South West +78 22 £55,000 +7.32% 29
Midlands +15 19 £62,500 +8.70% 22
West Midlands +19 18 £62,500 +8.70% 12
North West -24 7 £57,500 +2.22% 39
North East +41 1 £25,000 -54.55% 2
East Midlands +31 1 - - 9
Virtual Team
UK

Virtual Team
Co-occurring Skills and Capabilities in England by Category

The follow tables expand on the table above by listing co-occurrences grouped by category. The same employment type, locality and period is covered with up to 20 co-occurrences shown in each of the following categories:

Application Platforms
1 23 (8.24%) Microsoft Exchange
2 10 (3.58%) Confluence
3 3 (1.08%) Oracle SOA Suite
4 2 (0.72%) ArcGIS
5 1 (0.36%) Apache Airflow
5 1 (0.36%) OpenStack
5 1 (0.36%) SharePoint
Applications
1 5 (1.79%) Microsoft Office
2 4 (1.43%) Microsoft Excel
2 4 (1.43%) Microsoft PowerPoint
3 2 (0.72%) Microsoft Project
4 1 (0.36%) MS Visio
Business Applications
1 9 (3.23%) Dynamics AX
1 9 (3.23%) NetSuite
2 3 (1.08%) Dynamics CRM
2 3 (1.08%) Oracle EBS
3 2 (0.72%) SAP MDG
3 2 (0.72%) SAP S/4HANA
4 1 (0.36%) Magento
4 1 (0.36%) Oracle ERP
4 1 (0.36%) Salesforce CRM
4 1 (0.36%) SAP ERP
Cloud Services
1 40 (14.34%) Azure
2 22 (7.89%) SaaS
3 21 (7.53%) AWS
4 12 (4.30%) Azure DevOps
4 12 (4.30%) Dynamics 365
5 10 (3.58%) GitHub
6 9 (3.23%) Boomi
7 8 (2.87%) Cloud Computing
7 8 (2.87%) IaaS
7 8 (2.87%) Microsoft 365
7 8 (2.87%) PaaS
7 8 (2.87%) Power Platform
8 7 (2.51%) Entra ID
8 7 (2.51%) GCP
9 5 (1.79%) OpenShift
10 4 (1.43%) Microsoft Purview
10 4 (1.43%) Serverless
11 3 (1.08%) GitHub Actions
11 3 (1.08%) OCI
11 3 (1.08%) Smartsheet
Communications & Networking
1 22 (7.89%) WAN
2 21 (7.53%) Internet
2 21 (7.53%) Wireless
3 20 (7.17%) LAN
4 7 (2.51%) SSL
5 4 (1.43%) Firewall
6 3 (1.08%) Intranet
6 3 (1.08%) SD-WAN
7 2 (0.72%) DNS
7 2 (0.72%) TCP/IP
8 1 (0.36%) BGP
8 1 (0.36%) Bluetooth
8 1 (0.36%) Cisco IOS
8 1 (0.36%) HTTPS
8 1 (0.36%) MPLS
8 1 (0.36%) Multicast
8 1 (0.36%) Network Security
8 1 (0.36%) OSPF
8 1 (0.36%) VPN
8 1 (0.36%) Wi-Fi
Database & Business Intelligence
1 14 (5.02%) Relational Database
2 11 (3.94%) SQL Server
3 8 (2.87%) MySQL
4 7 (2.51%) DTS
4 7 (2.51%) Metadata
4 7 (2.51%) Power BI
5 5 (1.79%) Data Warehouse
5 5 (1.79%) Metadata Repository
6 3 (1.08%) MongoDB
6 3 (1.08%) NoSQL
6 3 (1.08%) Oracle ODI
6 3 (1.08%) PostgreSQL
7 2 (0.72%) BusinessObjects
7 2 (0.72%) GIS
7 2 (0.72%) QGIS
8 1 (0.36%) Amazon Aurora
8 1 (0.36%) Big Data
8 1 (0.36%) DynamoDB
8 1 (0.36%) MariaDB
8 1 (0.36%) Tableau
Development Applications
1 33 (11.83%) Git
2 26 (9.32%) JIRA
3 22 (7.89%) Jenkins
4 6 (2.15%) MSTest
5 4 (1.43%) TeamCity
6 3 (1.08%) Bitbucket
6 3 (1.08%) GDB
6 3 (1.08%) GitLab
6 3 (1.08%) NUnit
6 3 (1.08%) SpecFlow
7 2 (0.72%) Cypress.io
7 2 (0.72%) LSMW
7 2 (0.72%) Team Foundation Server
7 2 (0.72%) webpack
8 1 (0.36%) Atlassian Bamboo
8 1 (0.36%) FitNesse
8 1 (0.36%) Maven
8 1 (0.36%) Selenium
8 1 (0.36%) TestNG
8 1 (0.36%) WebDriver
General
1 113 (40.50%) Social Skills
2 86 (30.82%) Finance
3 36 (12.90%) Analytical Skills
4 28 (10.04%) Inclusion and Diversity
4 28 (10.04%) Law
5 22 (7.89%) German Language
6 17 (6.09%) Presentation Skills
7 16 (5.73%) Banking
7 16 (5.73%) Marketing
8 13 (4.66%) Legal
9 11 (3.94%) Organisational Skills
10 6 (2.15%) Influencing Skills
11 5 (1.79%) Documentation Skills
11 5 (1.79%) Police
11 5 (1.79%) Retail
12 4 (1.43%) Electronics
12 4 (1.43%) Front Office
13 3 (1.08%) Public Sector
13 3 (1.08%) Telecoms
14 2 (0.72%) Environmental Health
Job Titles
1 44 (15.77%) Senior
2 38 (13.62%) Developer
3 22 (7.89%) Information Security Specialist
3 22 (7.89%) Information Specialist
3 22 (7.89%) Security Specialist
4 20 (7.17%) Lead
5 19 (6.81%) Infrastructure Support
5 19 (6.81%) Network Support
6 17 (6.09%) Senior Developer
7 15 (5.38%) Analyst
8 14 (5.02%) IT Manager
9 13 (4.66%) Development Manager
10 12 (4.30%) Senior Manager
11 11 (3.94%) Project Manager
12 10 (3.58%) Software Manager
13 9 (3.23%) NetSuite Developer
13 9 (3.23%) Technical Developer
14 8 (2.87%) Engineering Manager
14 8 (2.87%) Front-End Developer (Client-Side Developer)
14 8 (2.87%) IT Engineer
Libraries, Frameworks & Software Standards
1 27 (9.68%) CSS
2 24 (8.60%) HTML
3 22 (7.89%) SailPoint
4 19 (6.81%) PyTorch
5 18 (6.45%) .NET
6 17 (6.09%) NumPy
6 17 (6.09%) OpenCV
6 17 (6.09%) Pandas
6 17 (6.09%) SciPy
7 16 (5.73%) OAuth
8 14 (5.02%) React
9 12 (4.30%) Web Services
10 11 (3.94%) XML
11 10 (3.58%) AngularJS
12 9 (3.23%) ASP.NET
12 9 (3.23%) Middleware
12 9 (3.23%) Restlet
12 9 (3.23%) SAML
13 8 (2.87%) LESS
14 7 (2.51%) UIKit
Miscellaneous
1 43 (15.41%) Management Information System
2 24 (8.60%) Algorithms
3 18 (6.45%) Robotics
4 17 (6.09%) Onboarding
4 17 (6.09%) Self-Motivation
5 9 (3.23%) Cloud Native
5 9 (3.23%) CSOC
6 8 (2.87%) Fixed Income
7 6 (2.15%) Product Ownership
8 5 (1.79%) Cyber Threat
8 5 (1.79%) Data Structures
8 5 (1.79%) Tandem
9 4 (1.43%) Data Centre
9 4 (1.43%) Derivative
9 4 (1.43%) Enterprise Software
9 4 (1.43%) Foreign Exchange (FX)
10 3 (1.08%) Credit Derivative
10 3 (1.08%) Equities
10 3 (1.08%) IoT
10 3 (1.08%) PKI
Operating Systems
1 31 (11.11%) Windows
2 12 (4.30%) Linux
3 8 (2.87%) Android
3 8 (2.87%) Apple iOS
4 6 (2.15%) zOS
5 3 (1.08%) Embedded Linux
6 2 (0.72%) Unix
7 1 (0.36%) FreeRTOS
7 1 (0.36%) Mac OS
Processes & Methodologies
1 95 (34.05%) Agile
2 58 (20.79%) Problem-Solving
3 57 (20.43%) Virtual Team Management
4 54 (19.35%) Mentoring
5 53 (19.00%) Collaborative Working
6 44 (15.77%) DevOps
7 41 (14.70%) Risk Management
8 39 (13.98%) CI/CD
9 34 (12.19%) Project Management
10 32 (11.47%) Information Security
11 30 (10.75%) ITIL
12 28 (10.04%) Roadmaps
13 26 (9.32%) Analytics
13 26 (9.32%) Identity Access Management
14 25 (8.96%) Computer Science
14 25 (8.96%) Stakeholder Management
15 24 (8.60%) Artificial Intelligence
15 24 (8.60%) Machine Learning
15 24 (8.60%) Software Engineering
16 23 (8.24%) Continuous Improvement
Programming Languages
1 43 (15.41%) Python
2 35 (12.54%) JavaScript
3 28 (10.04%) SQL
4 25 (8.96%) C#
4 25 (8.96%) Java
4 25 (8.96%) PowerShell
5 15 (5.38%) TypeScript
6 8 (2.87%) PHP
7 7 (2.51%) C++
7 7 (2.51%) Kotlin
7 7 (2.51%) Swift
8 5 (1.79%) C
8 5 (1.79%) VB.NET
9 3 (1.08%) Groovy
10 2 (0.72%) XQuery
11 1 (0.36%) ActionScript 2.0
11 1 (0.36%) Embedded C
11 1 (0.36%) Embedded C++
11 1 (0.36%) Shell Script
11 1 (0.36%) XPath
Qualifications
1 120 (43.01%) Degree
2 45 (16.13%) Master's Degree
3 24 (8.60%) Security Cleared
4 20 (7.17%) PhD
5 19 (6.81%) MBA
6 18 (6.45%) SC Cleared
7 12 (4.30%) Computer Science Degree
8 9 (3.23%) PMP
9 8 (2.87%) CISSP
10 7 (2.51%) Microsoft Certification
11 6 (2.15%) Six Sigma Black Belt
11 6 (2.15%) Six Sigma Green Belt
12 5 (1.79%) Azure Certification
12 5 (1.79%) GCIA
12 5 (1.79%) GCIH
12 5 (1.79%) OSCE
12 5 (1.79%) OSCP
12 5 (1.79%) PMI Certification
13 4 (1.43%) Cisco Certification
13 4 (1.43%) Numerate Degree
Quality Assurance & Compliance
1 23 (8.24%) QA
2 9 (3.23%) Accessibility
3 7 (2.51%) GDPR
3 7 (2.51%) Sarbanes-Oxley
4 5 (1.79%) California Consumer Privacy Act
4 5 (1.79%) Data Quality
5 3 (1.08%) JTAG
5 3 (1.08%) Software Quality Assurance
6 2 (0.72%) PMO
7 1 (0.36%) IEC 62304
7 1 (0.36%) ISO 9001
7 1 (0.36%) MISRA
7 1 (0.36%) WCAG
System Software
1 30 (10.75%) Active Directory
2 7 (2.51%) Docker
3 3 (1.08%) Firmware
Systems Management
1 14 (5.02%) Ansible
2 12 (4.30%) Kubernetes
2 12 (4.30%) Terraform
3 9 (3.23%) QRadar
3 9 (3.23%) Single Sign-On
4 5 (1.79%) CSIRT
5 3 (1.08%) CASB
5 3 (1.08%) Microsoft Intune
6 2 (0.72%) EMC NetWorker
6 2 (0.72%) Progress Chef
6 2 (0.72%) Puppet
Vendors
1 47 (16.85%) Microsoft
2 23 (8.24%) Salesforce
3 22 (7.89%) Okta
4 19 (6.81%) Unisys
5 10 (3.58%) SAP
6 9 (3.23%) Dell
6 9 (3.23%) IBM
6 9 (3.23%) MuleSoft
7 8 (2.87%) Oracle
8 5 (1.79%) ServiceNow
9 4 (1.43%) ANSYS
9 4 (1.43%) Cisco
10 3 (1.08%) Google
10 3 (1.08%) Symantec
10 3 (1.08%) Zscaler
11 2 (0.72%) BMC
11 2 (0.72%) Broadcom
11 2 (0.72%) Confluent
11 2 (0.72%) Red Hat
11 2 (0.72%) VMware