Incident Response Jobs with Hybrid/Remote/WFH Options

Incident Response
UK > Work from Home

The table below provides summary statistics for permanent remote or hybrid work requiring Incident Response skills. It includes a benchmarking guide to the annual salaries offered in vacancies that cited Incident Response over the 6 months leading up to 7 May 2025, comparing them to the same period in the previous two years.

6 months to
7 May 2025
Same period 2024 Same period 2023
Rank 244 305 301
Rank change year-on-year +61 -4 +84
Permanent jobs citing Incident Response 200 329 441
As % of all permanent jobs with a WFH option 1.22% 0.97% 1.04%
As % of the Processes & Methodologies category 1.30% 1.06% 1.08%
Number of salaries quoted 168 235 303
10th Percentile £45,875 £41,400 £42,500
25th Percentile £52,500 £52,500 £47,500
Median annual salary (50th Percentile) £61,250 £70,000 £62,500
Median % change year-on-year -12.50% +12.00% -3.85%
75th Percentile £77,500 £85,000 £77,500
90th Percentile £95,000 £99,750 £92,250
UK median annual salary £65,000 £65,000 £65,000
% change year-on-year - - +4.00%

All Process and Methodology Skills
Work from Home

Incident Response falls under the Processes and Methodologies category. For comparison with the information above, the following table provides summary statistics for all permanent job vacancies with remote or hybrid options requiring process or methodology skills.

Permanent vacancies with a requirement for process or methodology skills 15,361 31,014 40,730
As % of all permanent jobs with a WFH option 93.62% 91.60% 96.11%
Number of salaries quoted 9,801 23,557 28,305
10th Percentile £29,913 £33,750 £37,500
25th Percentile £45,000 £42,500 £47,500
Median annual salary (50th Percentile) £60,000 £57,500 £62,500
Median % change year-on-year +4.35% -8.00% +4.17%
75th Percentile £77,500 £75,000 £82,500
90th Percentile £102,500 £95,000 £100,000
UK median annual salary £57,500 £55,000 £61,500
% change year-on-year +4.55% -10.57% +2.50%

Incident Response
Trend for Jobs with a WFH Option

Job vacancies with remote working options citing Incident Response as a proportion of all IT jobs advertised.
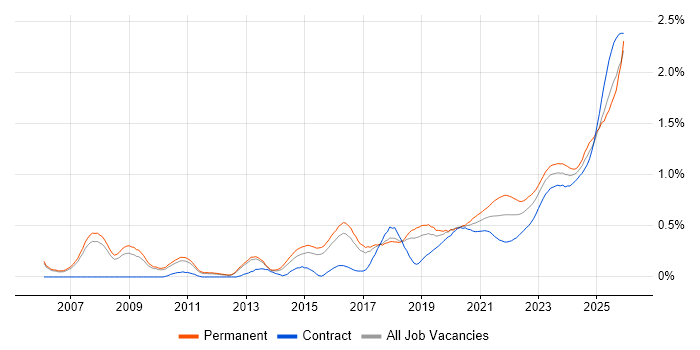
Incident Response trend for jobs with Hybrid/Remote/WFH options

Incident Response
Salary Trend for Jobs with a WFH Option

3-month moving average salary quoted in job vacancies with remote working options citing Incident Response.

Incident Response salary trend for jobs with a WFH option

Incident Response
Salary Histogram for Jobs with a WFH Option

Salary distribution for jobs with remote working options citing Incident Response over the 6 months to 7 May 2025.

Incident Response salary histogram for jobs with a WFH option

Incident Response
Co-occurring Skills and Capabilities with WFH Options by Category

The follow tables expand on the table above by listing co-occurrences grouped by category. The same employment type, locality and period is covered with up to 20 co-occurrences shown in each of the following categories:

Application Platforms
1 7 (3.50%) SharePoint
2 6 (3.00%) Microsoft Exchange
2 6 (3.00%) nginx
Applications
1 2 (1.00%) Microsoft Office
2 1 (0.50%) Microsoft Excel
Business Applications
1 1 (0.50%) Elite 3E
Cloud Services
1 57 (28.50%) Azure
2 45 (22.50%) AWS
3 31 (15.50%) Microsoft 365
4 24 (12.00%) Azure Sentinel
5 19 (9.50%) Serverless
6 18 (9.00%) AWS Lambda
7 14 (7.00%) GCP
8 13 (6.50%) AWS CloudFormation
8 13 (6.50%) AWS KMS
9 10 (5.00%) Amazon CloudWatch
10 8 (4.00%) Entra ID
11 7 (3.50%) AWS CloudTrail
12 6 (3.00%) Azure AKS
13 4 (2.00%) Amazon EKS
13 4 (2.00%) Amazon S3
13 4 (2.00%) Azure DevOps
14 3 (1.50%) Cloud Computing
14 3 (1.50%) OneDrive
14 3 (1.50%) PaaS
14 3 (1.50%) SaaS
Communications & Networking
1 45 (22.50%) Firewall
2 31 (15.50%) Network Security
3 19 (9.50%) Intrusion Detection
4 12 (6.00%) VPN
5 9 (4.50%) SAN
6 7 (3.50%) DHCP
6 7 (3.50%) DNS
7 6 (3.00%) TCP/IP
8 4 (2.00%) Cisco ASA
8 4 (2.00%) Cisco Firepower
9 3 (1.50%) NGFW
9 3 (1.50%) Wireless
10 2 (1.00%) LAN
10 2 (1.00%) WAN
10 2 (1.00%) Wireless Security
11 1 (0.50%) Internet
Database & Business Intelligence
1 9 (4.50%) Amazon RDS
2 6 (3.00%) MariaDB
3 3 (1.50%) DynamoDB
4 1 (0.50%) Power BI
Development Applications
1 6 (3.00%) JIRA
2 2 (1.00%) Metasploit
3 1 (0.50%) GitLab
3 1 (0.50%) Jenkins
General
1 66 (33.00%) Social Skills
2 49 (24.50%) Finance
3 37 (18.50%) Analytical Skills
4 15 (7.50%) Law
5 6 (3.00%) Banking
5 6 (3.00%) Inclusion and Diversity
6 5 (2.50%) Retail
7 3 (1.50%) Legal
8 2 (1.00%) Documentation Skills
8 2 (1.00%) Manufacturing
8 2 (1.00%) Telecoms
9 1 (0.50%) Aerospace
9 1 (0.50%) Financial Institution
9 1 (0.50%) Games
9 1 (0.50%) Health Technology
9 1 (0.50%) Local Government
9 1 (0.50%) Public Sector
Job Titles
1 57 (28.50%) Analyst
2 40 (20.00%) Security Analyst
3 17 (8.50%) Architect
3 17 (8.50%) Cybersecurity Analyst
3 17 (8.50%) Vulnerability Manager
4 16 (8.00%) AWS Architect
4 16 (8.00%) Security Engineer
4 16 (8.00%) Security Manager
5 15 (7.50%) Senior
6 14 (7.00%) Cloud Architect
7 13 (6.50%) Lead
8 11 (5.50%) Incident Analyst
8 11 (5.50%) SOC Analyst
9 9 (4.50%) CISSP Analyst
9 9 (4.50%) Incident Manager
9 9 (4.50%) Junior
9 9 (4.50%) Junior Analyst
9 9 (4.50%) Junior Security Analyst
9 9 (4.50%) Operations Analyst
9 9 (4.50%) Security Operations Analyst
Libraries, Frameworks & Software Standards
1 14 (7.00%) Elastic Stack
1 14 (7.00%) Kafka
2 4 (2.00%) Spring
2 4 (2.00%) Spring Boot
3 3 (1.50%) Azure Blueprints
3 3 (1.50%) OpenTelemetry
4 2 (1.00%) JSON
4 2 (1.00%) Leaflet
4 2 (1.00%) Loki
5 1 (0.50%) CSS
5 1 (0.50%) React
5 1 (0.50%) SAML
Miscellaneous
1 39 (19.50%) Management Information System
2 26 (13.00%) Security Posture
3 22 (11.00%) Cyber Threat
4 21 (10.50%) Data Centre
5 12 (6.00%) Security Operations Centre
6 11 (5.50%) Onboarding
7 9 (4.50%) Cloud Native
7 9 (4.50%) CSOC
7 9 (4.50%) Hedge funds
7 9 (4.50%) Podcast
7 9 (4.50%) Virtual Team
8 7 (3.50%) CMDB
9 4 (2.00%) Analytical Mindset
9 4 (2.00%) Data Protection Act
9 4 (2.00%) Housing Association
10 3 (1.50%) Cyber Defence
10 3 (1.50%) Cyber Security Posture
10 3 (1.50%) Cyberattack
10 3 (1.50%) Greenfield Project
10 3 (1.50%) Hybrid Cloud
Operating Systems
1 34 (17.00%) Windows
2 9 (4.50%) Linux
3 4 (2.00%) Windows Server
4 3 (1.50%) VMS
5 1 (0.50%) Red Hat Enterprise Linux
5 1 (0.50%) Windows 10
5 1 (0.50%) Windows Server 2016
5 1 (0.50%) Windows Server 2019
Processes & Methodologies
1 112 (56.00%) Cybersecurity
2 64 (32.00%) SIEM
3 60 (30.00%) Information Security
4 56 (28.00%) Security Operations
5 54 (27.00%) Continuous Improvement
6 48 (24.00%) DevOps
7 40 (20.00%) Cloud Security
7 40 (20.00%) Risk Management
8 39 (19.50%) Problem-Solving
9 38 (19.00%) Vulnerability Management
10 34 (17.00%) Mentoring
11 32 (16.00%) Incident Management
12 30 (15.00%) ITIL
13 27 (13.50%) Data Protection
14 26 (13.00%) Computer Science
14 26 (13.00%) Penetration Testing
14 26 (13.00%) Security Architecture
15 24 (12.00%) CI/CD
16 22 (11.00%) Containerisation
16 22 (11.00%) Infrastructure as Code
Programming Languages
1 24 (12.00%) Python
2 23 (11.50%) PowerShell
3 18 (9.00%) Java
4 6 (3.00%) Bash
5 5 (2.50%) Kusto Query Language
6 4 (2.00%) TypeScript
7 2 (1.00%) Perl
7 2 (1.00%) VBA
8 1 (0.50%) JavaScript
8 1 (0.50%) SQL
Qualifications
1 54 (27.00%) Degree
2 51 (25.50%) CISSP
3 33 (16.50%) Security Cleared
4 32 (16.00%) Computer Science Degree
5 27 (13.50%) CISM
6 25 (12.50%) SC Cleared
7 21 (10.50%) CompTIA Security+
8 20 (10.00%) AWS Certification
9 18 (9.00%) CEH
9 18 (9.00%) OSCP
10 15 (7.50%) SANS
11 14 (7.00%) AWS Certified Solutions Architect
12 12 (6.00%) GCIH
13 10 (5.00%) GCIA
13 10 (5.00%) ITIL Certification
14 8 (4.00%) CISA
14 8 (4.00%) Cisco Certification
15 7 (3.50%) CRISC
16 6 (3.00%) Microsoft Certification
17 5 (2.50%) GIAC
Quality Assurance & Compliance
1 39 (19.50%) ISO/IEC 27001
2 34 (17.00%) GDPR
3 25 (12.50%) NIST
4 16 (8.00%) HIPAA
5 13 (6.50%) Cyber Essentials
5 13 (6.50%) PCI DSS
6 5 (2.50%) SOC 2
7 4 (2.00%) COBIT
7 4 (2.00%) Cyber Essentials PLUS
7 4 (2.00%) GRC
7 4 (2.00%) NIST 800
8 3 (1.50%) QA
8 3 (1.50%) Sarbanes-Oxley
9 1 (0.50%) Actionable Recommendations
9 1 (0.50%) ISO/IEC 27005
9 1 (0.50%) SLA
System Software
1 20 (10.00%) Virtual Machines
2 16 (8.00%) Active Directory
3 14 (7.00%) Docker
4 2 (1.00%) VMware Infrastructure
5 1 (0.50%) Firmware
5 1 (0.50%) Hyper-V
5 1 (0.50%) Virtual Servers
Systems Management
1 27 (13.50%) Kubernetes
2 24 (12.00%) Terraform
3 23 (11.50%) Prometheus
4 20 (10.00%) Grafana
5 18 (9.00%) Microsoft Intune
6 9 (4.50%) QRadar
7 4 (2.00%) Progress Chef
7 4 (2.00%) Puppet
8 3 (1.50%) CASB
8 3 (1.50%) Istio
8 3 (1.50%) linkerd
9 2 (1.00%) Ansible
10 1 (0.50%) Active Directory Federation Services
10 1 (0.50%) Nessus
10 1 (0.50%) SCOM
10 1 (0.50%) Single Sign-On
Vendors
1 64 (32.00%) Microsoft
2 31 (15.50%) Tenable
3 17 (8.50%) Qualys
4 15 (7.50%) VMware
5 10 (5.00%) CrowdStrike
6 8 (4.00%) ServiceNow
7 7 (3.50%) Cisco
8 5 (2.50%) Google
8 5 (2.50%) Splunk
9 4 (2.00%) CheckPoint
10 3 (1.50%) Dynatrace
10 3 (1.50%) Fortinet
10 3 (1.50%) Zscaler
11 2 (1.00%) Darktrace
11 2 (1.00%) Meraki
11 2 (1.00%) Palo Alto
11 2 (1.00%) Sun
11 2 (1.00%) Yardi
12 1 (0.50%) Citrix
12 1 (0.50%) Red Hat