Banking Jobs in England

Banking
UK > England

The table below looks at the prevalence of the term Banking in permanent job vacancies in England. Included is a benchmarking guide to the salaries offered in vacancies that cited Banking over the 6 months leading up to 11 May 2025, comparing them to the same period in the previous two years.

6 months to
11 May 2025
Same period 2024 Same period 2023
Rank 33 74 38
Rank change year-on-year +41 -36 +24
Permanent jobs citing Banking 3,027 2,886 6,015
As % of all permanent jobs advertised in England 6.26% 3.36% 6.69%
As % of the General category 9.09% 5.67% 9.81%
Number of salaries quoted 1,500 1,982 3,855
10th Percentile £23,504 £47,500 £46,572
25th Percentile £25,313 £63,353 £56,407
Median annual salary (50th Percentile) £72,500 £85,000 £75,000
Median % change year-on-year -14.71% +13.33% -
75th Percentile £106,250 £115,000 £100,649
90th Percentile £135,000 £142,500 £130,000
UK median annual salary £66,367 £83,577 £75,000
% change year-on-year -20.59% +11.44% +2.11%

All General Skills
England

Banking falls under the General Skills category. For comparison with the information above, the following table provides summary statistics for all permanent job vacancies requiring common skills in England.

Permanent vacancies with a requirement for common skills 33,306 50,872 61,304
As % of all permanent jobs advertised in England 68.85% 59.24% 68.15%
Number of salaries quoted 16,642 35,678 33,330
10th Percentile £28,500 £27,500 £32,500
25th Percentile £41,250 £36,250 £43,750
Median annual salary (50th Percentile) £57,500 £52,500 £60,000
Median % change year-on-year +9.52% -12.50% -
75th Percentile £77,500 £72,500 £82,500
90th Percentile £102,500 £95,000 £104,275
UK median annual salary £55,000 £52,500 £60,000
% change year-on-year +4.76% -12.50% -

Banking
Job Vacancy Trend in England

Job postings citing Banking as a proportion of all IT jobs advertised in England.
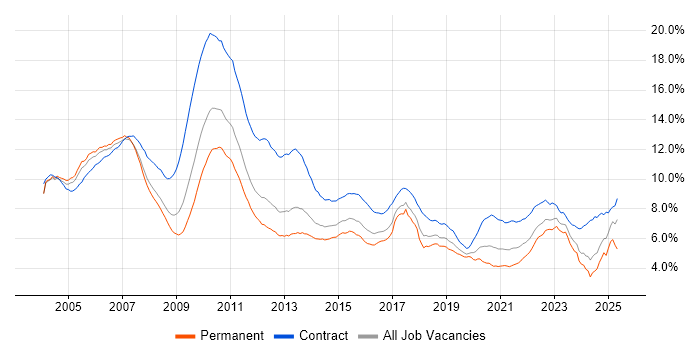
Job vacancy trend for Banking in England

Banking
Salary Trend in England

3-month moving average salary quoted in jobs citing Banking in England.

Salary trend for Banking in England

Banking
Salary Histogram in England

Salary distribution for jobs citing Banking in England over the 6 months to 11 May 2025.

Salary histogram for Banking in England

Banking
Job Locations in England

The table below looks at the demand and provides a guide to the median salaries quoted in IT jobs citing Banking within the England region over the 6 months to 11 May 2025. The 'Rank Change' column provides an indication of the change in demand within each location based on the same 6 month period last year.

Location Rank Change
on Same Period
Last Year
Matching
Permanent
IT Job Ads
Median Salary
Past 6 Months
Median Salary
% Change
on Same Period
Last Year
Live
Jobs
London +6 1,383 £95,000 +5.56% 1,446
North of England +94 1,068 £25,625 -63.69% 161
North West +96 580 £25,000 -64.29% 115
South West +31 295 £45,000 -36.24% 51
Yorkshire +47 294 £59,738 -15.36% 40
North East +70 194 £25,087 -55.79% 8
Midlands +70 122 £65,000 +18.18% 102
East of England +79 80 £32,500 -35.00% 28
South East +45 71 £70,000 +16.67% 397
East Midlands +60 62 £35,000 -50.00% 43
West Midlands +51 58 £70,000 +27.27% 55
Banking
UK

Banking
Co-occurring Skills and Capabilities in England by Category

The follow tables expand on the table above by listing co-occurrences grouped by category. The same employment type, locality and period is covered with up to 20 co-occurrences shown in each of the following categories:

Application Platforms
1 160 (5.29%) Confluence
2 134 (4.43%) Apache Airflow
3 114 (3.77%) Apache
4 43 (1.42%) SAS
5 26 (0.86%) Microsoft Exchange
6 15 (0.50%) Apache Spark
7 14 (0.46%) SharePoint
8 8 (0.26%) Tomcat
9 6 (0.20%) Adobe Experience Manager
10 5 (0.17%) CMS
10 5 (0.17%) NetWeaver
11 4 (0.13%) WordPress
12 3 (0.099%) CICS
12 3 (0.099%) Mule
12 3 (0.099%) nginx
12 3 (0.099%) WebSphere
13 2 (0.066%) OpenStack
14 1 (0.033%) GemFire
14 1 (0.033%) JBoss
14 1 (0.033%) Oracle SOA Suite
Applications
1 415 (13.71%) Microsoft PowerPoint
2 74 (2.44%) Microsoft Office
3 57 (1.88%) Microsoft Excel
4 16 (0.53%) Maya
4 16 (0.53%) MS Visio
5 10 (0.33%) Microsoft Project
6 7 (0.23%) Chatbot
7 4 (0.13%) Spreadsheet
8 1 (0.033%) Adobe Creative Suite
8 1 (0.033%) Sketch
8 1 (0.033%) Stata
Business Applications
1 12 (0.40%) Fidessa
2 11 (0.36%) Postilion
3 8 (0.26%) Remedy ITSM
3 8 (0.26%) SAP S/4HANA
4 7 (0.23%) Oracle Subledger Accounting
4 7 (0.23%) Orchestrade
4 7 (0.23%) SAP IBP
4 7 (0.23%) Temenos T24
5 5 (0.17%) Dynamics CRM
6 4 (0.13%) Oracle BPM
7 3 (0.099%) Payment Gateway
7 3 (0.099%) SimCorp Dimension
8 2 (0.066%) Distributed Ledger
8 2 (0.066%) IBM Planning Analytics
8 2 (0.066%) Refinitiv Enterprise Platform
9 1 (0.033%) Endur
9 1 (0.033%) Oracle ERP
9 1 (0.033%) SAP CO
9 1 (0.033%) SAP FI
9 1 (0.033%) SAP FI/CO
Cloud Services
1 648 (21.41%) AWS
2 563 (18.60%) Azure
3 460 (15.20%) GCP
4 136 (4.49%) Snowflake
5 133 (4.39%) dbt
6 68 (2.25%) Amazon EC2
7 65 (2.15%) Amazon ECS
8 60 (1.98%) Power Platform
9 56 (1.85%) SaaS
10 54 (1.78%) Dagster
11 52 (1.72%) GitHub
11 52 (1.72%) Serverless
12 49 (1.62%) Amazon EKS
13 46 (1.52%) Amazon S3
14 42 (1.39%) Cloud Computing
14 42 (1.39%) Microsoft 365
15 39 (1.29%) AWS Lambda
16 31 (1.02%) AWS CloudFormation
17 28 (0.93%) PaaS
18 21 (0.69%) Apigee
Communications & Networking
1 676 (22.33%) Broadband
2 57 (1.88%) Firewall
3 46 (1.52%) TCP/IP
4 40 (1.32%) VPN
5 36 (1.19%) Network Security
6 32 (1.06%) DNS
6 32 (1.06%) LAN
7 26 (0.86%) WAN
8 24 (0.79%) DHCP
9 18 (0.59%) BGP
9 18 (0.59%) OSPF
10 15 (0.50%) Internet
10 15 (0.50%) Multicast
11 13 (0.43%) MPLS
12 11 (0.36%) ATM
13 9 (0.30%) IPsec
14 8 (0.26%) DKIM
14 8 (0.26%) DMARC
14 8 (0.26%) SMTP
14 8 (0.26%) Wi-Fi
Database & Business Intelligence
1 264 (8.72%) SQL Server
2 135 (4.46%) Amazon Athena
3 130 (4.29%) Apache Iceberg
4 129 (4.26%) Dremio
5 127 (4.20%) Data Lake
6 108 (3.57%) Apache Arrow
7 76 (2.51%) Apache Ignite
8 72 (2.38%) Big Data
9 71 (2.35%) NoSQL
10 57 (1.88%) Power BI
11 43 (1.42%) PostgreSQL
12 41 (1.35%) Data Warehouse
12 41 (1.35%) Metadata
13 39 (1.29%) Relational Database
14 38 (1.26%) Tableau
15 32 (1.06%) MongoDB
16 31 (1.02%) BigQuery
17 30 (0.99%) Amazon Redshift
18 29 (0.96%) Amazon RDS
19 22 (0.73%) DynamoDB
Development Applications
1 296 (9.78%) JIRA
2 239 (7.90%) GitLab
3 231 (7.63%) SonarQube
3 231 (7.63%) Sonatype Nexus
4 222 (7.33%) Maven
5 221 (7.30%) Cucumber
6 209 (6.90%) Selenium
7 198 (6.54%) Bitbucket
8 153 (5.05%) Git
9 91 (3.01%) Jenkins
10 27 (0.89%) Oracle Forms
10 27 (0.89%) webpack
11 21 (0.69%) JUnit
12 17 (0.56%) Cypress.io
13 16 (0.53%) TeamCity
14 14 (0.46%) Gradle
15 12 (0.40%) CircleCI
16 10 (0.33%) IBM UrbanCode
16 10 (0.33%) Octopus Deploy
17 9 (0.30%) Artifactory
General
1 1,960 (64.75%) Finance
2 919 (30.36%) Social Skills
3 683 (22.56%) Inclusion and Diversity
4 649 (21.44%) Analytical Skills
5 487 (16.09%) Financial Institution
6 481 (15.89%) Games
7 413 (13.64%) French Language
8 401 (13.25%) German Language
9 367 (12.12%) Investment Banking
10 259 (8.56%) Front Office
11 167 (5.52%) Retail
12 95 (3.14%) Retail Banking
13 94 (3.11%) Corporate Banking
14 72 (2.38%) Legal
15 61 (2.02%) Presentation Skills
16 53 (1.75%) Law
16 53 (1.75%) Telecoms
17 46 (1.52%) Marketing
18 28 (0.93%) Influencing Skills
19 27 (0.89%) Organisational Skills
Job Titles
1 659 (21.77%) Analyst
2 498 (16.45%) Software Engineer
3 475 (15.69%) Customer Service Advisor
4 397 (13.12%) Credit Analyst
5 394 (13.02%) Research Analyst
6 374 (12.36%) Senior
7 214 (7.07%) Developer
8 197 (6.51%) Lead
9 148 (4.89%) AWS Engineer
10 144 (4.76%) Architect
11 125 (4.13%) Python Engineer
12 120 (3.96%) Senior Software Engineer
13 112 (3.70%) AWS Software Engineer
14 111 (3.67%) Java Engineer
15 88 (2.91%) Java Software Engineer
16 77 (2.54%) Python Software Engineer
17 76 (2.51%) Solutions Architect
18 59 (1.95%) Senior Analyst
19 58 (1.92%) Developer/Software Engineer
20 57 (1.88%) Senior Java Engineer
Libraries, Frameworks & Software Standards
1 321 (10.60%) React
2 293 (9.68%) Spring Boot
3 284 (9.38%) Kafka
4 276 (9.12%) Spring
5 241 (7.96%) Redux
6 230 (7.60%) HTML
7 229 (7.57%) CSS
8 204 (6.74%) JPA
9 176 (5.81%) RESTful
10 127 (4.20%) Hibernate
11 121 (4.00%) REST
12 119 (3.93%) Jest
13 107 (3.53%) HTML5
14 105 (3.47%) CSS3
14 105 (3.47%) Pandas
15 104 (3.44%) NumPy
16 99 (3.27%) SciPy
17 97 (3.20%) Sass
18 96 (3.17%) PySpark
19 93 (3.07%) gRPC
Miscellaneous
1 565 (18.67%) Fixed Income
2 431 (14.24%) Credit Risk
3 339 (11.20%) Product Ownership
4 221 (7.30%) Enterprise Software
5 182 (6.01%) Foreign Exchange (FX)
6 161 (5.32%) Equities
7 147 (4.86%) Derivative
8 121 (4.00%) Hedge funds
9 113 (3.73%) Cloud Native
10 63 (2.08%) Algorithms
10 63 (2.08%) Management Information System
11 59 (1.95%) Public Cloud
12 51 (1.68%) Distributed Systems
13 42 (1.39%) Pricing Data
14 37 (1.22%) Self-Motivation
15 33 (1.09%) Mainframe
16 32 (1.06%) Greenfield Project
17 31 (1.02%) Legacy Systems
18 29 (0.96%) Mobile App
18 29 (0.96%) Onboarding
Operating Systems
1 153 (5.05%) Linux
2 118 (3.90%) Windows
3 66 (2.18%) Unix
4 45 (1.49%) Windows Server
5 28 (0.93%) Red Hat Enterprise Linux
6 26 (0.86%) zOS
7 21 (0.69%) Android
8 18 (0.59%) Windows 10
9 16 (0.53%) CentOS
10 14 (0.46%) Apple iOS
11 13 (0.43%) Windows Server 2016
12 10 (0.33%) Rocky
12 10 (0.33%) Windows Server 2019
13 9 (0.30%) Windows Server 2012
14 5 (0.17%) AIX
15 4 (0.13%) Ubuntu
16 2 (0.066%) CoreOS
16 2 (0.066%) Solaris
17 1 (0.033%) Debian
17 1 (0.033%) Windows Server 2008
Processes & Methodologies
1 913 (30.16%) Agile
2 759 (25.07%) Problem-Solving
3 671 (22.17%) Software Engineering
4 638 (21.08%) Asset Management
5 572 (18.90%) Risk Management
6 571 (18.86%) Customer Service
7 516 (17.05%) Decision-Making
8 501 (16.55%) DevOps
9 447 (14.77%) CI/CD
10 446 (14.73%) Business Strategy
11 421 (13.91%) Portfolio Management
12 419 (13.84%) Risk Assessment
13 411 (13.58%) Microservices
14 401 (13.25%) Financial Modelling
15 395 (13.05%) Credit Risk Analysis
16 355 (11.73%) Containerisation
17 343 (11.33%) Test Automation
18 296 (9.78%) Analytics
19 289 (9.55%) Mentoring
20 283 (9.35%) SDLC
Programming Languages
1 651 (21.51%) Java
2 568 (18.76%) SQL
3 485 (16.02%) Python
4 438 (14.47%) JavaScript
5 246 (8.13%) TypeScript
6 105 (3.47%) C#
7 73 (2.41%) Bash
8 51 (1.68%) PowerShell
9 50 (1.65%) Go
10 48 (1.59%) C++
11 26 (0.86%) Kotlin
12 25 (0.83%) C
13 19 (0.63%) PL/SQL
14 18 (0.59%) T-SQL
15 15 (0.50%) R
16 13 (0.43%) Perl
17 10 (0.33%) Groovy
17 10 (0.33%) Scala
18 9 (0.30%) Rust
19 8 (0.26%) JCL
Qualifications
1 686 (22.66%) Degree
2 456 (15.06%) Master's Degree
3 395 (13.05%) CFA
4 51 (1.68%) Azure Certification
5 45 (1.49%) Cisco Certification
6 36 (1.19%) AWS Certification
7 32 (1.06%) CISSP
7 32 (1.06%) PhD
8 29 (0.96%) CCNP
9 27 (0.89%) CISA
10 25 (0.83%) Microsoft Certification
11 23 (0.76%) CCNA
11 23 (0.76%) PMP
12 21 (0.69%) Computer Science Degree
12 21 (0.69%) PMI Certification
13 16 (0.53%) CCIE
14 14 (0.46%) VMware Certified Professional (VCP)
15 12 (0.40%) CISM
15 12 (0.40%) CRISC
16 10 (0.33%) MCSE
Quality Assurance & Compliance
1 264 (8.72%) QA
2 120 (3.96%) Accessibility
3 45 (1.49%) Data Quality
4 31 (1.02%) SLA
5 28 (0.93%) GDPR
6 26 (0.86%) ITGC
7 19 (0.63%) Sarbanes-Oxley
8 16 (0.53%) NIST
9 13 (0.43%) ISO/IEC 27001
10 11 (0.36%) PCI DSS
11 10 (0.33%) Basel III
11 10 (0.33%) GRC
11 10 (0.33%) IFRS
11 10 (0.33%) IFRS 9
12 8 (0.26%) Dodd-Frank
13 7 (0.23%) Basel II
13 7 (0.23%) COBIT
13 7 (0.23%) NIST 800
13 7 (0.23%) SOC 2
14 5 (0.17%) HIPAA
System Software
1 388 (12.82%) Docker
2 38 (1.26%) Active Directory
3 33 (1.09%) VMware Infrastructure
4 28 (0.93%) Virtual Machines
5 24 (0.79%) Hyper-V
6 15 (0.50%) VMware ESXi
7 5 (0.17%) Apache Flume
7 5 (0.17%) VMware NSX
8 4 (0.13%) Virtual Desktop
8 4 (0.13%) vSphere
9 3 (0.099%) Firmware
10 2 (0.066%) Time Sharing Option
11 1 (0.033%) HDFS
11 1 (0.033%) KVM
11 1 (0.033%) NFS
11 1 (0.033%) Virtual Servers
Systems Management
1 429 (14.17%) Kubernetes
2 128 (4.23%) Terraform
3 62 (2.05%) Ansible
4 31 (1.02%) Grafana
5 30 (0.99%) SCCM
6 24 (0.79%) Prometheus
7 23 (0.76%) Istio
7 23 (0.76%) Nagios
8 16 (0.53%) Progress Chef
9 14 (0.46%) Microsoft Intune
10 11 (0.36%) SCOM
11 10 (0.33%) NetBackup
12 9 (0.30%) Puppet
13 8 (0.26%) Single Sign-On
14 7 (0.23%) Tivoli Storage Manager
15 5 (0.17%) Argo
15 5 (0.17%) HP Fortify
15 5 (0.17%) Oozie
16 4 (0.13%) RSA Archer
16 4 (0.13%) vCenter Server
Vendors
1 676 (22.33%) BT
2 417 (13.78%) Bloomberg
3 201 (6.64%) Solace
4 185 (6.11%) Microsoft
5 101 (3.34%) Google
6 87 (2.87%) Oracle
7 62 (2.05%) IBM
8 57 (1.88%) VMware
9 50 (1.65%) Cisco
10 37 (1.22%) SolarWinds
11 34 (1.12%) Databricks
12 32 (1.06%) ServiceNow
13 26 (0.86%) Red Hat
14 24 (0.79%) CheckPoint
15 23 (0.76%) Fortinet
16 20 (0.66%) Arista
16 20 (0.66%) SAP
17 17 (0.56%) Reuters
18 16 (0.53%) F5
19 14 (0.46%) Splunk