Internet Jobs in England

Internet
UK > England

The table below provides summary statistics for permanent job vacancies advertised in England requiring Internet skills. It includes a benchmarking guide to the annual salaries offered in vacancies that cited Internet over the 6 months leading up to 11 May 2025, comparing them to the same period in the previous two years.

6 months to
11 May 2025
Same period 2024 Same period 2023
Rank 418 228 302
Rank change year-on-year -190 +74 -59
Permanent jobs citing Internet 288 1,038 1,044
As % of all permanent jobs advertised in England 0.60% 1.21% 1.16%
As % of the Communications & Networking category 4.11% 8.59% 7.41%
Number of salaries quoted 183 803 590
10th Percentile £26,325 £26,750 £29,000
25th Percentile £33,299 £35,000 £36,344
Median annual salary (50th Percentile) £45,000 £51,000 £52,500
Median % change year-on-year -11.76% -2.86% -4.55%
75th Percentile £64,375 £68,750 £75,294
90th Percentile £81,250 £80,000 £92,500
UK median annual salary £45,000 £50,000 £52,500
% change year-on-year -10.00% -4.76% -4.55%

All Communications and Computer Networking Skills
England

Internet falls under the Communications and Computer Networking category. For comparison with the information above, the following table provides summary statistics for all permanent job vacancies requiring communications or computer networking skills in England.

Permanent vacancies with a requirement for communications or computer networking skills 7,014 12,079 14,097
As % of all permanent jobs advertised in England 14.50% 14.07% 15.67%
Number of salaries quoted 3,767 8,538 7,276
10th Percentile £25,087 £26,250 £27,750
25th Percentile £31,250 £32,500 £35,192
Median annual salary (50th Percentile) £47,500 £47,500 £50,000
Median % change year-on-year - -5.00% -4.76%
75th Percentile £67,500 £62,500 £70,000
90th Percentile £85,000 £77,500 £87,500
UK median annual salary £45,074 £47,500 £50,000
% change year-on-year -5.11% -5.00% -4.76%

Internet
Job Vacancy Trend in England

Job postings citing Internet as a proportion of all IT jobs advertised in England.
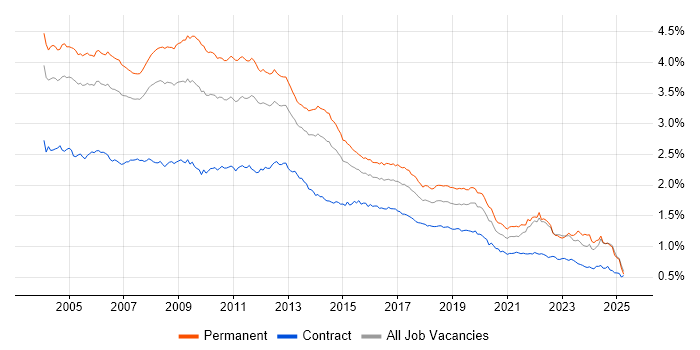
Job vacancy trend for Internet in England

Internet
Salary Trend in England

3-month moving average salary quoted in jobs citing Internet in England.

Salary trend for Internet in England

Internet
Salary Histogram in England

Salary distribution for jobs citing Internet in England over the 6 months to 11 May 2025.

Salary histogram for Internet in England

Internet
Job Locations in England

The table below looks at the demand and provides a guide to the median salaries quoted in IT jobs citing Internet within the England region over the 6 months to 11 May 2025. The 'Rank Change' column provides an indication of the change in demand within each location based on the same 6 month period last year.

Location Rank Change
on Same Period
Last Year
Matching
Permanent
IT Job Ads
Median Salary
Past 6 Months
Median Salary
% Change
on Same Period
Last Year
Live
Jobs
London -60 87 £52,500 -19.23% 598
South East -11 60 £40,000 -20.00% 197
North of England -98 56 £47,500 +5.56% 124
Midlands -11 43 £54,000 +54.29% 61
West Midlands +50 31 £53,688 +53.39% 36
Yorkshire +11 27 £37,500 -11.76% 49
North West -98 27 £56,250 +25.00% 69
South West +52 24 £45,000 -14.29% 44
East of England -50 16 £62,000 +12.73% 39
East Midlands -19 12 £57,000 +62.86% 20
North East +25 2 £33,198 -52.58% 12
Internet
UK

Internet
Co-occurring Skills and Capabilities in England by Category

The follow tables expand on the table above by listing co-occurrences grouped by category. The same employment type, locality and period is covered with up to 20 co-occurrences shown in each of the following categories:

Application Platforms
1 27 (9.38%) Microsoft Exchange
2 16 (5.56%) Confluence
3 11 (3.82%) SharePoint
4 7 (2.43%) CMS
4 7 (2.43%) SAS
5 5 (1.74%) IBM Domino
5 5 (1.74%) WordPress
6 3 (1.04%) IIS
7 2 (0.69%) Apache Airflow
8 1 (0.35%) Mendix
Applications
1 46 (15.97%) Microsoft Office
2 11 (3.82%) Microsoft Excel
3 8 (2.78%) Microsoft PowerPoint
4 5 (1.74%) SPSS
5 1 (0.35%) FrameMaker
5 1 (0.35%) MadCap Flare
5 1 (0.35%) Microsoft Project
Business Applications
1 9 (3.13%) Magento
1 9 (3.13%) NetSuite
1 9 (3.13%) Payment Gateway
2 2 (0.69%) Dynamics CRM
Cloud Services
1 59 (20.49%) Azure
2 51 (17.71%) Microsoft 365
3 35 (12.15%) AWS
4 23 (7.99%) SaaS
5 15 (5.21%) Entra ID
6 11 (3.82%) Cloud Computing
6 11 (3.82%) Google Analytics
7 10 (3.47%) Microsoft Purview
8 9 (3.13%) Salesforce Commerce Cloud
9 7 (2.43%) Amazon EC2
10 6 (2.08%) Amazon S3
10 6 (2.08%) Azure Sentinel
10 6 (2.08%) Power Platform
10 6 (2.08%) Serverless
11 5 (1.74%) Adobe Creative Cloud
11 5 (1.74%) Figma
11 5 (1.74%) GCP
11 5 (1.74%) Kibo
12 4 (1.39%) AWS CloudFormation
12 4 (1.39%) AWS Lambda
Communications & Networking
1 66 (22.92%) WAN
2 65 (22.57%) LAN
3 48 (16.67%) Network Security
4 43 (14.93%) Firewall
4 43 (14.93%) Wireless
5 29 (10.07%) WLAN
6 28 (9.72%) Wi-Fi
7 22 (7.64%) TCP/IP
8 21 (7.29%) VPN
9 17 (5.90%) SMTP
10 13 (4.51%) DNS
11 11 (3.82%) Broadband
12 10 (3.47%) DKIM
12 10 (3.47%) DMARC
12 10 (3.47%) DNSSEC
13 9 (3.13%) HTTP
14 8 (2.78%) VoIP
15 7 (2.43%) FTP
15 7 (2.43%) Intranet
15 7 (2.43%) MPLS
Database & Business Intelligence
1 21 (7.29%) MySQL
2 10 (3.47%) Relational Database
3 9 (3.13%) PostgreSQL
4 7 (2.43%) Amazon RDS
5 6 (2.08%) NoSQL
5 6 (2.08%) Power BI
6 5 (1.74%) Apache Hive
6 5 (1.74%) Hadoop
7 4 (1.39%) Big Data
7 4 (1.39%) SQL Server
8 2 (0.69%) Data Warehouse
8 2 (0.69%) EDMS
8 2 (0.69%) Elasticsearch
8 2 (0.69%) GIS
8 2 (0.69%) Redis
9 1 (0.35%) Amazon Aurora
9 1 (0.35%) MongoDB
9 1 (0.35%) Pentaho
9 1 (0.35%) SQLite
Development Applications
1 7 (2.43%) JIRA
2 6 (2.08%) Git
3 4 (1.39%) Jenkins
4 3 (1.04%) GitLab
5 2 (0.69%) Burp Suite
5 2 (0.69%) Metasploit
6 1 (0.35%) Bitbucket
6 1 (0.35%) Cypress.io
6 1 (0.35%) Jasmine
6 1 (0.35%) Karma Test Runner
6 1 (0.35%) Robot Framework
6 1 (0.35%) SonarQube
6 1 (0.35%) TeamCity
General
1 60 (20.83%) Social Skills
2 36 (12.50%) Finance
3 31 (10.76%) Inclusion and Diversity
4 27 (9.38%) Telecoms
5 21 (7.29%) Analytical Skills
6 20 (6.94%) Marketing
7 16 (5.56%) Manufacturing
8 15 (5.21%) Banking
9 13 (4.51%) Organisational Skills
10 10 (3.47%) Advertising
10 10 (3.47%) Aerospace
11 9 (3.13%) Retail
12 7 (2.43%) Games
13 6 (2.08%) Automotive
13 6 (2.08%) Legal
13 6 (2.08%) Presentation Skills
14 5 (1.74%) Billing
14 5 (1.74%) Law
14 5 (1.74%) Local Government
14 5 (1.74%) Police
Job Titles
1 61 (21.18%) IT Support
2 42 (14.58%) IT Engineer
3 41 (14.24%) Support Engineer
4 40 (13.89%) IT Support Engineer
5 31 (10.76%) Senior
6 30 (10.42%) Analyst
7 29 (10.07%) Lead
8 19 (6.60%) Infrastructure Support
8 19 (6.60%) Network Support
9 18 (6.25%) IT Manager
10 17 (5.90%) Infrastructure Engineer
11 15 (5.21%) Developer
12 12 (4.17%) IT Analyst
13 11 (3.82%) Lead Infrastructure Engineer
14 9 (3.13%) Architect
14 9 (3.13%) Magento Developer
14 9 (3.13%) Senior Developer
14 9 (3.13%) Senior Magento Developer
15 8 (2.78%) Support Analyst
15 8 (2.78%) Trainee
Libraries, Frameworks & Software Standards
1 22 (7.64%) HTML
2 19 (6.60%) CSS
3 11 (3.82%) 802.1X
4 10 (3.47%) XML
5 7 (2.43%) LDAP
5 7 (2.43%) React
6 6 (2.08%) .NET
6 6 (2.08%) AngularJS
7 5 (1.74%) Vue
8 4 (1.39%) .NET Core
8 4 (1.39%) Laravel
8 4 (1.39%) Symfony
9 3 (1.04%) Kafka
9 3 (1.04%) Middleware
10 2 (0.69%) Android SDK
10 2 (0.69%) Django
10 2 (0.69%) HTML5
10 2 (0.69%) REST
10 2 (0.69%) Spring
10 2 (0.69%) Web Services
Miscellaneous
1 32 (11.11%) Driving Licence
2 25 (8.68%) IoT
3 21 (7.29%) Virtual Team
4 17 (5.90%) Management Information System
5 14 (4.86%) Security Operations Centre
6 13 (4.51%) Cloud Native
7 12 (4.17%) Social Media
8 11 (3.82%) Client/Server
9 9 (3.13%) Onboarding
9 9 (3.13%) Self-Motivation
10 8 (2.78%) Mobile App
10 8 (2.78%) Social Network
11 7 (2.43%) Enterprise Software
12 6 (2.08%) Data Centre
13 5 (1.74%) Cyber Threat
13 5 (1.74%) PKI
14 4 (1.39%) Greenfield Project
15 3 (1.04%) CCTV
15 3 (1.04%) Low-Code
15 3 (1.04%) Private Cloud
Operating Systems
1 108 (37.50%) Windows
2 41 (14.24%) Linux
3 18 (6.25%) Windows Server
4 11 (3.82%) Android
5 8 (2.78%) Windows 10
6 7 (2.43%) Apple iOS
7 6 (2.08%) Mac OS
8 3 (1.04%) VMS
9 2 (0.69%) Unix
9 2 (0.69%) Windows 7
9 2 (0.69%) Windows Server 2012
10 1 (0.35%) Debian
10 1 (0.35%) Windows Vista
Processes & Methodologies
1 73 (25.35%) Problem-Solving
2 54 (18.75%) ITIL
3 45 (15.63%) Computer Science
4 42 (14.58%) Mentoring
5 33 (11.46%) Cybersecurity
6 32 (11.11%) Network Management
7 30 (10.42%) Asset Management
8 29 (10.07%) Customer Service
8 29 (10.07%) IT Asset Management
9 28 (9.72%) Analytics
10 20 (6.94%) Agile
11 19 (6.60%) Infrastructure Engineering
11 19 (6.60%) Security Operations
12 18 (6.25%) Continuous Improvement
13 17 (5.90%) B2B
13 17 (5.90%) Roadmaps
13 17 (5.90%) User Experience
14 16 (5.56%) E-Commerce
14 16 (5.56%) IT Strategy
15 15 (5.21%) CRM
Programming Languages
1 28 (9.72%) Python
2 21 (7.29%) JavaScript
3 17 (5.90%) PowerShell
4 16 (5.56%) SQL
5 15 (5.21%) PHP
6 12 (4.17%) C#
7 11 (3.82%) Bash
8 7 (2.43%) C++
8 7 (2.43%) Perl
8 7 (2.43%) R
9 6 (2.08%) Go
10 5 (1.74%) MATLAB
11 2 (0.69%) Java
11 2 (0.69%) Progress 4GL
11 2 (0.69%) TypeScript
11 2 (0.69%) VBScript
12 1 (0.35%) C
12 1 (0.35%) Ruby
12 1 (0.35%) Rust
Qualifications
1 88 (30.56%) Degree
2 41 (14.24%) Computer Science Degree
3 40 (13.89%) Cisco Certification
4 35 (12.15%) CCNA
5 34 (11.81%) CCNP
6 29 (10.07%) Microsoft Certification
7 28 (9.72%) LPIC
7 28 (9.72%) MCP
7 28 (9.72%) MCSE
8 22 (7.64%) Master's Degree
9 19 (6.60%) MBA
10 18 (6.25%) Security Cleared
11 17 (5.90%) SC Cleared
12 10 (3.47%) DV Cleared
13 6 (2.08%) DBS Check
14 4 (1.39%) ACCA
14 4 (1.39%) AWS Certification
14 4 (1.39%) CIMA
14 4 (1.39%) CompTIA Security+
15 3 (1.04%) CISSP
Quality Assurance & Compliance
1 4 (1.39%) GMP
1 4 (1.39%) ISO/IEC 27001
1 4 (1.39%) NIST
2 3 (1.04%) NCSC
2 3 (1.04%) QA
2 3 (1.04%) SLA
3 2 (0.69%) Actionable Recommendations
3 2 (0.69%) GDPR
4 1 (0.35%) Accessibility
4 1 (0.35%) ISO 9001
4 1 (0.35%) PCI DSS
System Software
1 32 (11.11%) Active Directory
2 21 (7.29%) Docker
3 9 (3.13%) Firmware
4 5 (1.74%) Terminal Services
5 3 (1.04%) Virtual Servers
6 2 (0.69%) Hyper-V
6 2 (0.69%) Virtual Machines
6 2 (0.69%) VMware Infrastructure
7 1 (0.35%) Virtual Desktop
7 1 (0.35%) VMware NSX
7 1 (0.35%) VMware Workstation
Systems Management
1 10 (3.47%) Terraform
2 9 (3.13%) Microsoft Intune
2 9 (3.13%) QRadar
3 8 (2.78%) WSUS
4 7 (2.43%) Kubernetes
5 3 (1.04%) Ansible
5 3 (1.04%) Graylog
6 2 (0.69%) AWS Copilot
6 2 (0.69%) Nessus
6 2 (0.69%) Nmap
6 2 (0.69%) SCCM
7 1 (0.35%) Computer Emergency Response Teams
7 1 (0.35%) Failover Clustering
7 1 (0.35%) FortiGate
7 1 (0.35%) Microsoft Clustering
7 1 (0.35%) SCOM
Vendors
1 136 (47.22%) Microsoft
2 61 (21.18%) Cisco
3 19 (6.60%) Google
3 19 (6.60%) Unisys
4 16 (5.56%) Apple
5 15 (5.21%) Adobe
6 11 (3.82%) VMware
7 10 (3.47%) IronPort
7 10 (3.47%) Meraki
7 10 (3.47%) New Relic
7 10 (3.47%) Veritas
8 9 (3.13%) Splunk
9 8 (2.78%) Oracle
10 7 (2.43%) HubSpot
11 6 (2.08%) Juniper
12 5 (1.74%) Fortinet
12 5 (1.74%) Vertica
13 4 (1.39%) HP
13 4 (1.39%) Zscaler
14 3 (1.04%) TP-LINK