Performance Tuning Jobs in England

Performance Tuning
UK > England

The table below provides summary statistics for permanent job vacancies advertised in England requiring Performance Tuning skills. It includes a benchmarking guide to the annual salaries offered in vacancies that cited Performance Tuning over the 6 months leading up to 28 May 2025, comparing them to the same period in the previous two years.

6 months to
28 May 2025
Same period 2024 Same period 2023
Rank 446 388 369
Rank change year-on-year -58 -19 +22
Permanent jobs citing Performance Tuning 249 560 775
As % of all permanent jobs advertised in England 0.51% 0.63% 0.89%
As % of the Processes & Methodologies category 0.55% 0.75% 0.93%
Number of salaries quoted 182 381 395
10th Percentile £41,375 £41,250 £38,664
25th Percentile £52,500 £52,500 £46,750
Median annual salary (50th Percentile) £63,750 £59,000 £60,000
Median % change year-on-year +8.05% -1.67% -4.00%
75th Percentile £82,500 £80,000 £81,250
90th Percentile £97,500 £102,500 £108,750
UK median annual salary £62,500 £57,500 £60,000
% change year-on-year +8.70% -4.17% -4.00%

All Process and Methodology Skills
England

Performance Tuning falls under the Processes and Methodologies category. For comparison with the information above, the following table provides summary statistics for all permanent job vacancies requiring process or methodology skills in England.

Permanent vacancies with a requirement for process or methodology skills 45,477 74,482 83,229
As % of all permanent jobs advertised in England 94.01% 84.24% 95.56%
Number of salaries quoted 22,533 54,432 49,691
10th Percentile £29,625 £29,000 £34,375
25th Percentile £41,250 £40,000 £46,105
Median annual salary (50th Percentile) £57,500 £55,000 £62,500
Median % change year-on-year +4.55% -12.00% +4.17%
75th Percentile £75,000 £72,500 £82,500
90th Percentile £98,695 £93,750 £102,500
UK median annual salary £57,500 £55,000 £61,000
% change year-on-year +4.55% -9.84% +1.67%

Performance Tuning
Job Vacancy Trend in England

Job postings citing Performance Tuning as a proportion of all IT jobs advertised in England.
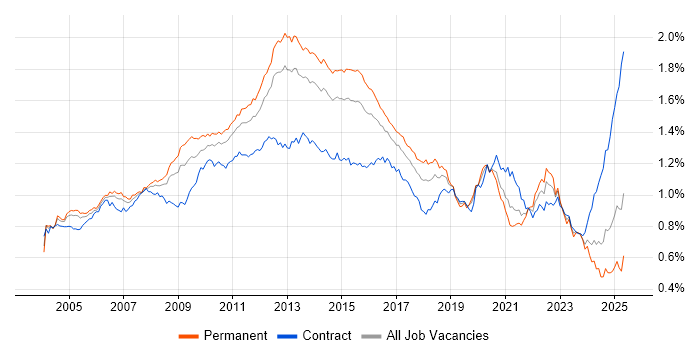
Job vacancy trend for Performance Tuning in England

Performance Tuning
Salary Trend in England

3-month moving average salary quoted in jobs citing Performance Tuning in England.

Salary trend for Performance Tuning in England

Performance Tuning
Salary Histogram in England

Salary distribution for jobs citing Performance Tuning in England over the 6 months to 28 May 2025.

Salary histogram for Performance Tuning in England

Performance Tuning
Job Locations in England

The table below looks at the demand and provides a guide to the median salaries quoted in IT jobs citing Performance Tuning within the England region over the 6 months to 28 May 2025. The 'Rank Change' column provides an indication of the change in demand within each location based on the same 6 month period last year.

Location Rank Change
on Same Period
Last Year
Matching
Permanent
IT Job Ads
Median Salary
Past 6 Months
Median Salary
% Change
on Same Period
Last Year
Live
Jobs
London +53 116 £75,000 -4.46% 189
Midlands +21 37 £52,500 -8.70% 24
North of England -53 36 £62,500 +8.70% 64
West Midlands +52 35 £52,500 -12.50% 15
South East +24 33 £65,000 +13.04% 55
North West -53 19 £62,500 +13.64% 36
South West +92 15 £57,000 -0.87% 16
Yorkshire +45 14 £60,000 +23.69% 23
East of England +35 6 £57,500 - 20
North East +22 3 £60,000 +4.35% 6
East Midlands +12 2 £48,750 -15.22% 8
Performance Tuning
UK

Performance Tuning
Co-occurring Skills and Capabilities in England by Category

The follow tables expand on the table above by listing co-occurrences grouped by category. The same employment type, locality and period is covered with up to 20 co-occurrences shown in each of the following categories:

Application Platforms
1 23 (9.24%) Microsoft Exchange
2 14 (5.62%) Apache Spark
3 9 (3.61%) IIS
4 7 (2.81%) Apache
5 4 (1.61%) CMS
5 4 (1.61%) Confluence
5 4 (1.61%) nginx
6 3 (1.20%) Apache Airflow
6 3 (1.20%) GemFire
7 1 (0.40%) Appian
7 1 (0.40%) CICS
7 1 (0.40%) Cloud Foundry
7 1 (0.40%) SharePoint
Applications
1 20 (8.03%) Microsoft Excel
2 12 (4.82%) Microsoft Office
3 2 (0.80%) Mozilla Thunderbird
3 2 (0.80%) MS Visio
4 1 (0.40%) Chatbot
Business Applications
1 7 (2.81%) Oracle EBS
2 5 (2.01%) Oracle Applications
3 4 (1.61%) Fidessa
4 3 (1.20%) SAP S/4HANA
5 2 (0.80%) Dynamics CRM
5 2 (0.80%) Endur
Cloud Services
1 115 (46.18%) Azure
2 72 (28.92%) AWS
3 56 (22.49%) Power Platform
4 27 (10.84%) SaaS
5 23 (9.24%) Serverless
6 22 (8.84%) GCP
7 21 (8.43%) Azure Data Factory
8 18 (7.23%) AWS Lambda
9 17 (6.83%) AWS CloudFormation
10 16 (6.43%) Azure DevOps
10 16 (6.43%) GitHub
11 15 (6.02%) Amazon S3
12 14 (5.62%) AWS KMS
13 13 (5.22%) Google Workspace
14 10 (4.02%) Azure Monitor
14 10 (4.02%) Power Automate
14 10 (4.02%) Snowflake
15 8 (3.21%) Datadog
15 8 (3.21%) Microsoft 365
16 7 (2.81%) Amazon CloudWatch
Communications & Networking
1 23 (9.24%) Firewall
2 21 (8.43%) DNS
2 21 (8.43%) Network Security
3 17 (6.83%) TCP/IP
4 16 (6.43%) DHCP
5 13 (5.22%) BGP
5 13 (5.22%) OSPF
5 13 (5.22%) VLAN
6 12 (4.82%) WLAN
7 7 (2.81%) SAN
8 6 (2.41%) VPN
9 5 (2.01%) NAS
10 4 (1.61%) NetScaler
11 2 (0.80%) FTP
11 2 (0.80%) HTTP
11 2 (0.80%) IMAP
11 2 (0.80%) SMTP
11 2 (0.80%) SNMP
11 2 (0.80%) SSH
11 2 (0.80%) WAN
Database & Business Intelligence
1 76 (30.52%) SQL Server
2 55 (22.09%) Power BI
3 30 (12.05%) SQL Server Reporting Services
4 28 (11.24%) Data Warehouse
5 25 (10.04%) SQL Server Integration Services
6 21 (8.43%) Data Hub
6 21 (8.43%) SQL CLR
7 18 (7.23%) SQL Server Analysis Services
8 15 (6.02%) Azure SQL Database
8 15 (6.02%) PostgreSQL
9 14 (5.62%) Big Data
10 12 (4.82%) Metadata
10 12 (4.82%) NoSQL
11 11 (4.42%) Data Lake
11 11 (4.42%) MongoDB
12 9 (3.61%) Oracle Database
12 9 (3.61%) Relational Database
13 7 (2.81%) Oracle Exadata
14 5 (2.01%) Amazon RDS
14 5 (2.01%) Redis
Development Applications
1 22 (8.84%) Git
2 13 (5.22%) JIRA
3 10 (4.02%) Visual Studio
4 6 (2.41%) Jenkins
5 2 (0.80%) Fiddler
5 2 (0.80%) GitLab
5 2 (0.80%) IDA Disassembler
5 2 (0.80%) Vagrant
6 1 (0.40%) Bitbucket
6 1 (0.40%) Cypress.io
6 1 (0.40%) NUnit
6 1 (0.40%) Oracle APEX
6 1 (0.40%) Selenium
6 1 (0.40%) Subversion
General
1 91 (36.55%) Social Skills
2 76 (30.52%) Finance
3 33 (13.25%) Analytical Skills
4 25 (10.04%) Retail
5 24 (9.64%) Law
6 21 (8.43%) Back Office
6 21 (8.43%) Banking
7 12 (4.82%) Automotive
8 10 (4.02%) Front Office
8 10 (4.02%) Inclusion and Diversity
9 9 (3.61%) Legal
9 9 (3.61%) Public Sector
10 7 (2.81%) Retail Banking
11 6 (2.41%) Advertising
11 6 (2.41%) Documentation Skills
12 5 (2.01%) Investment Banking
13 4 (1.61%) Marketing
14 3 (1.20%) Music Industry
15 2 (0.80%) Organisational Skills
15 2 (0.80%) Presentation Skills
Job Titles
1 63 (25.30%) Developer
2 59 (23.69%) Senior
3 32 (12.85%) Lead
4 27 (10.84%) Architect
5 22 (8.84%) DBA
5 22 (8.84%) Senior Developer
6 21 (8.43%) SQL Developer
7 18 (7.23%) Software Engineer
8 15 (6.02%) IT Engineer
9 14 (5.62%) AWS Architect
9 14 (5.62%) Cloud Architect
10 13 (5.22%) Microsoft Developer
10 13 (5.22%) Senior Microsoft Developer
10 13 (5.22%) Systems Engineer
11 12 (4.82%) SaaS Developer
11 12 (4.82%) Senior SQL Developer
11 12 (4.82%) SQL DBA
12 11 (4.42%) Analyst
12 11 (4.42%) Data Engineer
12 11 (4.42%) Infrastructure Engineer
Libraries, Frameworks & Software Standards
1 41 (16.47%) .NET
2 31 (12.45%) Kafka
3 23 (9.24%) .NET Framework
4 22 (8.84%) .NET Core
5 17 (6.83%) AngularJS
6 16 (6.43%) Elastic Stack
6 16 (6.43%) Entity Framework
7 14 (5.62%) RESTful
8 12 (4.82%) Middleware
8 12 (4.82%) REST
9 11 (4.42%) Pandas
10 10 (4.02%) ASP.NET
10 10 (4.02%) Dapper ORM
11 9 (3.61%) GraphQL
12 8 (3.21%) HTML
12 8 (3.21%) React
13 7 (2.81%) Hugging Face
13 7 (2.81%) Oracle Fusion
13 7 (2.81%) Oracle GoldenGate
14 6 (2.41%) LangChain
Miscellaneous
1 29 (11.65%) Management Information System
2 28 (11.24%) Cloud Native
3 22 (8.84%) Private Cloud
4 21 (8.43%) Data Structures
5 19 (7.63%) Algorithms
6 17 (6.83%) Fixed Income
7 15 (6.02%) Distributed Systems
8 12 (4.82%) Smartphone
9 11 (4.42%) Foreign Exchange (FX)
10 10 (4.02%) Replication
11 9 (3.61%) Team-Oriented Environment
12 8 (3.21%) Public Cloud
13 7 (2.81%) Greenfield Project
14 6 (2.41%) Hedge funds
15 5 (2.01%) Clustering
15 5 (2.01%) Hybrid Cloud
16 4 (1.61%) Enterprise Storage
17 3 (1.20%) Data Protection Act
17 3 (1.20%) Derivative
17 3 (1.20%) Embedded Systems
Operating Systems
1 50 (20.08%) Linux
2 43 (17.27%) Windows
3 32 (12.85%) Windows Server
4 17 (6.83%) Windows Server 2016
5 15 (6.02%) Ubuntu
6 14 (5.62%) Windows Server 2019
7 12 (4.82%) Mac OS X
7 12 (4.82%) Windows 10
8 11 (4.42%) Unix
9 7 (2.81%) Red Hat Enterprise Linux
10 2 (0.80%) Amazon Linux
10 2 (0.80%) VMS
11 1 (0.40%) Android
11 1 (0.40%) Apple iOS
11 1 (0.40%) Solaris
11 1 (0.40%) Windows Server 2012
11 1 (0.40%) zOS
Processes & Methodologies
1 68 (27.31%) Problem-Solving
2 63 (25.30%) High Availability
3 59 (23.69%) CI/CD
4 57 (22.89%) Business Intelligence
5 54 (21.69%) Agile
5 54 (21.69%) Computer Science
6 53 (21.29%) DevOps
6 53 (21.29%) Mentoring
7 52 (20.88%) Software Engineering
8 40 (16.06%) Migration
9 38 (15.26%) Data Modelling
9 38 (15.26%) Infrastructure Engineering
10 36 (14.46%) ETL
11 34 (13.65%) Design Patterns
12 33 (13.25%) Microservices
13 32 (12.85%) Containerisation
14 29 (11.65%) Technical Leadership
15 27 (10.84%) Data Privacy
15 27 (10.84%) Fintech
16 26 (10.44%) Analytics
Programming Languages
1 145 (58.23%) SQL
2 58 (23.29%) Python
3 45 (18.07%) C#
4 41 (16.47%) PowerShell
5 40 (16.06%) Java
6 30 (12.05%) T-SQL
7 20 (8.03%) Bash
8 13 (5.22%) Data Analysis Expressions
9 12 (4.82%) PL/SQL
10 11 (4.42%) JavaScript
11 6 (2.41%) C++
12 5 (2.01%) Shell Script
13 4 (1.61%) TypeScript
14 2 (0.80%) C
14 2 (0.80%) Go
14 2 (0.80%) Groovy
14 2 (0.80%) Perl
15 1 (0.40%) ABAP
15 1 (0.40%) COBOL
15 1 (0.40%) PHP
Qualifications
1 61 (24.50%) Degree
2 45 (18.07%) Computer Science Degree
3 25 (10.04%) AWS Certification
4 24 (9.64%) Security Cleared
5 22 (8.84%) AWS Certified Solutions Architect
6 19 (7.63%) SC Cleared
7 16 (6.43%) Microsoft Certification
8 12 (4.82%) HNC
8 12 (4.82%) HND
8 12 (4.82%) MCSE
9 11 (4.42%) Azure Certification
10 8 (3.21%) Master's Degree
11 6 (2.41%) Numerate Degree
11 6 (2.41%) OCP
11 6 (2.41%) Oracle Certification
12 5 (2.01%) OCA
13 4 (1.61%) TOGAF Certification
14 2 (0.80%) CCNP
14 2 (0.80%) Cisco Certification
14 2 (0.80%) VMware Certified Professional (VCP)
Quality Assurance & Compliance
1 24 (9.64%) GDPR
2 16 (6.43%) HIPAA
3 13 (5.22%) QA
4 10 (4.02%) Accessibility
4 10 (4.02%) Data Quality
5 8 (3.21%) ISO 9001
5 8 (3.21%) ISO/IEC 27001
6 4 (1.61%) SOC 2
7 1 (0.40%) Cyber Essentials
7 1 (0.40%) NCSC
7 1 (0.40%) NIST
7 1 (0.40%) PCI DSS
7 1 (0.40%) SLA
System Software
1 33 (13.25%) VMware Infrastructure
2 31 (12.45%) Docker
3 22 (8.84%) Active Directory
4 8 (3.21%) Hyper-V
4 8 (3.21%) VMware ESXi
5 6 (2.41%) Virtual Machines
6 4 (1.61%) vSphere
7 2 (0.80%) DFS Replication
7 2 (0.80%) Dovecot
7 2 (0.80%) Postfix
7 2 (0.80%) Squid
8 1 (0.40%) ACF2
8 1 (0.40%) Firmware
8 1 (0.40%) Job Entry Subsystem
8 1 (0.40%) RACF
8 1 (0.40%) Virtual Servers
Systems Management
1 37 (14.86%) Grafana
2 36 (14.46%) Prometheus
3 33 (13.25%) Kubernetes
4 29 (11.65%) Terraform
5 12 (4.82%) Failover Clustering
6 11 (4.42%) Ansible
7 8 (3.21%) Oracle RMAN
7 8 (3.21%) vCenter Server
8 6 (2.41%) Microsoft Intune
9 5 (2.01%) Single Sign-On
10 4 (1.61%) Puppet
10 4 (1.61%) SCCM
10 4 (1.61%) SCOM
11 3 (1.20%) Progress Chef
12 2 (0.80%) HAProxy
12 2 (0.80%) Istio
12 2 (0.80%) linkerd
12 2 (0.80%) Nessus
12 2 (0.80%) Proxmox
13 1 (0.40%) Data Guard
Vendors
1 83 (33.33%) Microsoft
2 38 (15.26%) VMware
3 22 (8.84%) Google
4 19 (7.63%) Cisco
4 19 (7.63%) Oracle
5 17 (6.83%) Fortinet
6 15 (6.02%) Databricks
7 14 (5.62%) Dell
8 12 (4.82%) Apple
8 12 (4.82%) Ubiquiti
9 11 (4.42%) Solace
10 8 (3.21%) NetApp
11 7 (2.81%) OpenAI
12 6 (2.41%) Red Hat
12 6 (2.41%) Splunk
12 6 (2.41%) Telerik
13 5 (2.01%) Bloomberg
13 5 (2.01%) ServiceNow
13 5 (2.01%) Veeam
14 4 (1.61%) FactSet