Thought Leadership Jobs in England

Thought Leadership
UK > England

The table below provides summary statistics for permanent job vacancies advertised in England requiring Thought Leadership skills. It includes a benchmarking guide to the annual salaries offered in vacancies that cited Thought Leadership over the 6 months leading up to 19 May 2025, comparing them to the same period in the previous two years.

6 months to
19 May 2025
Same period 2024 Same period 2023
Rank 322 333 255
Rank change year-on-year +11 -78 -22
Permanent jobs citing Thought Leadership 444 701 1,280
As % of all permanent jobs advertised in England 0.90% 0.81% 1.45%
As % of the Processes & Methodologies category 0.95% 0.95% 1.52%
Number of salaries quoted 128 417 436
10th Percentile £45,000 £35,000 £56,219
25th Percentile £62,500 £55,140 £65,000
Median annual salary (50th Percentile) £84,590 £80,000 £85,000
Median % change year-on-year +5.74% -5.88% +5.97%
75th Percentile £100,000 £100,064 £97,290
90th Percentile £131,500 £130,000 £117,500
UK median annual salary £85,000 £79,632 £85,000
% change year-on-year +6.74% -6.32% +6.25%

All Process and Methodology Skills
England

Thought Leadership falls under the Processes and Methodologies category. For comparison with the information above, the following table provides summary statistics for all permanent job vacancies requiring process or methodology skills in England.

Permanent vacancies with a requirement for process or methodology skills 46,515 73,601 84,340
As % of all permanent jobs advertised in England 94.11% 85.11% 95.61%
Number of salaries quoted 23,741 53,968 50,109
10th Percentile £30,000 £29,000 £34,324
25th Percentile £41,860 £40,000 £46,000
Median annual salary (50th Percentile) £57,500 £55,000 £62,500
Median % change year-on-year +4.55% -12.00% +4.17%
75th Percentile £75,000 £73,250 £82,500
90th Percentile £98,474 £93,750 £102,500
UK median annual salary £57,500 £55,000 £61,180
% change year-on-year +4.55% -10.10% +1.97%

Thought Leadership
Job Vacancy Trend in England

Job postings citing Thought Leadership as a proportion of all IT jobs advertised in England.
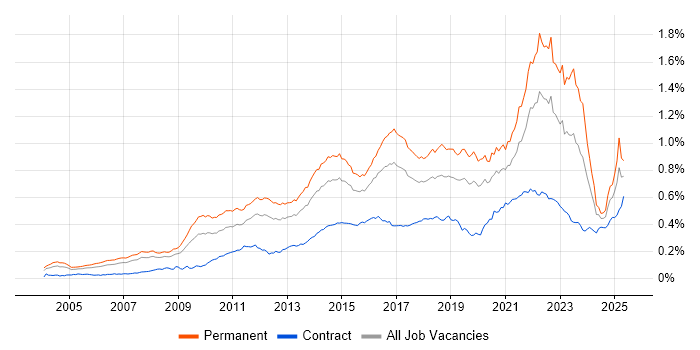
Job vacancy trend for Thought Leadership in England

Thought Leadership
Salary Trend in England

3-month moving average salary quoted in jobs citing Thought Leadership in England.

Salary trend for Thought Leadership in England

Thought Leadership
Salary Histogram in England

Salary distribution for jobs citing Thought Leadership in England over the 6 months to 19 May 2025.

Salary histogram for Thought Leadership in England

Thought Leadership
Job Locations in England

The table below looks at the demand and provides a guide to the median salaries quoted in IT jobs citing Thought Leadership within the England region over the 6 months to 19 May 2025. The 'Rank Change' column provides an indication of the change in demand within each location based on the same 6 month period last year.

Location Rank Change
on Same Period
Last Year
Matching
Permanent
IT Job Ads
Median Salary
Past 6 Months
Median Salary
% Change
on Same Period
Last Year
Live
Jobs
London +20 259 £86,250 +8.31% 950
South East +115 93 £65,000 -7.14% 265
North of England -6 56 £90,569 +6.55% 209
North West -27 43 £94,637 -0.52% 108
Midlands +39 20 £51,250 -22.35% 131
West Midlands +28 20 £51,250 -37.88% 88
Yorkshire +40 10 £95,000 +15.15% 71
South West +39 4 £82,500 +3.13% 58
North East +33 3 £58,250 -24.84% 34
Thought Leadership
UK

Thought Leadership
Co-occurring Skills and Capabilities in England by Category

The follow tables expand on the table above by listing co-occurrences grouped by category. The same employment type, locality and period is covered with up to 20 co-occurrences shown in each of the following categories:

Application Platforms
1 12 (2.70%) Apache Spark
1 12 (2.70%) CMS
2 9 (2.03%) Confluence
2 9 (2.03%) WordPress
3 7 (1.58%) Microsoft Exchange
4 2 (0.45%) Apache
5 1 (0.23%) nginx
Applications
1 22 (4.95%) Microsoft Excel
2 17 (3.83%) Microsoft PowerPoint
3 6 (1.35%) Maya
4 4 (0.90%) Microsoft Project
5 2 (0.45%) Adobe XD
5 2 (0.45%) Notion
6 1 (0.23%) Chatbot
Business Applications
1 13 (2.93%) Dynamics CRM
2 12 (2.70%) NetSuite
3 7 (1.58%) SAP S/4HANA
4 2 (0.45%) SAP CO
4 2 (0.45%) SAP FI
4 2 (0.45%) SAP FI/CO
4 2 (0.45%) SimCorp Dimension
5 1 (0.23%) BASE24
5 1 (0.23%) Remedy ITSM
5 1 (0.23%) SAP FSCM
5 1 (0.23%) SAP IBP
5 1 (0.23%) SAP LE
5 1 (0.23%) SAP Oil and Gas
5 1 (0.23%) SAP PM
5 1 (0.23%) SAP SCM
Cloud Services
1 83 (18.69%) Azure
2 66 (14.86%) AWS
3 49 (11.04%) GCP
4 25 (5.63%) Power Platform
5 21 (4.73%) Salesforce Sales Cloud
6 17 (3.83%) Azure Synapse Analytics
7 15 (3.38%) Snowflake
8 14 (3.15%) Serverless
9 12 (2.70%) Dynamics 365
10 10 (2.25%) Cloud Computing
10 10 (2.25%) SaaS
11 9 (2.03%) AWS CloudFormation
11 9 (2.03%) AWS Lambda
11 9 (2.03%) GitHub
12 8 (1.80%) Azure AI
13 7 (1.58%) AWS Step Functions
13 7 (1.58%) IaaS
14 6 (1.35%) Azure DevOps
14 6 (1.35%) PaaS
15 5 (1.13%) Google Ads
Communications & Networking
1 6 (1.35%) Firewall
1 6 (1.35%) Network Security
2 4 (0.90%) DNS
2 4 (0.90%) Internet
2 4 (0.90%) SD-WAN
2 4 (0.90%) WAN
3 3 (0.68%) Wireless
4 2 (0.45%) VPN
5 1 (0.23%) ATM
5 1 (0.23%) BGP
5 1 (0.23%) F5 BIG-IP LTM
5 1 (0.23%) LAN
5 1 (0.23%) SSL
5 1 (0.23%) TCP/IP
5 1 (0.23%) Unified Communications
5 1 (0.23%) VoIP
5 1 (0.23%) Wi-Fi
Database & Business Intelligence
1 22 (4.95%) Data Lake
2 21 (4.73%) NoSQL
3 18 (4.05%) Power BI
3 18 (4.05%) Tableau
4 17 (3.83%) BigQuery
5 14 (3.15%) Data Warehouse
6 13 (2.93%) Amazon Redshift
6 13 (2.93%) Metadata
7 11 (2.48%) Relational Database
8 9 (2.03%) Big Data
9 6 (1.35%) DTS
9 6 (1.35%) Hadoop
10 4 (0.90%) Power Query
10 4 (0.90%) PowerPivot
11 3 (0.68%) Amazon Athena
11 3 (0.68%) Amazon RDS
11 3 (0.68%) Azure SQL Database
11 3 (0.68%) Electronic Patient Records
11 3 (0.68%) SQL Server
12 2 (0.45%) RDBMS
Development Applications
1 16 (3.60%) JIRA
2 8 (1.80%) Git
3 6 (1.35%) Grunt
3 6 (1.35%) Jasmine
3 6 (1.35%) Mocha
3 6 (1.35%) webpack
4 3 (0.68%) Cucumber
5 2 (0.45%) Artifactory
5 2 (0.45%) Axure RP
5 2 (0.45%) Balsamiq
5 2 (0.45%) ERwin
5 2 (0.45%) git-flow
5 2 (0.45%) Gradle
5 2 (0.45%) Jenkins
6 1 (0.23%) Atlassian Bamboo
6 1 (0.23%) Bitbucket
6 1 (0.23%) GitLab
6 1 (0.23%) Maven
6 1 (0.23%) MLflow
6 1 (0.23%) VersaTest
General
1 174 (39.19%) Finance
2 167 (37.61%) Social Skills
3 159 (35.81%) Law
4 141 (31.76%) Analytical Skills
5 75 (16.89%) Marketing
6 50 (11.26%) Retail
7 40 (9.01%) Banking
8 35 (7.88%) Presentation Skills
9 34 (7.66%) Games
9 34 (7.66%) Influencing Skills
10 28 (6.31%) Inclusion and Diversity
11 22 (4.95%) Public Sector
12 18 (4.05%) Publishing
13 17 (3.83%) Legal
14 13 (2.93%) Advertising
15 9 (2.03%) Retail Banking
16 7 (1.58%) Front Office
16 7 (1.58%) Telecoms
17 6 (1.35%) Health Technology
18 5 (1.13%) Organisational Skills
Job Titles
1 94 (21.17%) Lead
2 88 (19.82%) Senior
3 86 (19.37%) Architect
4 37 (8.33%) Solutions Architect
5 31 (6.98%) Consultant
5 31 (6.98%) Enterprise Architect
6 26 (5.86%) Senior Architect
6 26 (5.86%) Senior Solutions Architect
7 23 (5.18%) ServiceNow Architect
8 21 (4.73%) Salesforce Architect
9 20 (4.50%) Developer
10 17 (3.83%) Analyst
10 17 (3.83%) Project Manager
11 14 (3.15%) Artificial Intelligence Engineer
12 13 (2.93%) Business Analyst
12 13 (2.93%) Finance Business Analyst
12 13 (2.93%) Financial Analyst
12 13 (2.93%) Financial Business Analyst
13 12 (2.70%) CRM Business Analyst
13 12 (2.70%) Systems Analyst
Libraries, Frameworks & Software Standards
1 28 (6.31%) Middleware
1 28 (6.31%) SOAP
2 27 (6.08%) REST
3 23 (5.18%) Lightning Web Components
4 15 (3.38%) React
5 14 (3.15%) Kafka
6 13 (2.93%) CSS
7 10 (2.25%) Spring Boot
8 8 (1.80%) Node.js
8 8 (1.80%) Web Services
9 7 (1.58%) .NET
9 7 (1.58%) Ajax
9 7 (1.58%) AngularJS
9 7 (1.58%) Playwright
9 7 (1.58%) Vue
10 6 (1.35%) Chai
10 6 (1.35%) JWT
10 6 (1.35%) Material-UI
10 6 (1.35%) MobX
10 6 (1.35%) Semantic UI
Miscellaneous
1 41 (9.23%) Product Ownership
2 38 (8.56%) FMCG
3 29 (6.53%) Enterprise Software
4 27 (6.08%) Algorithms
5 24 (5.41%) Analytical Mindset
6 23 (5.18%) Legacy Systems
7 19 (4.28%) Social Media
8 16 (3.60%) Public Cloud
9 14 (3.15%) Management Information System
10 13 (2.93%) Taxonomies
11 12 (2.70%) Blog
11 12 (2.70%) Cloud Native
11 12 (2.70%) Virtual Team
12 11 (2.48%) Data Protection Act
12 11 (2.48%) Data Structures
13 10 (2.25%) Data Centre
14 8 (1.80%) Digital Media
15 7 (1.58%) CMDB
16 6 (1.35%) Private Cloud
16 6 (1.35%) Self-Motivation
Operating Systems
1 4 (0.90%) Linux
2 2 (0.45%) Windows
3 1 (0.23%) Unix
3 1 (0.23%) Windows Server
Processes & Methodologies
1 151 (34.01%) Problem-Solving
2 150 (33.78%) Roadmaps
3 148 (33.33%) Agile
4 138 (31.08%) Analytics
5 119 (26.80%) Artificial Intelligence
6 104 (23.42%) Project Management
7 94 (21.17%) Continuous Improvement
8 92 (20.72%) Business Strategy
9 84 (18.92%) Decision-Making
10 77 (17.34%) Technical Leadership
11 74 (16.67%) Stakeholder Management
12 66 (14.86%) DevOps
13 65 (14.64%) Machine Learning
14 62 (13.96%) Mentoring
15 59 (13.29%) Coaching
16 58 (13.06%) Computer Science
17 54 (12.16%) Data Modelling
18 51 (11.49%) Product Roadmap
19 50 (11.26%) CI/CD
20 49 (11.04%) Stakeholder Engagement
Programming Languages
1 51 (11.49%) Python
2 32 (7.21%) SQL
3 30 (6.76%) JavaScript
4 23 (5.18%) Apex Code
5 16 (3.60%) Java
5 16 (3.60%) TypeScript
6 5 (1.13%) R
7 4 (0.90%) C#
8 2 (0.45%) C
9 1 (0.23%) C++
9 1 (0.23%) COBOL
9 1 (0.23%) Go
9 1 (0.23%) PowerShell
9 1 (0.23%) Scala
Qualifications
1 147 (33.11%) Degree
2 62 (13.96%) Master's Degree
3 46 (10.36%) Computer Science Degree
4 21 (4.73%) Security Cleared
5 20 (4.50%) MBA
6 19 (4.28%) SC Cleared
7 18 (4.05%) PhD
8 9 (2.03%) AWS Certification
9 8 (1.80%) Azure Certification
10 6 (1.35%) PMI Certification
10 6 (1.35%) TOGAF Certification
11 5 (1.13%) CCNP
11 5 (1.13%) Cisco Certification
12 4 (0.90%) Chartered Engineer
12 4 (0.90%) Microsoft Certification
12 4 (0.90%) Numerate Degree
13 3 (0.68%) APMG
13 3 (0.68%) PMP
14 2 (0.45%) OCP
14 2 (0.45%) Oracle Certification
Quality Assurance & Compliance
1 56 (12.61%) Data Quality
2 23 (5.18%) Accessibility
3 12 (2.70%) QA
4 8 (1.80%) GDPR
5 6 (1.35%) California Consumer Privacy Act
5 6 (1.35%) PCI DSS
6 5 (1.13%) ISO/IEC 27001
6 5 (1.13%) WCAG
7 4 (0.90%) Cyber Essentials
8 3 (0.68%) P3O
9 2 (0.45%) NIST
10 1 (0.23%) Basel III
10 1 (0.23%) Dodd-Frank
10 1 (0.23%) EMIR
10 1 (0.23%) ISO 20022
10 1 (0.23%) ISO/IEC 27002 (supersedes ISO/IEC 17799)
10 1 (0.23%) MiFID
10 1 (0.23%) NIST 800
10 1 (0.23%) PMO
System Software
1 12 (2.70%) Docker
2 1 (0.23%) Active Directory
Systems Management
1 18 (4.05%) Kubernetes
2 4 (0.90%) Terraform
3 2 (0.45%) Ansible
3 2 (0.45%) FortiGate
3 2 (0.45%) Prometheus
3 2 (0.45%) Single Sign-On
4 1 (0.23%) Avamar
4 1 (0.23%) EMC NetWorker
4 1 (0.23%) HP UCMDB
4 1 (0.23%) Istio
Vendors
1 48 (10.81%) Salesforce
2 47 (10.59%) Google
3 41 (9.23%) Microsoft
4 30 (6.76%) ServiceNow
5 29 (6.53%) SAP
6 25 (5.63%) Adobe
7 23 (5.18%) Salesforce Marketing Cloud
7 23 (5.18%) TikTok
8 21 (4.73%) IBM
9 16 (3.60%) Databricks
10 11 (2.48%) Capita
10 11 (2.48%) Dell
11 5 (1.13%) Splunk
12 4 (0.90%) Alteryx
12 4 (0.90%) Fortinet
13 3 (0.68%) Facebook
13 3 (0.68%) ScienceLogic
14 2 (0.45%) Hootsuite
14 2 (0.45%) Instagram
14 2 (0.45%) Okta