Architectural Patterns
UK

The following table provides summary statistics for permanent job vacancies with a requirement for Architectural Patterns skills. Included is a benchmarking guide to the salaries offered in vacancies that have cited Architectural Patterns over the 6 months to 28 November 2023 with a comparison to the same period in the previous 2 years.

6 months to
28 Nov 2023
Same period 2022 Same period 2021
Rank 363 370 352
Rank change year-on-year +7 -18 +79
Permanent jobs citing Architectural Patterns 425 1,133 1,272
As % of all permanent jobs advertised in the UK 0.78% 0.90% 0.99%
As % of the Processes & Methodologies category 0.83% 0.94% 1.04%
Number of salaries quoted 301 674 626
10th Percentile £57,550 £55,000 £51,449
25th Percentile £66,250 £66,250 £65,000
Median annual salary (50th Percentile) £77,500 £82,500 £80,000
Median % change year-on-year -6.06% +3.13% +23.08%
75th Percentile £92,500 £100,000 £95,000
90th Percentile £111,250 £112,500 £100,000
UK excluding London median annual salary £70,576 £75,000 £70,000
% change year-on-year -5.90% +7.14% +33.33%

All Process and Methodology Skills
UK

Architectural Patterns is in the Processes and Methodologies category. The following table is for comparison with the above and provides summary statistics for all permanent job vacancies with a requirement for process or methodology skills.

Permanent vacancies with a requirement for process or methodology skills 51,121 120,104 122,523
As % of all permanent jobs advertised in the UK 94.09% 95.72% 95.43%
Number of salaries quoted 36,956 73,203 81,032
10th Percentile £32,500 £34,313 £32,500
25th Percentile £43,750 £45,000 £42,500
Median annual salary (50th Percentile) £60,000 £60,000 £59,000
Median % change year-on-year - +1.69% +7.27%
75th Percentile £80,000 £81,250 £77,500
90th Percentile £98,750 £100,000 £95,000
UK excluding London median annual salary £52,500 £53,000 £50,000
% change year-on-year -0.94% +6.00% +4.17%

Architectural Patterns
Job Vacancy Trend

Job postings citing Architectural Patterns as a proportion of all IT jobs advertised.
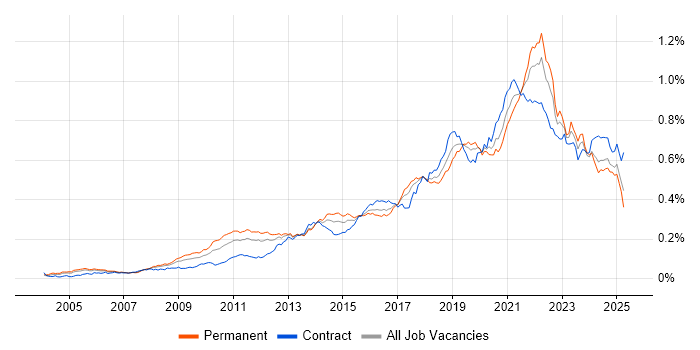
Job vacancy trend for Architectural Patterns in the UK

Architectural Patterns
Salary Trend

3-month moving average salary quoted in jobs citing Architectural Patterns.

Salary trend for Architectural Patterns in the UK

Architectural Patterns
Salary Histogram

Salary distribution for jobs citing Architectural Patterns over the 6 months to 28 November 2023.

Salary histogram for Architectural Patterns in the UK

Architectural Patterns
Top 17 Job Locations

The table below looks at the demand and provides a guide to the median salaries quoted in IT jobs citing Architectural Patterns within the UK over the 6 months to 28 November 2023. The 'Rank Change' column provides an indication of the change in demand within each location based on the same 6 month period last year.

Location Rank Change
on Same Period
Last Year
Matching
Permanent
IT Job Ads
Median Salary
Past 6 Months
Median Salary
% Change
on Same Period
Last Year
Live
Jobs
England +20 371 £77,750 -5.76% 139
Work from Home +33 233 £75,000 -11.76% 68
London +29 210 £86,250 -1.43% 63
UK excluding London +92 194 £70,576 -5.90% 82
South West +74 47 £62,500 +4.17% 21
North of England +65 46 £80,000 +3.23% 25
South East +116 43 £65,650 -22.77% 13
Scotland +41 31 £70,576 -5.90% 1
North West +79 28 £82,500 +11.86% 20
Yorkshire +69 16 £70,576 -14.45% 3
Midlands +65 16 £70,576 -14.45% 15
West Midlands +57 13 £70,576 -16.97% 10
East of England +105 5 £85,000 +18.06% 4
Northern Ireland +37 5 - - 1
East Midlands +44 3 £110,000 +37.50% 5
North East +33 2 £72,500 -4.92% 2
Wales -13 2 - - 2

Architectural Patterns
Co-occurring Skills and Capabilities by Category

The follow tables expand on the table above by listing co-occurrences grouped by category. The same employment type, locality and period is covered with up to 20 co-occurrences shown in each of the following categories:

Application Platforms
1 9 (2.12%) Confluence
2 6 (1.41%) CMS
2 6 (1.41%) SharePoint
3 4 (0.94%) nginx
4 3 (0.71%) IIS
5 2 (0.47%) Apache
5 2 (0.47%) Apache Spark
5 2 (0.47%) IBM HTTP Server
5 2 (0.47%) Tomcat
5 2 (0.47%) WebSphere
6 1 (0.24%) Anypoint
6 1 (0.24%) Apache Airflow
6 1 (0.24%) Apache Pulsar
6 1 (0.24%) Apache Solr
6 1 (0.24%) ArcGIS
6 1 (0.24%) NServiceBus
Applications
1 3 (0.71%) Microsoft Excel
1 3 (0.71%) Microsoft Office
1 3 (0.71%) MS Visio
2 2 (0.47%) Spreadsheet
Business Applications
1 16 (3.76%) Dynamics CRM
2 11 (2.59%) Sparx Enterprise Architect
3 4 (0.94%) SAP Oil and Gas
4 3 (0.71%) Dynamics NAV
5 2 (0.47%) Distributed Ledger
5 2 (0.47%) Dynamics AX
5 2 (0.47%) Oracle Cash Management
5 2 (0.47%) SAP S/4HANA
6 1 (0.24%) Summit
Cloud Services
1 190 (44.71%) Azure
2 77 (18.12%) SaaS
3 58 (13.65%) Serverless
4 55 (12.94%) PaaS
5 50 (11.76%) GCP
6 49 (11.53%) AWS
7 36 (8.47%) Azure DevOps
8 32 (7.53%) IaaS
9 31 (7.29%) Power Platform
10 21 (4.94%) Dynamics 365
11 20 (4.71%) Azure Functions
12 19 (4.47%) Azure Service Bus
13 18 (4.24%) Azure Logic Apps
14 16 (3.76%) GitHub
15 15 (3.53%) Azure API Management
15 15 (3.53%) Microsoft 365
16 12 (2.82%) Apigee
16 12 (2.82%) Azure Cosmos DB
17 10 (2.35%) Azure Monitor
17 10 (2.35%) Azure Sentinel
Communications & Networking
1 10 (2.35%) Firewall
2 7 (1.65%) Cisco IOS
2 7 (1.65%) Internet
2 7 (1.65%) LAN
2 7 (1.65%) MPLS
2 7 (1.65%) NetScaler
2 7 (1.65%) NX-OS
2 7 (1.65%) SD-WAN
2 7 (1.65%) WAN
2 7 (1.65%) WLAN
3 3 (0.71%) AMQP
4 2 (0.47%) HTTP
4 2 (0.47%) IPsec
4 2 (0.47%) VPN
5 1 (0.24%) BGP
5 1 (0.24%) Kerberos
5 1 (0.24%) OSPF
5 1 (0.24%) SSL
5 1 (0.24%) TCP/IP
5 1 (0.24%) VRRP
Database & Business Intelligence
1 51 (12.00%) SQL Server
2 30 (7.06%) Big Data
3 26 (6.12%) NoSQL
4 20 (4.71%) Power BI
5 19 (4.47%) Relational Database
6 15 (3.53%) Azure SQL Database
6 15 (3.53%) Redis
6 15 (3.53%) SQL Server Integration Services
7 14 (3.29%) Data Warehouse
8 8 (1.88%) SQL Server Reporting Services
9 6 (1.41%) Data Lake
10 5 (1.18%) PostgreSQL
10 5 (1.18%) SQL Server Analysis Services
11 4 (0.94%) MongoDB
12 3 (0.71%) Amazon Redshift
12 3 (0.71%) Data Vault
12 3 (0.71%) DynamoDB
12 3 (0.71%) Elasticsearch
12 3 (0.71%) Metadata
12 3 (0.71%) RDBMS
Development Applications
1 34 (8.00%) JIRA
2 18 (4.24%) Git
3 16 (3.76%) Jenkins
3 16 (3.76%) webpack
4 10 (2.35%) Maven
5 9 (2.12%) Bitbucket
6 8 (1.88%) git-flow
7 6 (1.41%) CircleCI
7 6 (1.41%) TeamCity
8 5 (1.18%) fastlane
9 4 (0.94%) JUnit
10 2 (0.47%) Atlassian Bamboo
10 2 (0.47%) Cucumber
10 2 (0.47%) Hudson
10 2 (0.47%) Oracle Forms
10 2 (0.47%) Rational DOORS
10 2 (0.47%) SpecFlow
10 2 (0.47%) Team Foundation Server
10 2 (0.47%) Visual Studio
10 2 (0.47%) WebDriver
General
1 146 (34.35%) Finance
2 91 (21.41%) Social Skills
3 69 (16.24%) Banking
4 50 (11.76%) Legal
5 30 (7.06%) Analytical Skills
6 19 (4.47%) Retail
7 17 (4.00%) Inclusion and Diversity
7 17 (4.00%) Presentation Skills
8 12 (2.82%) Law
9 11 (2.59%) Public Sector
10 10 (2.35%) Automotive
11 5 (1.18%) Aviation
12 4 (0.94%) Back Office
12 4 (0.94%) Billing
12 4 (0.94%) Health Technology
12 4 (0.94%) Tech for Good
13 3 (0.71%) Advertising
13 3 (0.71%) Financial Institution
13 3 (0.71%) Games
14 2 (0.47%) Front Office
Job Titles
1 226 (53.18%) Architect
2 123 (28.94%) Solutions Architect
3 72 (16.94%) Senior
4 66 (15.53%) Developer
5 54 (12.71%) Technical Architect
6 27 (6.35%) Senior Developer
7 25 (5.88%) Lead
8 23 (5.41%) Cloud Architect
8 23 (5.41%) Systems Architect
9 22 (5.18%) Azure Architect
10 20 (4.71%) Python Engineer
10 20 (4.71%) Software Engineer
11 16 (3.76%) Consultant
11 16 (3.76%) Front-End Engineer (Client-Side Engineer)
12 15 (3.53%) C# Developer
13 14 (3.29%) .NET Developer
13 14 (3.29%) Enterprise Architect
14 12 (2.82%) Data Architect
14 12 (2.82%) Data Engineer
14 12 (2.82%) Senior Front-End Engineer (Client-Side Engineer)
Libraries, Frameworks & Software Standards
1 100 (23.53%) .NET
2 64 (15.06%) REST
3 55 (12.94%) Spring
4 50 (11.76%) Kafka
5 46 (10.82%) React
5 46 (10.82%) Spring Boot
6 34 (8.00%) HTML
7 33 (7.76%) CSS
7 33 (7.76%) Node.js
8 32 (7.53%) RESTful
9 24 (5.65%) .NET Framework
10 23 (5.41%) .NET Core
11 21 (4.94%) Flask
12 18 (4.24%) Middleware
13 17 (4.00%) FastAPI
14 16 (3.76%) Blazor
15 15 (3.53%) GraphQL
15 15 (3.53%) SOAP
16 14 (3.29%) Hibernate
17 13 (3.06%) ASP.NET
Miscellaneous
1 49 (11.53%) Cloud Native
2 33 (7.76%) Public Cloud
3 29 (6.82%) Greenfield Project
4 27 (6.35%) Product Ownership
5 26 (6.12%) Enterprise Software
6 24 (5.65%) Blockchain
7 22 (5.18%) Robotics
8 19 (4.47%) Reinsurance
9 14 (3.29%) SWIFT Messaging Network
10 10 (2.35%) Legacy Systems
11 9 (2.12%) Distributed Systems
11 9 (2.12%) Mobile App
11 9 (2.12%) Social Network
11 9 (2.12%) Virtual Team
12 8 (1.88%) Data Centre
13 6 (1.41%) Distributed Architecture
13 6 (1.41%) Life Science
14 4 (0.94%) Data Structures
14 4 (0.94%) PKI
15 3 (0.71%) Low-Code
Operating Systems
1 13 (3.06%) Linux
2 9 (2.12%) Android
3 4 (0.94%) QNX Neutrino
3 4 (0.94%) Unix
4 3 (0.71%) Apple iOS
5 2 (0.47%) Windows
Processes & Methodologies
1 252 (59.29%) Agile
2 194 (45.65%) Microservices
3 155 (36.47%) DevOps
4 121 (28.47%) Design Patterns
5 117 (27.53%) Problem-Solving
6 100 (23.53%) Roadmaps
7 91 (21.41%) CI/CD
8 73 (17.18%) SDLC
9 67 (15.76%) Mentoring
10 63 (14.82%) Analytics
11 62 (14.59%) Software Engineering
12 61 (14.35%) Continuous Integration
13 60 (14.12%) API Design
13 60 (14.12%) TOGAF
14 59 (13.88%) Data Modelling
15 58 (13.65%) Software Architecture
16 57 (13.41%) Technical Leadership
17 56 (13.18%) UML
18 53 (12.47%) Infrastructure as Code
19 51 (12.00%) Enterprise Architecture
Programming Languages
1 85 (20.00%) C#
2 82 (19.29%) Java
3 69 (16.24%) Python
4 66 (15.53%) SQL
5 65 (15.29%) JavaScript
6 28 (6.59%) TypeScript
7 15 (3.53%) T-SQL
8 14 (3.29%) Bash
9 11 (2.59%) PL/SQL
10 10 (2.35%) Bicep
11 9 (2.12%) Go
11 9 (2.12%) PowerShell
12 8 (1.88%) Kotlin
13 7 (1.65%) C
13 7 (1.65%) C++
14 6 (1.41%) Apex Code
14 6 (1.41%) Kusto Query Language
15 3 (0.71%) Shell Script
16 2 (0.47%) ABAP
16 2 (0.47%) Scala
Qualifications
1 48 (11.29%) Degree
2 47 (11.06%) Security Cleared
3 45 (10.59%) SC Cleared
4 17 (4.00%) Azure Certification
5 14 (3.29%) BPSS Clearance
6 13 (3.06%) TOGAF Certification
7 9 (2.12%) Microsoft Certification
8 5 (1.18%) AWS Certification
8 5 (1.18%) Computer Science Degree
8 5 (1.18%) Master's Degree
9 4 (0.94%) AWS Certified Developer
10 3 (0.71%) CBAP
10 3 (0.71%) IIBA
11 1 (0.24%) AWS Certified Solutions Architect
11 1 (0.24%) CASP
11 1 (0.24%) CEH
11 1 (0.24%) CISM
11 1 (0.24%) CISSP
11 1 (0.24%) CRISC
11 1 (0.24%) DV Cleared
Quality Assurance & Compliance
1 37 (8.71%) QA
2 28 (6.59%) SEPA
3 15 (3.53%) Accessibility
3 15 (3.53%) ISO 20022
3 15 (3.53%) WCAG
4 12 (2.82%) Data Quality
5 9 (2.12%) ISO/IEC 27001
6 7 (1.65%) GDPR
7 6 (1.41%) GAAP
7 6 (1.41%) ISO 9000
7 6 (1.41%) NCSC
7 6 (1.41%) NIST
7 6 (1.41%) PCI DSS
8 4 (0.94%) GRC
9 3 (0.71%) SOC 2
10 2 (0.47%) ISO/IEC 27005
11 1 (0.24%) HMG Security Policy Framework
11 1 (0.24%) ISO 31000
11 1 (0.24%) NIST 800
System Software
1 67 (15.76%) Docker
2 4 (0.94%) Active Directory
2 4 (0.94%) IAG
3 2 (0.47%) Apache Flume
4 1 (0.24%) HDFS
4 1 (0.24%) OpenAM
4 1 (0.24%) RACF
Systems Management
1 77 (18.12%) Kubernetes
2 23 (5.41%) Terraform
3 5 (1.18%) Ansible
4 2 (0.47%) Oozie
5 1 (0.24%) Apache Ranger
5 1 (0.24%) Hadoop YARN
5 1 (0.24%) Single Sign-On
Vendors
1 97 (22.82%) Microsoft
2 63 (14.82%) Google
3 15 (3.53%) Okta
4 14 (3.29%) SAP
5 12 (2.82%) Informatica
5 12 (2.82%) Oracle
6 11 (2.59%) Salesforce
6 11 (2.59%) Sparx
7 8 (1.88%) Databricks
8 7 (1.65%) Aruba
8 7 (1.65%) Cisco
8 7 (1.65%) Meraki
8 7 (1.65%) MuleSoft
8 7 (1.65%) Palo Alto
8 7 (1.65%) Riverbed
9 4 (0.94%) Guidewire
9 4 (0.94%) OpenAI
9 4 (0.94%) QNX
10 3 (0.71%) Apple
10 3 (0.71%) New Relic