UX Design Jobs

User Experience Design (UXD)
UK

The table below provides summary statistics for permanent job vacancies requiring UX Design skills. It includes a benchmarking guide to the annual salaries offered in vacancies that cited UX Design over the 6 months leading up to 30 April 2025, comparing them to the same period in the previous two years.

6 months to
30 Apr 2025
Same period 2024 Same period 2023
Rank 305 263 193
Rank change year-on-year -42 -70 -91
Permanent jobs citing UX Design 474 1,100 2,033
As % of all permanent jobs advertised in the UK 0.91% 1.12% 1.95%
As % of the Processes & Methodologies category 0.97% 1.30% 2.04%
Number of salaries quoted 335 755 993
10th Percentile £35,353 £31,250 £41,296
25th Percentile £45,000 £42,500 £47,500
Median annual salary (50th Percentile) £55,000 £55,000 £62,500
Median % change year-on-year - -12.00% +4.17%
75th Percentile £72,500 £70,000 £80,000
90th Percentile £88,250 £85,000 £96,250
UK excluding London median annual salary £50,000 £50,000 £55,000
% change year-on-year - -9.09% +10.00%

All Process and Methodology Skills
UK

UX Design falls under the Processes and Methodologies category. For comparison with the information above, the following table provides summary statistics for all permanent job vacancies requiring process or methodology skills.

Permanent vacancies with a requirement for process or methodology skills 48,641 84,574 99,457
As % of all permanent jobs advertised in the UK 93.26% 86.00% 95.63%
Number of salaries quoted 26,531 59,798 58,397
10th Percentile £30,580 £29,000 £34,000
25th Percentile £42,500 £40,000 £45,000
Median annual salary (50th Percentile) £57,500 £55,000 £61,500
Median % change year-on-year +4.55% -10.57% +2.50%
75th Percentile £76,250 £72,500 £82,500
90th Percentile £98,750 £92,500 £100,000
UK excluding London median annual salary £52,500 £50,000 £55,000
% change year-on-year +5.00% -9.09% +4.76%

UX Design
Job Vacancy Trend

Job postings citing UX Design as a proportion of all IT jobs advertised.
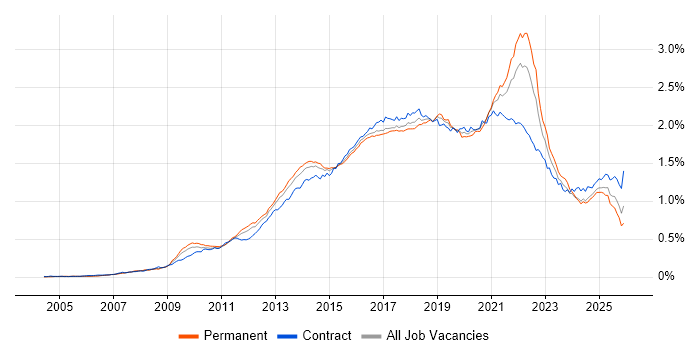
Job vacancy trend for UX Design in the UK

UX Design
Salary Trend

3-month moving average salary quoted in jobs citing UX Design.

Salary trend for UX Design in the UK

UX Design
Salary Histogram

Salary distribution for jobs citing UX Design over the 6 months to 30 April 2025.

Salary histogram for UX Design in the UK

UX Design
Top 18 Job Locations

The table below looks at the demand and provides a guide to the median salaries quoted in IT jobs citing UX Design within the UK over the 6 months to 30 April 2025. The 'Rank Change' column provides an indication of the change in demand within each location based on the same 6 month period last year.

Location Rank Change
on Same Period
Last Year
Matching
Permanent
IT Job Ads
Median Salary
Past 6 Months
Median Salary
% Change
on Same Period
Last Year
Live
Jobs
England -37 402 £55,000 - 567
UK excluding London -49 283 £50,000 - 267
Work from Home -5 198 £57,500 +4.55% 315
London +30 147 £70,000 +7.69% 325
North of England -31 65 £47,000 -6.00% 83
South West +63 56 £46,500 -15.45% 33
South East +27 52 £55,000 - 56
Scotland +26 37 £127,680 +168.80% 11
Midlands -23 36 £37,500 -25.00% 37
North West -46 32 £55,000 +22.22% 58
Yorkshire +35 27 £43,750 -14.22% 18
East of England +39 25 £55,000 +19.57% 37
East Midlands +43 24 £35,000 -9.68% 10
West Midlands -21 12 £57,500 +4.55% 27
North East +43 6 £42,500 -19.05% 7
Wales +28 6 - - 12
Isle of Man - 4 - -
Northern Ireland +21 2 - - 6

UX Design
Co-occurring Skills and Capabilities by Category

The follow tables expand on the table above by listing co-occurrences grouped by category. The same employment type, locality and period is covered with up to 20 co-occurrences shown in each of the following categories:

Application Platforms
1 38 (8.02%) CMS
2 19 (4.01%) WordPress
3 11 (2.32%) Confluence
4 10 (2.11%) Drupal
4 10 (2.11%) SharePoint
5 9 (1.90%) nginx
6 5 (1.05%) Headless CMS
7 3 (0.63%) Apache
7 3 (0.63%) Strapi
8 2 (0.42%) Adobe Experience Manager
9 1 (0.21%) Appian
9 1 (0.21%) EPiServer
9 1 (0.21%) IIS
9 1 (0.21%) Tomcat
9 1 (0.21%) Umbraco
Applications
1 42 (8.86%) Adobe XD
2 37 (7.81%) Sketch
3 13 (2.74%) Adobe Creative Suite
4 10 (2.11%) Microsoft Excel
5 5 (1.05%) Adobe Illustrator
5 5 (1.05%) Photoshop
6 4 (0.84%) InDesign
6 4 (0.84%) Microsoft Office
6 4 (0.84%) Microsoft PowerPoint
6 4 (0.84%) Notion
7 3 (0.63%) InVision
7 3 (0.63%) MS Visio
7 3 (0.63%) Trello
7 3 (0.63%) UserZoom
8 2 (0.42%) Moqups
9 1 (0.21%) Adobe After Effects
9 1 (0.21%) Zeplin
Business Applications
1 22 (4.64%) Shopify
2 20 (4.22%) NetSuite
3 11 (2.32%) JDE OneWorld
3 11 (2.32%) Payment Gateway
4 10 (2.11%) Magento
5 3 (0.63%) Dynamics CRM
6 2 (0.42%) Workday HCM
7 1 (0.21%) Dynamics GP
7 1 (0.21%) iTrent
7 1 (0.21%) Sage 200
Cloud Services
1 104 (21.94%) Figma
2 62 (13.08%) AWS
3 51 (10.76%) Azure
4 31 (6.54%) SaaS
5 20 (4.22%) Serverless
6 19 (4.01%) Google Analytics
7 18 (3.80%) GitHub
8 16 (3.38%) Power Platform
9 15 (3.16%) Azure DevOps
10 14 (2.95%) Slack
10 14 (2.95%) Zapier
11 11 (2.32%) AWS Lambda
11 11 (2.32%) Boomi
12 10 (2.11%) Azure Service Bus
13 9 (1.90%) Amazon SageMaker
13 9 (1.90%) Azure Functions
13 9 (1.90%) Salesforce Commerce Cloud
14 8 (1.69%) Azure Logic Apps
14 8 (1.69%) Microsoft 365
14 8 (1.69%) PaaS
Communications & Networking
1 18 (3.80%) Internet
2 3 (0.63%) SMS
3 2 (0.42%) LoRaWAN
4 1 (0.21%) Broadband
4 1 (0.21%) Intranet
4 1 (0.21%) WPA
4 1 (0.21%) X.21
Database & Business Intelligence
1 37 (7.81%) MySQL
2 14 (2.95%) Power BI
3 13 (2.74%) SQL Server
4 12 (2.53%) NoSQL
5 8 (1.69%) MongoDB
5 8 (1.69%) PostgreSQL
6 7 (1.48%) Amazon RDS
7 5 (1.05%) Azure SQL Database
8 4 (0.84%) Redis
9 3 (0.63%) DynamoDB
9 3 (0.63%) Relational Database
9 3 (0.63%) Tableau
10 2 (0.42%) Looker
10 2 (0.42%) SQL Server Integration Services
10 2 (0.42%) SQL Server Reporting Services
11 1 (0.21%) BigQuery
11 1 (0.21%) Endeca
11 1 (0.21%) Geospatial Data
11 1 (0.21%) MariaDB
11 1 (0.21%) SQLite
Development Applications
1 66 (13.92%) Git
2 50 (10.55%) JIRA
3 28 (5.91%) Visual Studio
4 23 (4.85%) Jenkins
5 14 (2.95%) webpack
6 12 (2.53%) Jasmine
6 12 (2.53%) Karma Test Runner
7 9 (1.90%) Cypress.io
7 9 (1.90%) Maven
8 8 (1.69%) Babel
9 6 (1.27%) Octopus Deploy
10 5 (1.05%) Appium
10 5 (1.05%) Cucumber
10 5 (1.05%) GitLab
10 5 (1.05%) rollup.js
11 4 (0.84%) Selenium
11 4 (0.84%) TeamCity
11 4 (0.84%) Vite
12 3 (0.63%) Axure RP
12 3 (0.63%) Mocha
General
1 150 (31.65%) Social Skills
2 120 (25.32%) Finance
3 57 (12.03%) Analytical Skills
4 50 (10.55%) Marketing
5 43 (9.07%) Banking
6 27 (5.70%) Avionics
7 18 (3.80%) Inclusion and Diversity
7 18 (3.80%) Presentation Skills
8 16 (3.38%) Manufacturing
9 12 (2.53%) Electronics
9 12 (2.53%) Law
10 11 (2.32%) Pharmaceutical
11 10 (2.11%) Games
12 9 (1.90%) Public Sector
12 9 (1.90%) Retail
13 8 (1.69%) Influencing Skills
14 7 (1.48%) Financial Institution
14 7 (1.48%) Legal
14 7 (1.48%) Organisational Skills
15 5 (1.05%) Telecoms
Job Titles
1 202 (42.62%) Developer
2 133 (28.06%) Senior
3 90 (18.99%) Designer
4 74 (15.61%) UX Designer
5 63 (13.29%) Senior Developer
6 61 (12.87%) Front-End Developer (Client-Side Developer)
7 43 (9.07%) Lead
8 30 (6.33%) UX Developer
9 24 (5.06%) Analyst
10 23 (4.85%) UI Designer
10 23 (4.85%) UI/UX Designer
11 22 (4.64%) React Developer
12 21 (4.43%) Full-Stack Developer
13 18 (3.80%) Senior Designer
13 18 (3.80%) Senior UX Designer
13 18 (3.80%) Software Engineer
14 17 (3.59%) .NET Developer
15 16 (3.38%) C# Developer
15 16 (3.38%) Front-End Engineer (Client-Side Engineer)
16 12 (2.53%) Senior Front-End Developer
Libraries, Frameworks & Software Standards
1 166 (35.02%) HTML
2 161 (33.97%) CSS
3 100 (21.10%) React
4 62 (13.08%) RESTful
5 48 (10.13%) .NET
6 43 (9.07%) AngularJS
7 41 (8.65%) CSS3
8 40 (8.44%) HTML5
9 38 (8.02%) Node.js
10 27 (5.70%) Vue
11 23 (4.85%) XML
12 21 (4.43%) REST
13 20 (4.22%) jQuery
13 20 (4.22%) JSON
13 20 (4.22%) Sass
14 17 (3.59%) Jest
14 17 (3.59%) Laravel
14 17 (3.59%) Web Services
15 16 (3.38%) .NET Framework
15 16 (3.38%) Redux
Miscellaneous
1 46 (9.70%) Mobile App
2 40 (8.44%) Product Ownership
3 20 (4.22%) Algorithms
4 17 (3.59%) Analytical Mindset
5 15 (3.16%) Social Media
6 10 (2.11%) Data Structures
6 10 (2.11%) Team-Oriented Environment
6 10 (2.11%) Virtual Team
7 8 (1.69%) Data Protection Act
7 8 (1.69%) Graphic Design
7 8 (1.69%) Online Banking
8 6 (1.27%) Animation
8 6 (1.27%) Video Editing
9 5 (1.05%) Educational Technology
9 5 (1.05%) Greenfield Project
9 5 (1.05%) IoT
9 5 (1.05%) Self-Motivation
10 4 (0.84%) Onboarding
11 3 (0.63%) Hackathon
11 3 (0.63%) PropTech
Operating Systems
1 33 (6.96%) Android
2 32 (6.75%) Apple iOS
3 31 (6.54%) Linux
4 16 (3.38%) Windows
5 6 (1.27%) Windows Vista
6 1 (0.21%) Solaris
Processes & Methodologies
1 474 (100.00%) User Experience
2 174 (36.71%) Agile
3 139 (29.32%) Problem-Solving
4 135 (28.48%) Front End Development
5 103 (21.73%) Wireframes
6 101 (21.31%) User Research
7 81 (17.09%) User-Centered Design (UCD)
8 80 (16.88%) E-Commerce
9 68 (14.35%) DevOps
10 66 (13.92%) Usability Testing
11 65 (13.71%) Project Management
12 64 (13.50%) Full-Stack Development
12 64 (13.50%) Responsive Web Design
13 62 (13.08%) Prototyping
13 62 (13.08%) Software Engineering
14 55 (11.60%) Computer Science
15 54 (11.39%) CI/CD
16 51 (10.76%) UX Research
17 47 (9.92%) Analytics
17 47 (9.92%) Mentoring
Programming Languages
1 192 (40.51%) JavaScript
2 70 (14.77%) TypeScript
3 61 (12.87%) C#
4 50 (10.55%) Java
5 49 (10.34%) SQL
6 42 (8.86%) Python
7 33 (6.96%) PHP
8 28 (5.91%) C
9 14 (2.95%) Kotlin
10 12 (2.53%) C++
11 6 (1.27%) Bicep
12 4 (0.84%) Go
12 4 (0.84%) Swift
13 3 (0.63%) Ruby
14 2 (0.42%) Julia
14 2 (0.42%) Objective-C
14 2 (0.42%) R
14 2 (0.42%) Rust
14 2 (0.42%) VBA
14 2 (0.42%) XAML
Qualifications
1 118 (24.89%) Degree
2 36 (7.59%) Computer Science Degree
3 19 (4.01%) Security Cleared
4 17 (3.59%) DBS Check
5 15 (3.16%) Master's Degree
6 10 (2.11%) SC Cleared
7 9 (1.90%) DV Cleared
7 9 (1.90%) PhD
8 6 (1.27%) PMI Certification
8 6 (1.27%) PMP
8 6 (1.27%) PRINCE2 Certification
9 2 (0.42%) ACCA
9 2 (0.42%) MBA
9 2 (0.42%) Microsoft Certification
Quality Assurance & Compliance
1 108 (22.78%) Accessibility
2 40 (8.44%) QA
3 10 (2.11%) WCAG
4 6 (1.27%) Data Quality
5 2 (0.42%) Actionable Recommendations
5 2 (0.42%) IEC 62304
5 2 (0.42%) ISO 13485
5 2 (0.42%) ISO 9001
5 2 (0.42%) ISO/IEC 27001
6 1 (0.21%) GDPR
6 1 (0.21%) HIPAA
6 1 (0.21%) SLA
System Software
1 46 (9.70%) Docker
Systems Management
1 24 (5.06%) Kubernetes
2 12 (2.53%) Terraform
3 1 (0.21%) Grafana
3 1 (0.21%) Kibana
Vendors
1 79 (16.67%) Adobe
2 61 (12.87%) Microsoft
3 29 (6.12%) Google
4 19 (4.01%) Salesforce
5 14 (2.95%) WooCommerce
6 11 (2.32%) Dell
7 10 (2.11%) New Relic
8 6 (1.27%) Oracle
9 5 (1.05%) SAP
9 5 (1.05%) ServiceNow
10 3 (0.63%) Facebook
10 3 (0.63%) Optimizely
10 3 (0.63%) YouTube
11 2 (0.42%) Bloomberg
11 2 (0.42%) Cisco
11 2 (0.42%) Workday
12 1 (0.21%) Apple
12 1 (0.21%) Red Hat
12 1 (0.21%) Sage
12 1 (0.21%) VMware