Line Management Jobs in England

Line Management
UK > England

The following table provides summary statistics for permanent job vacancies advertised in England with a requirement for Line Management skills. Included is a benchmarking guide to the salaries offered in vacancies that have cited Line Management over the 6 months to 8 May 2024 with a comparison to the same period in the previous 2 years.

6 months to
8 May 2024
Same period 2023 Same period 2022
Rank 108 117 158
Rank change year-on-year +9 +41 +36
Permanent jobs citing Line Management 2,126 2,639 3,526
As % of all permanent jobs advertised in England 2.48% 2.92% 2.65%
As % of the Processes & Methodologies category 2.90% 3.05% 2.77%
Number of salaries quoted 1,525 1,258 1,638
10th Percentile £28,250 £35,000 £34,750
25th Percentile £39,000 £45,000 £44,000
Median annual salary (50th Percentile) £54,225 £65,000 £60,000
Median % change year-on-year -16.58% +8.33% +4.35%
75th Percentile £75,772 £84,764 £79,600
90th Percentile £115,000 £102,500 £95,000
UK median annual salary £52,396 £65,351 £60,000
% change year-on-year -19.82% +8.92% +4.35%

All Process and Methodology Skills
England

Line Management is in the Processes and Methodologies category. The following table is for comparison with the above and provides summary statistics for all permanent job vacancies advertised in England with a requirement for process or methodology skills.

Permanent vacancies with a requirement for process or methodology skills 73,372 86,501 127,461
As % of all permanent jobs advertised in England 85.52% 95.63% 95.72%
Number of salaries quoted 53,935 51,101 73,310
10th Percentile £29,000 £34,324 £33,500
25th Percentile £40,000 £46,000 £44,186
Median annual salary (50th Percentile) £55,000 £62,500 £60,000
Median % change year-on-year -12.00% +4.17% +9.09%
75th Percentile £73,500 £82,500 £80,000
90th Percentile £93,750 £101,250 £97,500
UK median annual salary £55,000 £61,180 £60,000
% change year-on-year -10.10% +1.97% +9.09%

Line Management
Job Vacancy Trend in England

Job postings citing Line Management as a proportion of all IT jobs advertised in England.
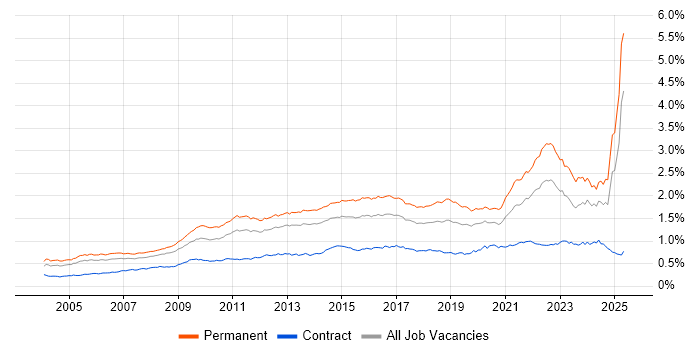
Job vacancy trend for Line Management in England

Line Management
Salary Trend in England

3-month moving average salary quoted in jobs citing Line Management in England.

Salary trend for Line Management in England

Line Management
Salary Histogram in England

Salary distribution for jobs citing Line Management in England over the 6 months to 8 May 2024.

Salary histogram for Line Management in England

Line Management
Job Locations in England

The table below looks at the demand and provides a guide to the median salaries quoted in IT jobs citing Line Management within the England region over the 6 months to 8 May 2024. The 'Rank Change' column provides an indication of the change in demand within each location based on the same 6 month period last year.

Location Rank Change
on Same Period
Last Year
Matching
Permanent
IT Job Ads
Median Salary
Past 6 Months
Median Salary
% Change
on Same Period
Last Year
Live
Jobs
London +97 685 £72,500 -3.33% 248
North of England +19 406 £52,500 -8.70% 198
South East -41 347 £47,500 -32.14% 145
South West -39 245 £47,993 -11.49% 105
Midlands -66 232 £44,094 -21.38% 128
North West +35 211 £54,850 -4.19% 114
East of England +23 199 £39,115 +2.93% 87
West Midlands -65 161 £45,750 -3.15% 86
Yorkshire +13 140 £52,500 -12.50% 63
East Midlands -2 71 £40,000 -33.33% 42
North East +25 55 £44,094 -17.58% 22
Line Management
UK

Line Management
Co-occurring Skills and Capabilities in England by Category

The follow tables expand on the table above by listing co-occurrences grouped by category. The same employment type, locality and period is covered with up to 20 co-occurrences shown in each of the following categories:

Application Platforms
1 82 (3.86%) Apache
2 80 (3.76%) Apache Airflow
2 80 (3.76%) SharePoint
3 55 (2.59%) Microsoft Exchange
4 31 (1.46%) CMS
5 17 (0.80%) IIS
6 15 (0.71%) Confluence
7 9 (0.42%) WordPress
8 8 (0.38%) Drupal
9 7 (0.33%) MS Project Server
10 4 (0.19%) Apache Spark
10 4 (0.19%) Office Communications Server
11 3 (0.14%) ArcGIS
12 2 (0.094%) Umbraco
13 1 (0.047%) JOnAS
13 1 (0.047%) Moodle
13 1 (0.047%) OpenStack
13 1 (0.047%) SAS
13 1 (0.047%) Skype for Business
13 1 (0.047%) Tomcat
Applications
1 121 (5.69%) Microsoft Excel
2 88 (4.14%) Microsoft Office
3 39 (1.83%) Microsoft PowerPoint
4 16 (0.75%) Photoshop
5 13 (0.61%) Microsoft Project
6 5 (0.24%) Simulink
7 4 (0.19%) Spreadsheet
8 3 (0.14%) SPSS
9 2 (0.094%) Adobe After Effects
9 2 (0.094%) Adobe Creative Suite
9 2 (0.094%) Adobe Premiere
9 2 (0.094%) FileZilla
9 2 (0.094%) MadCap Flare
10 1 (0.047%) MS Visio
Business Applications
1 14 (0.66%) SDL Web 8
2 10 (0.47%) Dynamics CRM
3 7 (0.33%) SAP S/4HANA
4 6 (0.28%) Aladdin
4 6 (0.28%) Oracle Applications
4 6 (0.28%) thinkFolio
5 4 (0.19%) Dynamics GP
5 4 (0.19%) Dynamics NAV
5 4 (0.19%) NEC Housing
5 4 (0.19%) Payment Gateway
5 4 (0.19%) SAP CO
5 4 (0.19%) SAP FI
5 4 (0.19%) SAP FI/CO
6 3 (0.14%) Raiser’s Edge
7 2 (0.094%) Salesforce CRM
7 2 (0.094%) SAP MM
7 2 (0.094%) Shopify
8 1 (0.047%) Oracle EBS
8 1 (0.047%) Oracle ERP
8 1 (0.047%) Primavera
Cloud Services
1 312 (14.68%) Azure
2 303 (14.25%) AWS
3 224 (10.54%) Microsoft 365
4 181 (8.51%) GCP
5 138 (6.49%) Power Platform
6 90 (4.23%) Azure DevOps
7 88 (4.14%) dbt
8 85 (4.00%) Snowflake
9 74 (3.48%) SaaS
10 48 (2.26%) Entra ID
11 32 (1.51%) PaaS
12 31 (1.46%) AWS CloudFormation
13 26 (1.22%) IaaS
14 21 (0.99%) OneDrive
15 20 (0.94%) Google Sheets
16 19 (0.89%) Serverless
17 17 (0.80%) Power Automate
18 16 (0.75%) PowerApps
19 15 (0.71%) GitHub
19 15 (0.71%) Google Analytics
Communications & Networking
1 79 (3.72%) DNS
2 78 (3.67%) Firewall
3 73 (3.43%) DHCP
4 53 (2.49%) TCP/IP
5 46 (2.16%) WAN
6 34 (1.60%) Internet
7 33 (1.55%) Wireless
8 31 (1.46%) HTTP
8 31 (1.46%) LAN
9 27 (1.27%) Intranet
9 27 (1.27%) VPN
10 25 (1.18%) SAN
11 24 (1.13%) Network Security
11 24 (1.13%) SD-WAN
12 16 (0.75%) iSCSI
12 16 (0.75%) VoIP
13 14 (0.66%) Remote Desktop
13 14 (0.66%) Wi-Fi
14 10 (0.47%) SNMP
14 10 (0.47%) SSL
Database & Business Intelligence
1 121 (5.69%) Power BI
2 86 (4.05%) Data Lake
3 83 (3.90%) Data Warehouse
4 80 (3.76%) Amazon Athena
4 80 (3.76%) Apache Arrow
4 80 (3.76%) Apache Ignite
4 80 (3.76%) Dremio
5 77 (3.62%) SQL Server
6 71 (3.34%) BigQuery
7 70 (3.29%) Looker
8 42 (1.98%) Relational Database
9 34 (1.60%) GIS
10 30 (1.41%) PostgreSQL
11 25 (1.18%) Tableau
12 22 (1.03%) MongoDB
13 21 (0.99%) Geospatial Data
14 19 (0.89%) Amazon RDS
14 19 (0.89%) SQL Server Reporting Services
15 14 (0.66%) MS Access
16 13 (0.61%) SQL Server Integration Services
Development Applications
1 77 (3.62%) JIRA
2 59 (2.78%) Git
3 54 (2.54%) Jenkins
4 36 (1.69%) Selenium
5 28 (1.32%) Cucumber
6 24 (1.13%) Postman
7 20 (0.94%) Visual Studio
8 19 (0.89%) Octopus Deploy
8 19 (0.89%) Sourcetree
9 17 (0.80%) GitLab
10 14 (0.66%) git-flow
10 14 (0.66%) Moq
10 14 (0.66%) NUnit
10 14 (0.66%) SpecFlow
10 14 (0.66%) TeamCity
11 13 (0.61%) Rational DOORS
12 11 (0.52%) Cypress.io
13 9 (0.42%) Oracle Forms
14 6 (0.28%) Subversion
15 5 (0.24%) Team Foundation Server
General
1 721 (33.91%) Social Skills
2 673 (31.66%) Finance
3 279 (13.12%) Analytical Skills
4 247 (11.62%) Inclusion and Diversity
5 142 (6.68%) Banking
6 134 (6.30%) Marketing
7 123 (5.79%) Organisational Skills
8 105 (4.94%) Legal
9 102 (4.80%) Law
9 102 (4.80%) Retail
10 95 (4.47%) Front Office
11 93 (4.37%) Public Sector
12 84 (3.95%) Billing
13 81 (3.81%) Investment Banking
14 58 (2.73%) Manufacturing
15 55 (2.59%) Telecoms
16 52 (2.45%) Presentation Skills
17 41 (1.93%) Local Government
18 38 (1.79%) Influencing Skills
19 37 (1.74%) Electronics
Job Titles
1 421 (19.80%) Lead
2 313 (14.72%) Senior
3 159 (7.48%) Architect
4 145 (6.82%) Developer
5 138 (6.49%) Team Leader
6 126 (5.93%) IT Manager
7 124 (5.83%) Project Manager
8 122 (5.74%) Solutions Architect
9 96 (4.52%) Data Manager
10 95 (4.47%) Senior Manager
11 87 (4.09%) Engineering Manager
12 77 (3.62%) Software Engineer
13 74 (3.48%) Analyst
14 68 (3.20%) Service Manager
15 66 (3.10%) Lead Developer
16 64 (3.01%) Infrastructure Manager
17 59 (2.78%) Software Developer
18 55 (2.59%) IT Technician
19 53 (2.49%) Delivery Manager
19 53 (2.49%) Software Team Leader
Libraries, Frameworks & Software Standards
1 94 (4.42%) HTML
2 81 (3.81%) NumPy
3 80 (3.76%) gRPC
3 80 (3.76%) Pandas
3 80 (3.76%) Protocol Buffers
3 80 (3.76%) SciPy
4 77 (3.62%) .NET
5 67 (3.15%) CSS
6 48 (2.26%) React
7 43 (2.02%) RESTful
8 36 (1.69%) REST
9 35 (1.65%) Kafka
10 33 (1.55%) OpenID
11 32 (1.51%) SAML
12 29 (1.36%) EDI
13 28 (1.32%) ASP.NET
14 26 (1.22%) Web Services
15 25 (1.18%) Node.js
16 24 (1.13%) jQuery
17 23 (1.08%) .NET Framework
Miscellaneous
1 177 (8.33%) Management Information System
2 111 (5.22%) Self-Motivation
3 110 (5.17%) Product Ownership
4 87 (4.09%) Hedge funds
5 83 (3.90%) Foreign Exchange (FX)
6 82 (3.86%) Derivative
7 80 (3.76%) Equities
7 80 (3.76%) Fixed Income
8 59 (2.78%) Driving Licence
9 51 (2.40%) Data Centre
10 47 (2.21%) Housing Association
11 44 (2.07%) PMI
12 42 (1.98%) Cloud Native
13 39 (1.83%) Social Media
14 38 (1.79%) Cyberattack
15 30 (1.41%) Cyber Threat
16 27 (1.27%) NHS
17 21 (0.99%) CCTV
17 21 (0.99%) Operational Technology
17 21 (0.99%) Public Cloud
Operating Systems
1 199 (9.36%) Windows
2 76 (3.57%) Windows Server
3 68 (3.20%) Linux
4 41 (1.93%) Windows 10
5 35 (1.65%) Windows Server 2016
6 29 (1.36%) Windows Server 2019
7 21 (0.99%) Apple iOS
8 15 (0.71%) Android
9 6 (0.28%) Unix
9 6 (0.28%) Windows Server 2012
10 5 (0.24%) VMS
11 4 (0.19%) DC/OS
11 4 (0.19%) Red Hat Enterprise Linux
12 2 (0.094%) Windows 7
12 2 (0.094%) Windows 8
12 2 (0.094%) Windows Vista
13 1 (0.047%) Debian
13 1 (0.047%) Mac OS
13 1 (0.047%) Scientific Linux
13 1 (0.047%) Ubuntu
Processes & Methodologies
1 606 (28.50%) Agile
2 437 (20.56%) Problem-Solving
3 423 (19.90%) Mentoring
4 392 (18.44%) Project Management
5 318 (14.96%) Coaching
6 250 (11.76%) Customer Service
7 235 (11.05%) Continuous Improvement
8 222 (10.44%) Project Delivery
9 215 (10.11%) DevOps
10 207 (9.74%) ITIL
10 207 (9.74%) Roadmaps
11 191 (8.98%) Software Engineering
12 173 (8.14%) Scrum
13 166 (7.81%) Decision-Making
14 158 (7.43%) Business Intelligence
15 157 (7.38%) CI/CD
16 140 (6.59%) Stakeholder Management
17 135 (6.35%) Cybersecurity
18 120 (5.64%) Service Delivery
19 114 (5.36%) Analytics
Programming Languages
1 192 (9.03%) SQL
2 185 (8.70%) Python
3 182 (8.56%) JavaScript
4 172 (8.09%) Java
5 103 (4.84%) C#
6 88 (4.14%) TypeScript
7 34 (1.60%) C
7 34 (1.60%) PowerShell
8 25 (1.18%) T-SQL
9 24 (1.13%) R
10 18 (0.85%) Data Analysis Expressions
11 16 (0.75%) Kotlin
12 15 (0.71%) PHP
13 14 (0.66%) XPath
14 12 (0.56%) Scala
15 10 (0.47%) C++
15 10 (0.47%) Go
15 10 (0.47%) Ruby
16 7 (0.33%) PL/SQL
16 7 (0.33%) VBA
Qualifications
1 415 (19.52%) Degree
2 142 (6.68%) Security Cleared
3 134 (6.30%) DBS Check
4 75 (3.53%) SC Cleared
5 59 (2.78%) PMI Certification
6 48 (2.26%) PMP
7 36 (1.69%) Cisco Certification
8 35 (1.65%) DV Cleared
9 33 (1.55%) AWS Certification
9 33 (1.55%) Computer Science Degree
10 29 (1.36%) APMP
10 29 (1.36%) AWS Certified Solutions Architect
10 29 (1.36%) ITIL Certification
11 28 (1.32%) CAPM
11 28 (1.32%) PgMP
12 27 (1.27%) BPSS Clearance
13 25 (1.18%) Microsoft Certification
14 24 (1.13%) Azure Certification
14 24 (1.13%) CCNP
15 21 (0.99%) CISSP
Quality Assurance & Compliance
1 183 (8.61%) QA
2 78 (3.67%) SLA
3 65 (3.06%) GDPR
4 44 (2.07%) ISO/IEC 27001
5 43 (2.02%) PMO
6 28 (1.32%) Cyber Essentials
6 28 (1.32%) Data Quality
7 27 (1.27%) Accessibility
8 26 (1.22%) ISO 9001
9 21 (0.99%) GMP
10 17 (0.80%) NIST
11 16 (0.75%) NCSC
12 11 (0.52%) GRC
13 10 (0.47%) NEBOSH
14 8 (0.38%) COSHH
14 8 (0.38%) Def Stans
15 7 (0.33%) DO-254
15 7 (0.33%) ISO/IEC 20000
15 7 (0.33%) PCI DSS
15 7 (0.33%) SOC 1
System Software
1 117 (5.50%) Active Directory
2 104 (4.89%) VMware Infrastructure
3 57 (2.68%) Hyper-V
4 40 (1.88%) Docker
5 29 (1.36%) Virtual Desktop
6 24 (1.13%) Firmware
7 15 (0.71%) vSphere
8 13 (0.61%) VMware ESXi
9 7 (0.33%) IAG
10 6 (0.28%) Microsoft Virtual Server
10 6 (0.28%) Virtual Servers
11 4 (0.19%) pfSense
12 3 (0.14%) Embedded Firmware
12 3 (0.14%) XenApp
12 3 (0.14%) XenDesktop
13 2 (0.094%) BitLocker
13 2 (0.094%) VMware Workstation
14 1 (0.047%) Lustre
14 1 (0.047%) Slurm Workload Manager
Systems Management
1 50 (2.35%) Terraform
2 33 (1.55%) Kubernetes
3 18 (0.85%) Active Directory Federation Services
4 17 (0.80%) Ansible
5 15 (0.71%) Progress Chef
5 15 (0.71%) SCCM
6 13 (0.61%) Microsoft Intune
7 12 (0.56%) Opsgenie
7 12 (0.56%) VxRail
7 12 (0.56%) WSUS
7 12 (0.56%) ZABBIX
8 10 (0.47%) FortiGate
9 9 (0.42%) vCenter Server
10 8 (0.38%) Failover Clustering
10 8 (0.38%) QRadar
11 6 (0.28%) Nagios
12 4 (0.19%) Puppet
13 3 (0.14%) logstash
14 2 (0.094%) EMC NetWorker
14 2 (0.094%) Microsoft Clustering
Vendors
1 402 (18.91%) Microsoft
2 152 (7.15%) Google
3 112 (5.27%) VMware
4 64 (3.01%) Cisco
5 44 (2.07%) Salesforce
6 37 (1.74%) Sophos
7 36 (1.69%) SAP
8 28 (1.32%) Dell
8 28 (1.32%) Oracle
9 25 (1.18%) Adobe
10 24 (1.13%) Veeam
11 22 (1.03%) Fortinet
12 21 (0.99%) Citrix
13 18 (0.85%) ServiceNow
13 18 (0.85%) SolarWinds
14 17 (0.80%) HP
14 17 (0.80%) NetApp
15 16 (0.75%) Apple
16 15 (0.71%) CheckPoint
17 14 (0.66%) Cognizant