Salesforce Jobs in England

Salesforce
UK > England

The table below provides summary statistics for permanent job vacancies advertised in England requiring knowledge or experience of Salesforce products and/or services. It includes a benchmarking guide to the annual salaries offered in vacancies that cited Salesforce over the 6 months leading up to 28 May 2025, comparing them to the same period in the previous two years.

The figures below represent the IT labour market in general and are not representative of salaries within Salesforce.

6 months to
28 May 2025
Same period 2024 Same period 2023
Rank 166 209 169
Rank change year-on-year +43 -40 +15
Permanent jobs citing Salesforce 959 1,219 1,887
As % of all permanent jobs advertised in England 1.98% 1.38% 2.17%
As % of the Vendors category 5.07% 3.84% 5.18%
Number of salaries quoted 453 924 1,328
10th Percentile £28,822 £33,750 £37,500
25th Percentile £32,500 £38,000 £46,570
Median annual salary (50th Percentile) £50,000 £50,000 £60,899
Median % change year-on-year - -17.90% -2.56%
75th Percentile £73,750 £71,563 £82,500
90th Percentile £94,500 £90,000 £92,500
UK median annual salary £50,000 £50,000 £60,899
% change year-on-year - -17.90% -2.56%

All Vendors
England

Salesforce falls under the Vendor Products and Services category. For comparison with the information above, the following table provides summary statistics for all permanent job vacancies requiring knowledge or experience of all vendor products and services in England.

Permanent vacancies with a requirement for knowledge or experience of vendor products and services 18,901 31,723 36,452
As % of all permanent jobs advertised in England 39.07% 35.88% 41.85%
Number of salaries quoted 10,413 22,631 21,251
10th Percentile £27,500 £26,500 £31,000
25th Percentile £37,500 £35,922 £41,250
Median annual salary (50th Percentile) £55,000 £50,000 £57,500
Median % change year-on-year +10.00% -13.04% +4.55%
75th Percentile £70,600 £68,750 £75,000
90th Percentile £90,000 £87,500 £92,500
UK median annual salary £55,000 £50,000 £57,500
% change year-on-year +10.00% -13.04% +4.55%

Salesforce
Job Vacancy Trend in England

Job postings citing Salesforce as a proportion of all IT jobs advertised in England.
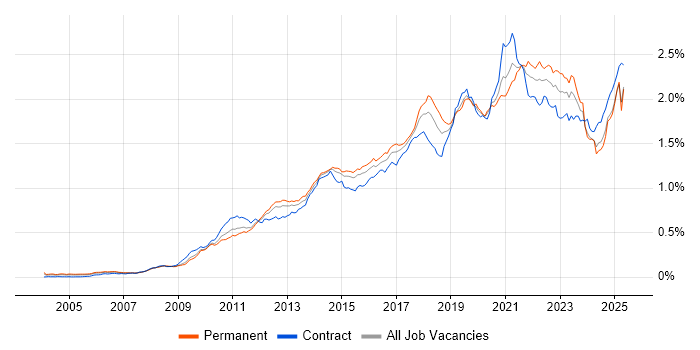
Job vacancy trend for Salesforce in England

Salesforce
Salary Trend in England

3-month moving average salary quoted in jobs citing Salesforce in England.

Salary trend for Salesforce in England

Salesforce
Salary Histogram in England

Salary distribution for jobs citing Salesforce in England over the 6 months to 28 May 2025.

Salary histogram for Salesforce in England

Salesforce
Job Locations in England

The table below looks at the demand and provides a guide to the median salaries quoted in IT jobs citing Salesforce within the England region over the 6 months to 28 May 2025. The 'Rank Change' column provides an indication of the change in demand within each location based on the same 6 month period last year.

Location Rank Change
on Same Period
Last Year
Matching
Permanent
IT Job Ads
Median Salary
Past 6 Months
Median Salary
% Change
on Same Period
Last Year
Live
Jobs
London +55 369 £67,500 +8.00% 1,551
Midlands +45 174 £30,580 -18.45% 1,203
South East -25 140 £46,000 +21.05% 1,817
West Midlands +53 130 £30,580 -14.34% 643
North of England +15 110 £34,755 -26.83% 1,425
North West +15 73 £34,755 -30.49% 668
East of England +53 61 £85,000 +54.55% 927
South West +82 48 £55,893 -3.80% 722
East Midlands +44 44 £59,000 +24.21% 478
Yorkshire +31 36 £33,500 -16.25% 601
North East +40 1 £42,685 -25.77% 158
Salesforce
UK

Salesforce
Co-occurring Skills and Capabilities in England by Category

The follow tables expand on the table above by listing co-occurrences grouped by category. The same employment type, locality and period is covered with up to 20 co-occurrences shown in each of the following categories:

Application Platforms
1 87 (9.07%) Confluence
2 26 (2.71%) SharePoint
3 21 (2.19%) Microsoft Exchange
4 20 (2.09%) CMS
5 6 (0.63%) Sitecore CMS
6 5 (0.52%) WordPress
7 2 (0.21%) Apache Airflow
7 2 (0.21%) CoreMedia CMS
8 1 (0.10%) Apache
8 1 (0.10%) ArcGIS
8 1 (0.10%) Headless CMS
8 1 (0.10%) IIS
8 1 (0.10%) SharePoint Server
8 1 (0.10%) Umbraco
Applications
1 252 (26.28%) Microsoft Office
2 52 (5.42%) Microsoft Excel
3 19 (1.98%) Microsoft PowerPoint
4 16 (1.67%) MS Visio
5 11 (1.15%) Maya
6 7 (0.73%) Spreadsheet
7 5 (0.52%) Microsoft Project
8 4 (0.42%) Photoshop
9 1 (0.10%) Adobe Creative Suite
9 1 (0.10%) Adobe Premiere
9 1 (0.10%) Chatbot
Business Applications
1 136 (14.18%) Salesforce CRM
2 47 (4.90%) NetSuite
3 32 (3.34%) Dynamics CRM
4 11 (1.15%) JDE OneWorld
5 10 (1.04%) Shopify
6 4 (0.42%) SAP S/4HANA
7 3 (0.31%) SAP Business One
7 3 (0.31%) SAP CX
8 2 (0.21%) Adobe Campaign
8 2 (0.21%) Odoo
8 2 (0.21%) Sage 1000
8 2 (0.21%) SAP Hybris
9 1 (0.10%) Eloqua
9 1 (0.10%) Magento
9 1 (0.10%) Maximo
9 1 (0.10%) Oracle EBS
9 1 (0.10%) Oracle ERP
9 1 (0.10%) Summit
9 1 (0.10%) TrackWise
Cloud Services
1 83 (8.65%) Miro
2 78 (8.13%) Asana
3 70 (7.30%) SaaS
4 56 (5.84%) Azure
5 52 (5.42%) Power Platform
6 48 (5.01%) Salesforce Sales Cloud
7 46 (4.80%) Salesforce Service Cloud
8 43 (4.48%) Microsoft 365
9 42 (4.38%) Boomi
10 39 (4.07%) AWS
11 18 (1.88%) Salesforce Commerce Cloud
12 15 (1.56%) Google Analytics
13 14 (1.46%) Amazon CloudWatch
13 14 (1.46%) Amazon SQS
13 14 (1.46%) AWS CodeDeploy
13 14 (1.46%) AWS CodePipeline
13 14 (1.46%) AWS Lambda
13 14 (1.46%) AWS Step Functions
13 14 (1.46%) Entra ID
13 14 (1.46%) Serverless
Communications & Networking
1 73 (7.61%) Broadband
2 4 (0.42%) FTP
3 3 (0.31%) DNS
3 3 (0.31%) Wi-Fi
4 2 (0.21%) DHCP
4 2 (0.21%) TCP/IP
4 2 (0.21%) VLAN
5 1 (0.10%) HTTP
5 1 (0.10%) Internet
5 1 (0.10%) LTE
5 1 (0.10%) SMTP
5 1 (0.10%) SSL
5 1 (0.10%) Unified Communications
5 1 (0.10%) VPN
5 1 (0.10%) WAN
5 1 (0.10%) WPA
Database & Business Intelligence
1 51 (5.32%) Power BI
2 31 (3.23%) Tableau
3 22 (2.29%) Data Lake
4 14 (1.46%) Big Data
5 13 (1.36%) SQL Server
6 8 (0.83%) Relational Database
7 7 (0.73%) Data Warehouse
8 6 (0.63%) Metadata
9 5 (0.52%) Electronic Patient Records
10 4 (0.42%) Looker
10 4 (0.42%) MySQL
10 4 (0.42%) RDBMS
10 4 (0.42%) SAP BW
10 4 (0.42%) Snowflake Schema
11 3 (0.31%) Amazon Redshift
11 3 (0.31%) BigQuery
11 3 (0.31%) Data Mining
11 3 (0.31%) Mixpanel
11 3 (0.31%) SQL Server Integration Services
12 2 (0.21%) SQL Server Reporting Services
Development Applications
1 135 (14.08%) JIRA
2 8 (0.83%) Git
3 6 (0.63%) Bitbucket
4 5 (0.52%) Jenkins
5 2 (0.21%) LabVIEW
5 2 (0.21%) Postman
6 1 (0.10%) Ant
6 1 (0.10%) Log4Net
6 1 (0.10%) Oracle APEX
6 1 (0.10%) SoapUI
6 1 (0.10%) SonarQube
6 1 (0.10%) SQL Server Management Studio (SSMS)
6 1 (0.10%) Team Foundation Server
6 1 (0.10%) Visual Studio
6 1 (0.10%) Visual Studio Code
General
1 424 (44.21%) Social Skills
2 377 (39.31%) Finance
3 294 (30.66%) Marketing
4 143 (14.91%) Legal
5 129 (13.45%) Analytical Skills
6 82 (8.55%) Influencing Skills
7 78 (8.13%) Law
8 70 (7.30%) Presentation Skills
9 56 (5.84%) Public Sector
10 42 (4.38%) Inclusion and Diversity
11 35 (3.65%) Organisational Skills
12 34 (3.55%) Retail
13 24 (2.50%) Advertising
14 22 (2.29%) German Language
15 21 (2.19%) Manufacturing
16 15 (1.56%) Publishing
17 12 (1.25%) Games
18 10 (1.04%) Banking
18 10 (1.04%) Financial Institution
19 9 (0.94%) Billing
Job Titles
1 155 (16.16%) Analyst
2 123 (12.83%) Customer Executive
3 87 (9.07%) Business Manager
4 85 (8.86%) Senior
5 84 (8.76%) Development Manager
6 83 (8.65%) Business Development Manager
7 76 (7.92%) Architect
8 74 (7.72%) Product Analyst
9 71 (7.40%) Developer
9 71 (7.40%) Lead
10 58 (6.05%) Salesforce Architect
11 51 (5.32%) Administrator
12 47 (4.90%) Business Analyst
12 47 (4.90%) Salesforce Developer
13 42 (4.38%) Project Manager
14 26 (2.71%) Enterprise Architect
14 26 (2.71%) Salesforce Administrator
14 26 (2.71%) Senior Manager
15 24 (2.50%) Consultant
16 23 (2.40%) Solutions Architect
Libraries, Frameworks & Software Standards
1 91 (9.49%) Lightning Web Components
2 57 (5.94%) REST
2 57 (5.94%) SOAP
3 38 (3.96%) Middleware
4 31 (3.23%) HTML
5 26 (2.71%) Visualforce
6 23 (2.40%) CSS
7 21 (2.19%) SailPoint
8 19 (1.98%) OAuth
9 17 (1.77%) JWT
10 15 (1.56%) JSON
11 14 (1.46%) RESTful
11 14 (1.46%) XML
12 13 (1.36%) jQuery
12 13 (1.36%) Web Services
13 12 (1.25%) .NET
14 11 (1.15%) CSS3
14 11 (1.15%) Hibernate
15 4 (0.42%) Oracle Fusion
15 4 (0.42%) YAML
Miscellaneous
1 118 (12.30%) Product Ownership
2 109 (11.37%) Self-Motivation
3 72 (7.51%) Over-the-Top Content
3 72 (7.51%) Video\Live Streaming
4 61 (6.36%) Management Information System
5 38 (3.96%) Enterprise Software
6 25 (2.61%) Analytical Mindset
7 23 (2.40%) Onboarding
8 22 (2.29%) Virtual Team
9 19 (1.98%) Legacy Systems
10 17 (1.77%) Cloud Native
10 17 (1.77%) Satnav
11 13 (1.36%) Social Media
11 13 (1.36%) Taxonomies
12 11 (1.15%) Blog
12 11 (1.15%) Marketing Technology
13 9 (0.94%) NHS
14 5 (0.52%) PACS
15 4 (0.42%) Educational Technology
15 4 (0.42%) Life Science
Operating Systems
1 19 (1.98%) Linux
2 15 (1.56%) Windows
3 4 (0.42%) Windows Server
4 2 (0.21%) Debian
4 2 (0.21%) SUSE
4 2 (0.21%) Ubuntu
4 2 (0.21%) Windows 10
5 1 (0.10%) Mac OS
Processes & Methodologies
1 433 (45.15%) CRM
2 253 (26.38%) Agile
3 245 (25.55%) Business Development
4 212 (22.11%) Decision-Making
5 202 (21.06%) Stakeholder Management
6 186 (19.40%) Problem-Solving
7 178 (18.56%) Roadmaps
8 164 (17.10%) Data-Driven Decision Making
9 138 (14.39%) B2B
10 129 (13.45%) Contract Negotiation
11 111 (11.57%) Project Management
12 107 (11.16%) Continuous Improvement
13 106 (11.05%) Customer Service
14 96 (10.01%) Analytics
15 94 (9.80%) Product Management
16 89 (9.28%) Value Proposition
17 81 (8.45%) DevOps
18 78 (8.13%) Customer-Centricity
18 78 (8.13%) Deadline-Driven
19 77 (8.03%) Active Listening
Programming Languages
1 87 (9.07%) Apex Code
2 64 (6.67%) SQL
3 42 (4.38%) JavaScript
4 23 (2.40%) C#
4 23 (2.40%) PowerShell
5 17 (1.77%) Java
6 11 (1.15%) SOQL
7 9 (0.94%) Python
8 6 (0.63%) PHP
8 6 (0.63%) T-SQL
9 4 (0.42%) VBA
10 2 (0.21%) PL/SQL
10 2 (0.21%) VB.NET
11 1 (0.10%) ActionScript
11 1 (0.10%) ActionScript 2.0
11 1 (0.10%) C
11 1 (0.10%) Data Analysis Expressions
11 1 (0.10%) Scala
11 1 (0.10%) SOSL
11 1 (0.10%) TypeScript
Qualifications
1 170 (17.73%) Degree
2 44 (4.59%) Computer Science Degree
3 26 (2.71%) Security Cleared
4 25 (2.61%) Master's Degree
5 17 (1.77%) HND
6 16 (1.67%) HNC
7 14 (1.46%) PMI Certification
8 13 (1.36%) DBS Check
8 13 (1.36%) PMP
9 11 (1.15%) CISSP
10 8 (0.83%) SC Cleared
11 3 (0.31%) Numerate Degree
11 3 (0.31%) PRINCE2 Practitioner
12 2 (0.21%) BPSS Clearance
12 2 (0.21%) CITP
12 2 (0.21%) ISEB
13 1 (0.10%) AWS Certification
13 1 (0.10%) Azure Certification
13 1 (0.10%) MBA
13 1 (0.10%) TOGAF Certification
Quality Assurance & Compliance
1 86 (8.97%) SLA
2 43 (4.48%) Data Quality
3 29 (3.02%) QA
4 19 (1.98%) Accessibility
5 18 (1.88%) GDPR
6 7 (0.73%) Cyber Essentials
7 4 (0.42%) PMO
8 3 (0.31%) GMP
8 3 (0.31%) PMBOK
8 3 (0.31%) WCAG
9 2 (0.21%) 21 CFR Part 11
9 2 (0.21%) ISO/IEC 27001
10 1 (0.10%) GLP
10 1 (0.10%) GxP
10 1 (0.10%) HIPAA
10 1 (0.10%) ISO 9001
10 1 (0.10%) NCSC
10 1 (0.10%) NIST
10 1 (0.10%) SOC 2
System Software
1 31 (3.23%) Active Directory
2 2 (0.21%) VMware ESXi
2 2 (0.21%) VMware Infrastructure
2 2 (0.21%) vSphere
3 1 (0.10%) Docker
Systems Management
1 6 (0.63%) Terraform
2 4 (0.42%) Single Sign-On
3 3 (0.31%) Microsoft Intune
4 2 (0.21%) Systems Management Server (SMS)
5 1 (0.10%) Ansible
5 1 (0.10%) PaperCut
Vendors
1 191 (19.92%) Microsoft
2 142 (14.81%) SAP
3 47 (4.90%) Google
4 43 (4.48%) MuleSoft
5 37 (3.86%) Salesforce Marketing Cloud
6 36 (3.75%) Oracle
7 30 (3.13%) Dell
8 27 (2.82%) ServiceNow
9 21 (2.19%) Okta
10 20 (2.09%) Adobe
10 20 (2.09%) Informatica
11 14 (1.46%) HubSpot
11 14 (1.46%) Pardot
12 10 (1.04%) Facebook
13 9 (0.94%) IBM
14 7 (0.73%) Databricks
15 6 (0.63%) Screaming Frog
15 6 (0.63%) Siebel
15 6 (0.63%) Sitecore
15 6 (0.63%) YouTube