Emotional Intelligence Jobs

Emotional Intelligence (Emotional Quotient)
UK

The table below provides summary statistics for permanent job vacancies requiring Emotional Intelligence skills. It includes a benchmarking guide to the annual salaries offered in vacancies that cited Emotional Intelligence over the 6 months leading up to 13 May 2025, comparing them to the same period in the previous two years.

6 months to
13 May 2025
Same period 2024 Same period 2023
Rank 642 812 772
Rank change year-on-year +170 -40 +9
Permanent jobs citing Emotional Intelligence 70 89 189
As % of all permanent jobs advertised in the UK 0.13% 0.090% 0.19%
As % of the Processes & Methodologies category 0.13% 0.10% 0.20%
Number of salaries quoted 41 48 69
10th Percentile £42,500 £25,759 £41,223
25th Percentile £55,000 £33,125 £50,469
Median annual salary (50th Percentile) £80,000 £41,250 £65,000
Median % change year-on-year +93.94% -36.54% +13.04%
75th Percentile £137,500 £77,500 £77,500
90th Percentile - £123,749 £88,750
UK excluding London median annual salary £60,000 £42,500 £59,526
% change year-on-year +41.18% -28.60% +13.38%

All Process and Methodology Skills
UK

Emotional Intelligence falls under the Processes and Methodologies category. For comparison with the information above, the following table provides summary statistics for all permanent job vacancies requiring process or methodology skills.

Permanent vacancies with a requirement for process or methodology skills 51,972 84,955 96,877
As % of all permanent jobs advertised in the UK 93.89% 85.58% 95.60%
Number of salaries quoted 26,632 59,894 57,116
10th Percentile £30,000 £29,002 £34,000
25th Percentile £42,000 £40,000 £45,000
Median annual salary (50th Percentile) £57,500 £55,000 £61,000
Median % change year-on-year +4.55% -9.84% +1.67%
75th Percentile £75,000 £72,500 £81,250
90th Percentile £97,500 £92,500 £100,000
UK excluding London median annual salary £52,365 £50,000 £55,000
% change year-on-year +4.73% -9.09% +4.76%

Emotional Intelligence
Job Vacancy Trend

Job postings citing Emotional Intelligence as a proportion of all IT jobs advertised.
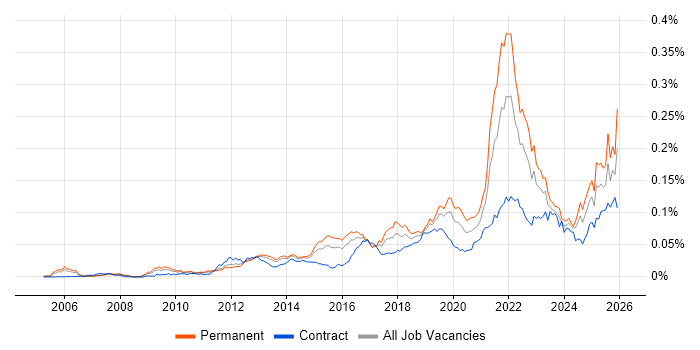
Job vacancy trend for Emotional Intelligence in the UK

Emotional Intelligence
Salary Trend

3-month moving average salary quoted in jobs citing Emotional Intelligence.

Salary trend for Emotional Intelligence in the UK

Emotional Intelligence
Salary Histogram

Salary distribution for jobs citing Emotional Intelligence over the 6 months to 13 May 2025.

Salary histogram for Emotional Intelligence in the UK

Emotional Intelligence
Top 12 Job Locations

The table below looks at the demand and provides a guide to the median salaries quoted in IT jobs citing Emotional Intelligence within the UK over the 6 months to 13 May 2025. The 'Rank Change' column provides an indication of the change in demand within each location based on the same 6 month period last year.

Location Rank Change
on Same Period
Last Year
Matching
Permanent
IT Job Ads
Median Salary
Past 6 Months
Median Salary
% Change
on Same Period
Last Year
Live
Jobs
England +140 63 £90,000 +118.18% 159
London +109 39 £125,000 +203.03% 97
UK excluding London +161 22 £60,000 +41.18% 80
Work from Home +105 18 £55,000 -43.59% 58
Midlands +76 12 £48,750 - 6
West Midlands +59 12 £48,750 - 4
South West +120 4 £70,000 - 9
North of England +48 4 £60,743 -48.92% 23
Yorkshire +71 2 £60,743 -48.92% 7
North West +11 2 £90,000 -7.18% 14
South East +81 1 £65,000 +52.94% 33
East of England +32 1 £80,000 +203.36% 5

Emotional Intelligence
Co-occurring Skills and Capabilities by Category

The follow tables expand on the table above by listing co-occurrences grouped by category. The same employment type, locality and period is covered with up to 20 co-occurrences shown in each of the following categories:

Application Platforms
1 1 (1.43%) CMS
1 1 (1.43%) Microsoft Exchange
1 1 (1.43%) SharePoint
Applications
1 6 (8.57%) Microsoft Excel
2 5 (7.14%) Microsoft PowerPoint
3 1 (1.43%) Microsoft Office
Business Applications
1 3 (4.29%) Adobe Campaign
2 1 (1.43%) SAP ERP
Cloud Services
1 15 (21.43%) AWS
2 14 (20.00%) Amazon EC2
3 4 (5.71%) Power Platform
4 3 (4.29%) Contentful
4 3 (4.29%) Google Analytics
5 2 (2.86%) Azure
5 2 (2.86%) GCP
5 2 (2.86%) GitHub
5 2 (2.86%) Google Tag Manager
6 1 (1.43%) ChatGPT
6 1 (1.43%) Cloud Computing
6 1 (1.43%) Entra ID
6 1 (1.43%) MailChimp
6 1 (1.43%) Microsoft 365
6 1 (1.43%) PowerApps
Communications & Networking
1 2 (2.86%) Firewall
2 1 (1.43%) DNS
2 1 (1.43%) Intranet
2 1 (1.43%) SAN
Database & Business Intelligence
1 14 (20.00%) PostgreSQL
2 3 (4.29%) Power BI
2 3 (4.29%) Tableau
3 2 (2.86%) BigQuery
3 2 (2.86%) Looker
4 1 (1.43%) Amazon RDS
4 1 (1.43%) Relational Database
Development Applications
1 14 (20.00%) IntelliJ
2 2 (2.86%) Git
3 1 (1.43%) JIRA
3 1 (1.43%) Subversion
General
1 21 (30.00%) Finance
2 18 (25.71%) Social Skills
3 13 (18.57%) Analytical Skills
4 12 (17.14%) Influencing Skills
5 7 (10.00%) Marketing
6 6 (8.57%) Legal
6 6 (8.57%) Presentation Skills
7 5 (7.14%) Inclusion and Diversity
8 4 (5.71%) Banking
8 4 (5.71%) Fire and Rescue
9 3 (4.29%) Public Sector
10 2 (2.86%) Front Office
10 2 (2.86%) Law
10 2 (2.86%) Local Government
10 2 (2.86%) Manufacturing
10 2 (2.86%) Pharmaceutical
11 1 (1.43%) Automotive
11 1 (1.43%) Back Office
11 1 (1.43%) Dutch Language
11 1 (1.43%) Organisational Skills
Job Titles
1 19 (27.14%) Senior
2 17 (24.29%) Lead
3 14 (20.00%) Java Engineer
3 14 (20.00%) Senior Java Engineer
4 6 (8.57%) Analyst
5 4 (5.71%) Analytics Manager
5 4 (5.71%) Development Officer
6 3 (4.29%) Business Analyst
6 3 (4.29%) Business Development Executive
6 3 (4.29%) Product Lead
7 2 (2.86%) Business Intelligence Manager
7 2 (2.86%) Business Manager
7 2 (2.86%) Performance Analyst
7 2 (2.86%) Performance Manager
7 2 (2.86%) Portfolio Manager
7 2 (2.86%) Product Manager
7 2 (2.86%) Project Analyst
7 2 (2.86%) Project Manager
7 2 (2.86%) Regulatory Change Business Analyst
7 2 (2.86%) Regulatory Change Manager
Libraries, Frameworks & Software Standards
1 14 (20.00%) React
1 14 (20.00%) REST
2 1 (1.43%) Django
2 1 (1.43%) EDI
2 1 (1.43%) Flask
Miscellaneous
1 4 (5.71%) Analytical Mindset
1 4 (5.71%) Self-Motivation
2 3 (4.29%) Management Information System
2 3 (4.29%) Marketing Technology
2 3 (4.29%) Virtual Team
3 2 (2.86%) Algorithms
3 2 (2.86%) Mobile App
3 2 (2.86%) Onboarding
3 2 (2.86%) Robotics
4 1 (1.43%) Cyber Security Posture
4 1 (1.43%) Data Structures
4 1 (1.43%) Enterprise Software
4 1 (1.43%) Foreign Exchange (FX)
4 1 (1.43%) Product Ownership
4 1 (1.43%) Social Media
Operating Systems
1 4 (5.71%) Windows
2 1 (1.43%) Linux
2 1 (1.43%) Unix
2 1 (1.43%) Windows Server
2 1 (1.43%) Windows Server 2016
Processes & Methodologies
1 32 (45.71%) Problem-Solving
2 23 (32.86%) Agile
3 16 (22.86%) Creative Thinking
4 14 (20.00%) Application Security
4 14 (20.00%) Containerisation
4 14 (20.00%) Open Source
4 14 (20.00%) Security Testing
4 14 (20.00%) Software Testing
4 14 (20.00%) TDD
5 12 (17.14%) Roadmaps
6 11 (15.71%) Project Management
7 10 (14.29%) Collaborative Working
7 10 (14.29%) Stakeholder Management
8 8 (11.43%) Continuous Improvement
8 8 (11.43%) Decision-Making
8 8 (11.43%) Line Management
9 7 (10.00%) Mentoring
9 7 (10.00%) Project Delivery
9 7 (10.00%) Risk Management
9 7 (10.00%) Strategic Thinking
Programming Languages
1 14 (20.00%) Java
2 8 (11.43%) Python
2 8 (11.43%) SQL
3 2 (2.86%) PowerShell
4 1 (1.43%) R
Qualifications
1 23 (32.86%) Degree
2 17 (24.29%) Master's Degree
3 14 (20.00%) PhD
4 3 (4.29%) DV Cleared
4 3 (4.29%) Security Cleared
5 2 (2.86%) DBS Check
5 2 (2.86%) MBA
6 1 (1.43%) Computer Science Degree
6 1 (1.43%) CRISC
6 1 (1.43%) MCSA
6 1 (1.43%) Microsoft Certification
6 1 (1.43%) Numerate Degree
Quality Assurance & Compliance
1 4 (5.71%) QA
2 2 (2.86%) EMIR
2 2 (2.86%) MiFID
3 1 (1.43%) Accessibility
3 1 (1.43%) COBIT
3 1 (1.43%) Data Quality
3 1 (1.43%) GRC
3 1 (1.43%) PMO
System Software
1 15 (21.43%) Docker
2 1 (1.43%) Active Directory
2 1 (1.43%) Hyper-V
2 1 (1.43%) VMware Infrastructure
Systems Management
1 15 (21.43%) Kubernetes
2 3 (4.29%) EMC NetWorker
3 1 (1.43%) Microsoft Intune
3 1 (1.43%) Single Sign-On
Vendors
1 8 (11.43%) Microsoft
2 5 (7.14%) Google
2 5 (7.14%) Salesforce
3 3 (4.29%) Adobe
3 3 (4.29%) Facebook
3 3 (4.29%) Optimizely
4 2 (2.86%) TippingPoint
4 2 (2.86%) YouTube
5 1 (1.43%) Avaya
5 1 (1.43%) Bloomberg
5 1 (1.43%) Cisco
5 1 (1.43%) Dell
5 1 (1.43%) Fortinet
5 1 (1.43%) Instagram
5 1 (1.43%) Oracle
5 1 (1.43%) SAP
5 1 (1.43%) TikTok
5 1 (1.43%) Veeam
5 1 (1.43%) VMware
5 1 (1.43%) WatchGuard