Application Security Jobs

Application Security (AppSec)
UK

The table below provides summary statistics for permanent job vacancies requiring Application Security skills. It includes a benchmarking guide to the annual salaries offered in vacancies that cited Application Security over the 6 months leading up to 29 May 2025, comparing them to the same period in the previous two years.

6 months to
29 May 2025
Same period 2024 Same period 2023
Rank 513 503 472
Rank change year-on-year -10 -31 +70
Permanent jobs citing Application Security 200 449 606
As % of all permanent jobs advertised in the UK 0.36% 0.44% 0.62%
As % of the Processes & Methodologies category 0.39% 0.52% 0.65%
Number of salaries quoted 142 301 365
10th Percentile £51,461 £46,250 £37,500
25th Percentile £60,000 £56,250 £55,000
Median annual salary (50th Percentile) £75,000 £75,000 £77,500
Median % change year-on-year - -3.23% +10.71%
75th Percentile £106,250 £90,000 £95,000
90th Percentile £137,500 £106,250 £113,750
UK excluding London median annual salary £62,500 £65,000 £58,750
% change year-on-year -3.85% +10.64% +6.82%

All Process and Methodology Skills
UK

Application Security falls under the Processes and Methodologies category. For comparison with the information above, the following table provides summary statistics for all permanent job vacancies requiring process or methodology skills.

Permanent vacancies with a requirement for process or methodology skills 51,417 86,448 93,028
As % of all permanent jobs advertised in the UK 93.74% 84.24% 95.56%
Number of salaries quoted 25,323 60,550 54,986
10th Percentile £29,000 £29,250 £34,000
25th Percentile £41,250 £40,000 £45,000
Median annual salary (50th Percentile) £57,500 £55,000 £61,000
Median % change year-on-year +4.55% -9.84% +1.67%
75th Percentile £75,000 £72,500 £81,250
90th Percentile £97,500 £92,500 £100,000
UK excluding London median annual salary £51,564 £50,000 £55,000
% change year-on-year +3.13% -9.09% +4.76%

Application Security
Job Vacancy Trend

Job postings citing Application Security as a proportion of all IT jobs advertised.
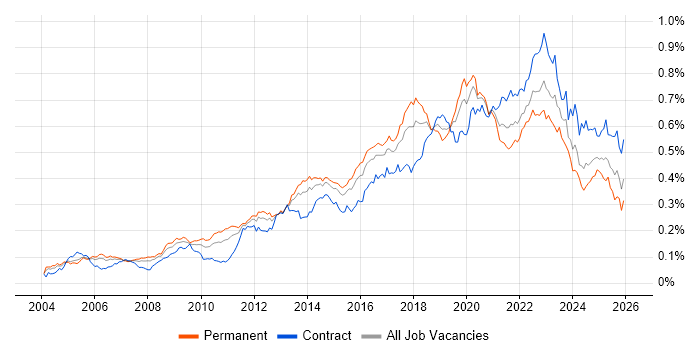
Job vacancy trend for Application Security in the UK

Application Security
Salary Trend

3-month moving average salary quoted in jobs citing Application Security.

Salary trend for Application Security in the UK

Application Security
Salary Histogram

Salary distribution for jobs citing Application Security over the 6 months to 29 May 2025.

Salary histogram for Application Security in the UK

Application Security
Top 14 Job Locations

The table below looks at the demand and provides a guide to the median salaries quoted in IT jobs citing Application Security within the UK over the 6 months to 29 May 2025. The 'Rank Change' column provides an indication of the change in demand within each location based on the same 6 month period last year.

Location Rank Change
on Same Period
Last Year
Matching
Permanent
IT Job Ads
Median Salary
Past 6 Months
Median Salary
% Change
on Same Period
Last Year
Live
Jobs
England -7 186 £75,500 +0.67% 1,125
London 0 109 £95,000 +26.67% 170
UK excluding London +97 83 £62,500 -3.85% 1,090
Work from Home -30 45 £67,500 -3.57% 518
South East +80 38 £60,000 -15.79% 281
Scotland +120 12 £62,500 +25.00% 51
South West +113 12 £66,250 -11.67% 142
Midlands +46 11 £55,000 -4.35% 202
West Midlands +40 7 £55,000 -4.35% 109
North of England -18 6 £65,000 +6.20% 242
East Midlands +36 4 - - 79
North West -28 4 £51,585 -10.29% 110
East of England - 4 £71,500 - 165
Yorkshire +40 2 £67,500 -15.46% 105

Application Security
Co-occurring Skills and Capabilities by Category

The follow tables expand on the table above by listing co-occurrences grouped by category. The same employment type, locality and period is covered with up to 20 co-occurrences shown in each of the following categories:

Application Platforms
1 10 (5.00%) Confluence
2 6 (3.00%) Microsoft Exchange
3 5 (2.50%) Apache Airflow
3 5 (2.50%) Appian
4 4 (2.00%) Apache Spark
4 4 (2.00%) Exchange Server 2010
4 4 (2.00%) Exchange Server 2013
5 3 (1.50%) SharePoint
6 2 (1.00%) CMS
6 2 (1.00%) IIS
6 2 (1.00%) Umbraco
7 1 (0.50%) Apache
7 1 (0.50%) Oracle Workflow
Business Applications
1 3 (1.50%) Dynamics CRM
2 1 (0.50%) Siebel CRM
Cloud Services
1 79 (39.50%) Azure
2 65 (32.50%) AWS
3 38 (19.00%) Azure DevOps
4 27 (13.50%) PaaS
5 22 (11.00%) Amazon EC2
6 18 (9.00%) Power Platform
7 16 (8.00%) GCP
8 14 (7.00%) GitHub
9 11 (5.50%) Azure Logic Apps
9 11 (5.50%) Serverless
10 10 (5.00%) SaaS
11 9 (4.50%) IaaS
12 8 (4.00%) Azure Data Factory
13 7 (3.50%) Amazon S3
13 7 (3.50%) Azure Monitor
13 7 (3.50%) Dynamics 365
14 5 (2.50%) MinIO
15 4 (2.00%) Cloud Functions
15 4 (2.00%) Google Compute Engine
15 4 (2.00%) Power Automate
Communications & Networking
1 15 (7.50%) Firewall
1 15 (7.50%) Network Security
2 4 (2.00%) HTTP
2 4 (2.00%) HTTPS
2 4 (2.00%) TCP/IP
3 3 (1.50%) VPN
3 3 (1.50%) Wi-Fi
4 1 (0.50%) SD-WAN
4 1 (0.50%) SSL
4 1 (0.50%) WAN
Database & Business Intelligence
1 21 (10.50%) PostgreSQL
2 14 (7.00%) SQL Server
3 10 (5.00%) SQL Server Integration Services
4 9 (4.50%) DB2
5 7 (3.50%) Relational Database
6 5 (2.50%) NoSQL
7 4 (2.00%) BigQuery
7 4 (2.00%) Cloud Spanner
8 3 (1.50%) MySQL
9 2 (1.00%) Amazon RDS
9 2 (1.00%) Big Data
9 2 (1.00%) Data Lake
9 2 (1.00%) Data Warehouse
10 1 (0.50%) DataStage
10 1 (0.50%) Hadoop
10 1 (0.50%) HBase
10 1 (0.50%) MariaDB
10 1 (0.50%) MongoDB
10 1 (0.50%) QualityStage
10 1 (0.50%) SQL Server Reporting Services
Development Applications
1 20 (10.00%) IntelliJ
2 13 (6.50%) Jenkins
3 12 (6.00%) JIRA
4 9 (4.50%) Visual Studio
5 8 (4.00%) Selenium
6 6 (3.00%) Atlassian Bamboo
7 5 (2.50%) Robot Framework
7 5 (2.50%) Snyk
7 5 (2.50%) SoapUI
8 4 (2.00%) AppScan
8 4 (2.00%) Bitbucket
8 4 (2.00%) Git
8 4 (2.00%) Mocha
8 4 (2.00%) Postman
8 4 (2.00%) SonarQube
9 3 (1.50%) Cypress.io
9 3 (1.50%) JMeter
9 3 (1.50%) MSTest
9 3 (1.50%) NUnit
9 3 (1.50%) SpecFlow
General
1 55 (27.50%) Finance
2 51 (25.50%) Social Skills
3 27 (13.50%) Analytical Skills
4 7 (3.50%) Banking
5 5 (2.50%) Inclusion and Diversity
5 5 (2.50%) Law
5 5 (2.50%) Retail
6 4 (2.00%) Back Office
6 4 (2.00%) Marketing
6 4 (2.00%) Presentation Skills
6 4 (2.00%) Public Sector
6 4 (2.00%) Publishing
7 3 (1.50%) Advertising
7 3 (1.50%) Games
8 2 (1.00%) Automotive
8 2 (1.00%) Documentation Skills
8 2 (1.00%) Legal
8 2 (1.00%) Pharmaceutical
8 2 (1.00%) Telecoms
9 1 (0.50%) Mandarin Language
Job Titles
1 49 (24.50%) Security Engineer
2 46 (23.00%) Senior
3 37 (18.50%) Lead
4 27 (13.50%) Analyst
5 22 (11.00%) Architect
6 20 (10.00%) Java Engineer
7 16 (8.00%) Security Analyst
8 14 (7.00%) Senior Java Engineer
9 11 (5.50%) Applications Support
9 11 (5.50%) Cybersecurity Analyst
10 10 (5.00%) Applications Engineer
10 10 (5.00%) Senior Security Engineer
11 8 (4.00%) Security Architect
11 8 (4.00%) Software Engineer
12 7 (3.50%) DevSecOps Engineer
12 7 (3.50%) Security Manager
12 7 (3.50%) Senior Analyst
12 7 (3.50%) Solutions Architect
13 6 (3.00%) Applications Support Analyst
13 6 (3.00%) Release Manager
Libraries, Frameworks & Software Standards
1 29 (14.50%) React
2 26 (13.00%) REST
3 24 (12.00%) YAML
4 21 (10.50%) .NET
5 11 (5.50%) .NET Framework
6 9 (4.50%) RESTful
7 8 (4.00%) ASP.NET
8 7 (3.50%) React Native
9 6 (3.00%) Node.js
9 6 (3.00%) Web Services
10 5 (2.50%) .NET Core
10 5 (2.50%) Apache NiFi
10 5 (2.50%) Kafka
10 5 (2.50%) SLSA
11 4 (2.00%) AngularJS
11 4 (2.00%) CSS
11 4 (2.00%) Express.js
11 4 (2.00%) Jest
11 4 (2.00%) Playwright
11 4 (2.00%) SOAP
Miscellaneous
1 25 (12.50%) Security Posture
2 16 (8.00%) Cloud Native
3 13 (6.50%) Mobile App
4 10 (5.00%) Management Information System
5 9 (4.50%) Cyber Threat
6 7 (3.50%) Self-Motivation
7 5 (2.50%) Blog
7 5 (2.50%) Low-Code
7 5 (2.50%) Virtual Team
8 4 (2.00%) Distributed Systems
8 4 (2.00%) Product Ownership
9 3 (1.50%) Operational Technology
10 2 (1.00%) Cyber Defence
10 2 (1.00%) Cyber Kill Chain
10 2 (1.00%) Data Protection Act
10 2 (1.00%) Distributed Denial-of-Service
10 2 (1.00%) Foreign Exchange (FX)
10 2 (1.00%) Online Games
10 2 (1.00%) Security Operations Centre
10 2 (1.00%) YARA
Operating Systems
1 19 (9.50%) Windows
2 8 (4.00%) Linux
3 7 (3.50%) Android
3 7 (3.50%) Apple iOS
4 5 (2.50%) Windows Server
5 4 (2.00%) Windows 7
5 4 (2.00%) Windows Server 2008
5 4 (2.00%) Windows Server 2012
6 1 (0.50%) Kali Linux
6 1 (0.50%) Red Hat Enterprise Linux
6 1 (0.50%) Ubuntu
6 1 (0.50%) Unix
Processes & Methodologies
1 75 (37.50%) Cybersecurity
2 70 (35.00%) CI/CD
3 67 (33.50%) Security Testing
4 66 (33.00%) DevOps
5 58 (29.00%) Problem-Solving
6 53 (26.50%) DevSecOps
7 50 (25.00%) Agile
8 47 (23.50%) Computer Science
9 45 (22.50%) SDLC
10 38 (19.00%) Test Automation
10 38 (19.00%) Threat Modelling
11 37 (18.50%) Creative Thinking
11 37 (18.50%) OWASP
12 34 (17.00%) Cloud Security
13 33 (16.50%) Information Security
14 32 (16.00%) Vulnerability Management
15 31 (15.50%) Dynamic Application Security Testing
16 30 (15.00%) Mentoring
17 28 (14.00%) Penetration Testing
18 27 (13.50%) Containerisation
Programming Languages
1 42 (21.00%) Java
2 31 (15.50%) Python
3 29 (14.50%) PowerShell
4 28 (14.00%) SQL
5 18 (9.00%) C#
5 18 (9.00%) JavaScript
6 10 (5.00%) TypeScript
7 7 (3.50%) PL/SQL
7 7 (3.50%) T-SQL
7 7 (3.50%) VB.NET
8 6 (3.00%) Go
9 5 (2.50%) C++
9 5 (2.50%) Kotlin
10 4 (2.00%) Bash
10 4 (2.00%) C
10 4 (2.00%) Objective-C
11 3 (1.50%) PHP
11 3 (1.50%) Ruby
12 2 (1.00%) Search Processing Language
12 2 (1.00%) Swift
Qualifications
1 69 (34.50%) Degree
2 36 (18.00%) Master's Degree
3 26 (13.00%) Computer Science Degree
4 23 (11.50%) CISSP
5 17 (8.50%) CISM
6 16 (8.00%) Security Cleared
7 14 (7.00%) PhD
8 11 (5.50%) CREST Certified
9 9 (4.50%) AWS Certification
10 8 (4.00%) DV Cleared
10 8 (4.00%) SANS
10 8 (4.00%) SC Cleared
11 7 (3.50%) ISTQB
12 6 (3.00%) CEH
12 6 (3.00%) CRISC
13 5 (2.50%) CISA
13 5 (2.50%) Cisco Certification
13 5 (2.50%) OSCP
14 4 (2.00%) CHECK Team Leader
14 4 (2.00%) ISTQB Foundation Certification
Quality Assurance & Compliance
1 62 (31.00%) NIST
2 47 (23.50%) ISO/IEC 27001
3 30 (15.00%) GDPR
4 27 (13.50%) NCSC
5 16 (8.00%) PCI DSS
6 15 (7.50%) Accessibility
7 11 (5.50%) Cyber Essentials
8 8 (4.00%) SOC 2
9 7 (3.50%) QA
10 5 (2.50%) California Consumer Privacy Act
10 5 (2.50%) COBIT
11 4 (2.00%) SLA
12 3 (1.50%) Cyber Essentials PLUS
12 3 (1.50%) Sarbanes-Oxley
13 2 (1.00%) GRC
13 2 (1.00%) NIST 800
System Software
1 26 (13.00%) Docker
2 9 (4.50%) Active Directory
2 9 (4.50%) VMware Infrastructure
3 1 (0.50%) Firmware
3 1 (0.50%) HDFS
3 1 (0.50%) Hyper-V
Systems Management
1 34 (17.00%) Kubernetes
2 18 (9.00%) Ansible
3 14 (7.00%) Terraform
4 5 (2.50%) HP Fortify
4 5 (2.50%) Progress Chef
4 5 (2.50%) Puppet
5 3 (1.50%) Prometheus
6 2 (1.00%) Argo
6 2 (1.00%) Microsoft Intune
6 2 (1.00%) Nessus
6 2 (1.00%) Single Sign-On
7 1 (0.50%) CASB
7 1 (0.50%) Grafana
7 1 (0.50%) Kiali
7 1 (0.50%) OpenVAS
7 1 (0.50%) SCCM
Vendors
1 43 (21.50%) Microsoft
2 11 (5.50%) Google
3 10 (5.00%) ServiceNow
3 10 (5.00%) VMware
4 8 (4.00%) SolarWinds
5 5 (2.50%) BiZZdesign
5 5 (2.50%) Black Duck
5 5 (2.50%) Cisco
5 5 (2.50%) Salesforce
5 5 (2.50%) Splunk
5 5 (2.50%) UiPath
6 4 (2.00%) Atlassian
6 4 (2.00%) Databricks
6 4 (2.00%) Oracle
7 3 (1.50%) Palo Alto
7 3 (1.50%) Siebel
8 2 (1.00%) Checkmarx
8 2 (1.00%) F5
8 2 (1.00%) Fortinet
8 2 (1.00%) Zscaler