Data Integration
UK

The following table provides summary statistics for permanent job vacancies with a requirement for Data Integration skills. Included is a benchmarking guide to the salaries offered in vacancies that have cited Data Integration over the 6 months to 30 November 2023 with a comparison to the same period in the previous 2 years.

6 months to
30 Nov 2023
Same period 2022 Same period 2021
Rank 251 351 395
Rank change year-on-year +100 +44 -20
Permanent jobs citing Data Integration 728 1,259 1,108
As % of all permanent jobs advertised in the UK 1.35% 1.00% 0.86%
As % of the Processes & Methodologies category 1.44% 1.04% 0.90%
Number of salaries quoted 437 832 726
10th Percentile £43,750 £41,250 £42,500
25th Percentile £51,250 £52,500 £50,000
Median annual salary (50th Percentile) £70,000 £70,000 £62,500
Median % change year-on-year - +12.00% +4.17%
75th Percentile £88,750 £88,283 £81,250
90th Percentile £97,500 £104,625 £95,000
UK excluding London median annual salary £65,000 £57,500 £55,750
% change year-on-year +13.04% +3.14% +4.21%

All Process and Methodology Skills
UK

Data Integration is in the Processes and Methodologies category. The following table is for comparison with the above and provides summary statistics for all permanent job vacancies with a requirement for process or methodology skills.

Permanent vacancies with a requirement for process or methodology skills 50,664 120,987 123,563
As % of all permanent jobs advertised in the UK 94.08% 95.74% 95.44%
Number of salaries quoted 36,731 73,454 82,144
10th Percentile £32,500 £34,347 £32,500
25th Percentile £43,750 £45,000 £42,500
Median annual salary (50th Percentile) £60,000 £60,000 £59,500
Median % change year-on-year - +0.84% +8.18%
75th Percentile £80,000 £81,250 £77,500
90th Percentile £98,750 £100,000 £95,000
UK excluding London median annual salary £52,500 £53,000 £50,000
% change year-on-year -0.94% +6.00% +4.17%

Data Integration
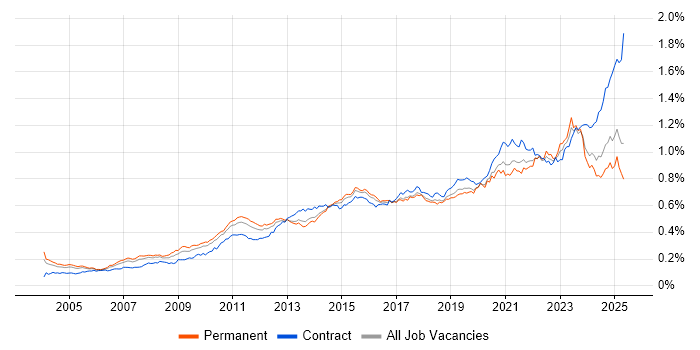
Job Vacancy Trend

Job postings citing Data Integration as a proportion of all IT jobs advertised.

Job vacancy trend for Data Integration in the UK

Data Integration
Salary Trend

3-month moving average salary quoted in jobs citing Data Integration.

Salary trend for Data Integration in the UK

Data Integration
Salary Histogram

Salary distribution for jobs citing Data Integration over the 6 months to 30 November 2023.

Salary histogram for Data Integration in the UK

Data Integration
Top 17 Job Locations

The table below looks at the demand and provides a guide to the median salaries quoted in IT jobs citing Data Integration within the UK over the 6 months to 30 November 2023. The 'Rank Change' column provides an indication of the change in demand within each location based on the same 6 month period last year.

Location Rank Change
on Same Period
Last Year
Matching
Permanent
IT Job Ads
Median Salary
Past 6 Months
Median Salary
% Change
on Same Period
Last Year
Live
Jobs
England +99 650 £70,000 - 269
UK excluding London +126 385 £65,000 +13.04% 123
London +84 266 £75,000 -3.23% 145
Work from Home +45 244 £75,669 +15.80% 121
North of England +76 110 £63,750 +13.02% 38
Midlands +114 99 £55,000 -12.00% 21
South West +116 67 £70,576 +47.42% 13
North West +21 53 £62,500 +10.80% 22
East Midlands +64 52 £50,000 -14.89% 5
South East +94 50 £55,050 -18.44% 43
West Midlands +109 46 £70,000 +12.00% 16
Yorkshire +91 39 £75,000 +11.94% 12
East of England +113 21 £80,000 +52.38% 5
Scotland +51 19 £79,632 +59.26%
North East +52 18 £50,000 -41.18% 4
Wales +16 18 £45,530 +37.16% 4
Northern Ireland +34 1 £45,000 +31.39%

Data Integration
Co-occurring Skills and Capabilities by Category

The follow tables expand on the table above by listing co-occurrences grouped by category. The same employment type, locality and period is covered with up to 20 co-occurrences shown in each of the following categories:

Application Platforms
1 85 (11.68%) Apache Spark
2 54 (7.42%) Apache
3 23 (3.16%) SharePoint
4 10 (1.37%) IIS
5 8 (1.10%) Confluence
6 7 (0.96%) SAS
7 5 (0.69%) Apache Airflow
7 5 (0.69%) IBM HTTP Server
7 5 (0.69%) Mule
8 2 (0.27%) NServiceBus
8 2 (0.27%) Umbraco
9 1 (0.14%) Anypoint
9 1 (0.14%) ArcGIS
9 1 (0.14%) Jupyter
9 1 (0.14%) MQSeries
9 1 (0.14%) MS Exchange
9 1 (0.14%) Oracle SOA Suite
9 1 (0.14%) Tomcat
Applications
1 14 (1.92%) Microsoft Excel
2 9 (1.24%) MS Visio
3 6 (0.82%) Microsoft Office
4 2 (0.27%) Microsoft PowerPoint
4 2 (0.27%) Oracle Smart View
5 1 (0.14%) Microsoft Project
5 1 (0.14%) Spreadsheet
Business Applications
1 14 (1.92%) Dynamics CRM
2 8 (1.10%) Dynamics NAV
3 3 (0.41%) Sparx Enterprise Architect
4 2 (0.27%) Elite 3E
4 2 (0.27%) SAP Business One
4 2 (0.27%) SAP FI-GL
4 2 (0.27%) SAP MDG
5 1 (0.14%) Dynamics GP
5 1 (0.14%) HFM
5 1 (0.14%) Hyperion Planning
5 1 (0.14%) Salesforce CRM
Cloud Services
1 273 (37.50%) Azure
2 185 (25.41%) Power Platform
3 137 (18.82%) GCP
4 120 (16.48%) Azure Data Factory
5 115 (15.80%) AWS
6 50 (6.87%) GitHub
7 47 (6.46%) GitHub Actions
7 47 (6.46%) Vertex AI
8 44 (6.04%) Azure Synapse Analytics
9 42 (5.77%) Azure DevOps
10 34 (4.67%) Snowflake
11 30 (4.12%) Amazon S3
12 27 (3.71%) Dynamics 365
12 27 (3.71%) Serverless
13 25 (3.43%) Azure Cosmos DB
14 22 (3.02%) Azure Logic Apps
15 17 (2.34%) Microsoft 365
16 16 (2.20%) SaaS
17 14 (1.92%) PaaS
18 13 (1.79%) Azure Functions
Communications & Networking
1 3 (0.41%) MPLS
1 3 (0.41%) Wireshark
2 2 (0.27%) FTP
3 1 (0.14%) Broadband
3 1 (0.14%) HTTPS
3 1 (0.14%) Network Security
3 1 (0.14%) SD-WAN
3 1 (0.14%) SSH
3 1 (0.14%) VLAN
3 1 (0.14%) WAN
Database & Business Intelligence
1 178 (24.45%) Power BI
2 176 (24.18%) Data Warehouse
3 147 (20.19%) Data Lake
4 109 (14.97%) SQL Server
5 90 (12.36%) Big Data
6 88 (12.09%) Tableau
7 83 (11.40%) NoSQL
8 81 (11.13%) Relational Database
9 70 (9.62%) SQL Server Integration Services
10 65 (8.93%) Azure SQL Database
11 61 (8.38%) PostgreSQL
12 55 (7.55%) MySQL
13 53 (7.28%) BigQuery
14 51 (7.01%) Looker
15 47 (6.46%) Bigtable
16 42 (5.77%) Metadata
17 27 (3.71%) SQL Server Reporting Services
18 26 (3.57%) Amazon Redshift
19 25 (3.43%) Hadoop
20 23 (3.16%) Data Mining
Development Applications
1 61 (8.38%) Jenkins
2 24 (3.30%) Git
3 16 (2.20%) JIRA
4 15 (2.06%) Oracle Forms
5 13 (1.79%) ERwin
6 10 (1.37%) Visual Studio
7 9 (1.24%) SQL Server Management Studio (SSMS)
8 5 (0.69%) ER Studio
9 4 (0.55%) IBM UrbanCode
10 3 (0.41%) SonarQube
10 3 (0.41%) TeamCity
11 2 (0.27%) GitLab
12 1 (0.14%) JUnit
12 1 (0.14%) LSMW
12 1 (0.14%) Maven
12 1 (0.14%) Protractor
12 1 (0.14%) REST Assured
12 1 (0.14%) Selenium
12 1 (0.14%) Serenity BDD
12 1 (0.14%) TestNG
General
1 348 (47.80%) Finance
2 140 (19.23%) Analytical Skills
3 137 (18.82%) Social Skills
4 87 (11.95%) Banking
5 52 (7.14%) Retail
6 49 (6.73%) Inclusion and Diversity
7 28 (3.85%) Public Sector
8 27 (3.71%) Legal
8 27 (3.71%) Marketing
9 20 (2.75%) Influencing Skills
9 20 (2.75%) Presentation Skills
10 15 (2.06%) Law
11 8 (1.10%) Manufacturing
12 5 (0.69%) Social Housing
13 4 (0.55%) Telecoms
14 3 (0.41%) Advertising
14 3 (0.41%) Electronics
14 3 (0.41%) Financial Institution
14 3 (0.41%) Investment Banking
14 3 (0.41%) Police
Job Titles
1 296 (40.66%) Architect
2 172 (23.63%) Enterprise Architect
3 128 (17.58%) Data Engineer
4 90 (12.36%) Data Architect
5 83 (11.40%) Senior
6 69 (9.48%) Developer
7 64 (8.79%) Lead
8 58 (7.97%) Analyst
9 52 (7.14%) Solutions Architect
10 50 (6.87%) Consultant
11 39 (5.36%) Cloud Architect
12 36 (4.95%) Data Consultant
13 35 (4.81%) Data Analyst
14 22 (3.02%) Azure Engineer
15 21 (2.88%) Business Intelligence Developer
15 21 (2.88%) Senior Data Engineer
16 20 (2.75%) Chief Architect
16 20 (2.75%) Chief Data Architect
16 20 (2.75%) Data Analytics Architect
17 19 (2.61%) Azure Architect
Libraries, Frameworks & Software Standards
1 78 (10.71%) Kafka
2 47 (6.46%) .NET
3 32 (4.40%) REST
4 26 (3.57%) CSS
5 24 (3.30%) JSON
6 23 (3.16%) Web Services
7 20 (2.75%) HTML
8 17 (2.34%) PySpark
8 17 (2.34%) XML
9 14 (1.92%) jQuery
9 14 (1.92%) SOAP
10 13 (1.79%) EDI
11 12 (1.65%) .NET Framework
11 12 (1.65%) React
12 11 (1.51%) ASP.NET
12 11 (1.51%) ASP.NET MVC
12 11 (1.51%) Next.js
13 10 (1.37%) Entity Framework
14 9 (1.24%) RESTful
15 8 (1.10%) RabbitMQ
Miscellaneous
1 42 (5.77%) Public Cloud
2 39 (5.36%) Data Structures
3 34 (4.67%) Management Information System
4 17 (2.34%) Enterprise Software
4 17 (2.34%) Reference Data
5 12 (1.65%) Greenfield Project
5 12 (1.65%) Renewable Energy
6 10 (1.37%) Distributed Systems
7 9 (1.24%) Data Centre
7 9 (1.24%) Hybrid Cloud
7 9 (1.24%) Legacy Systems
7 9 (1.24%) Virtual Team
8 8 (1.10%) Algorithms
8 8 (1.10%) Data Fabric
8 8 (1.10%) Team-Oriented Environment
9 7 (0.96%) Distributed Computing
10 6 (0.82%) Self-Motivation
11 5 (0.69%) Onboarding
11 5 (0.69%) Product Ownership
12 4 (0.55%) Housing Association
Operating Systems
1 13 (1.79%) Windows
2 10 (1.37%) Windows Server
3 6 (0.82%) Linux
4 5 (0.69%) Android
5 3 (0.41%) Unix
6 1 (0.14%) Apple iOS
Processes & Methodologies
1 380 (52.20%) Agile
2 250 (34.34%) ETL
3 234 (32.14%) Data Modelling
4 233 (32.01%) Roadmaps
5 223 (30.63%) Business Intelligence
6 208 (28.57%) Analytics
7 189 (25.96%) Enterprise Architecture
8 177 (24.31%) Architectural Design
9 167 (22.94%) Visualisation
10 165 (22.66%) SOA
11 141 (19.37%) Data Pipeline
12 132 (18.13%) Data Management
13 118 (16.21%) Data Visualisation
14 109 (14.97%) Data Governance
15 108 (14.84%) Data Engineering
16 107 (14.70%) Artificial Intelligence
17 104 (14.29%) Machine Learning
17 104 (14.29%) Problem-Solving
18 101 (13.87%) Migration
19 100 (13.74%) Data Architecture
Programming Languages
1 262 (35.99%) SQL
2 122 (16.76%) Python
3 54 (7.42%) C#
4 43 (5.91%) T-SQL
5 33 (4.53%) PowerShell
6 31 (4.26%) Java
7 30 (4.12%) R
8 27 (3.71%) JavaScript
9 21 (2.88%) Data Analysis Expressions
10 12 (1.65%) Scala
11 6 (0.82%) Bicep
12 4 (0.55%) Cypher
12 4 (0.55%) Kusto Query Language
12 4 (0.55%) XAML
13 3 (0.41%) PL/SQL
14 2 (0.27%) C++
14 2 (0.27%) Perl
14 2 (0.27%) TypeScript
14 2 (0.27%) VB.NET
15 1 (0.14%) Rust
Qualifications
1 112 (15.38%) Degree
2 53 (7.28%) Computer Science Degree
3 37 (5.08%) Security Cleared
4 27 (3.71%) SC Cleared
5 26 (3.57%) Master's Degree
6 20 (2.75%) Azure Certification
7 12 (1.65%) Microsoft Certification
8 9 (1.24%) BPSS Clearance
9 6 (0.82%) AWS Certification
10 4 (0.55%) DBS Check
10 4 (0.55%) MCSA
10 4 (0.55%) MCSE
11 3 (0.41%) CCNA
11 3 (0.41%) CCNP
11 3 (0.41%) CISA
11 3 (0.41%) Cisco Certification
11 3 (0.41%) CISM
11 3 (0.41%) CISSP
11 3 (0.41%) HND
12 2 (0.27%) Tableau Certification
Quality Assurance & Compliance
1 122 (16.76%) Data Quality
2 20 (2.75%) QA
3 8 (1.10%) GDPR
4 4 (0.55%) Accessibility
4 4 (0.55%) SLA
5 3 (0.41%) Actionable Recommendations
5 3 (0.41%) ISO/IEC 27001
5 3 (0.41%) NIST
5 3 (0.41%) PMO
6 1 (0.14%) HIPAA
6 1 (0.14%) PCI DSS
System Software
1 9 (1.24%) Docker
2 6 (0.82%) Active Directory
2 6 (0.82%) Virtual Machines
3 1 (0.14%) HDFS
Systems Management
1 57 (7.83%) Terraform
2 8 (1.10%) Kubernetes
3 4 (0.55%) Ansible
4 3 (0.41%) Iperf
5 2 (0.27%) Oracle Identity Management
6 1 (0.14%) Control-M
6 1 (0.14%) Kibana
Vendors
1 166 (22.80%) Microsoft
2 111 (15.25%) Google
3 63 (8.65%) Oracle
4 62 (8.52%) Databricks
5 48 (6.59%) SAP
6 31 (4.26%) Informatica
7 29 (3.98%) Salesforce
8 25 (3.43%) IBM
9 21 (2.88%) MuleSoft
10 19 (2.61%) Talend
11 6 (0.82%) GoldenSource
11 6 (0.82%) Intapp
12 5 (0.69%) TIBCO
13 4 (0.55%) Aderant
13 4 (0.55%) OpenAI
13 4 (0.55%) Sitecore
14 3 (0.41%) Cadence
14 3 (0.41%) Juniper
14 3 (0.41%) SnapLogic
14 3 (0.41%) Sparx