Proactive Management
UK

The following table provides summary statistics for permanent job vacancies with a requirement for Proactive Management skills. Included is a benchmarking guide to the salaries offered in vacancies that have cited Proactive Management over the 6 months to 26 April 2024 with a comparison to the same period in the previous 2 years.

6 months to
26 Apr 2024
Same period 2023 Same period 2022
Rank 750 816 885
Rank change year-on-year +66 +69 -135
Permanent jobs citing Proactive Management 144 177 336
As % of all permanent jobs advertised in the UK 0.15% 0.17% 0.22%
As % of the Processes & Methodologies category 0.17% 0.18% 0.23%
Number of salaries quoted 102 107 177
10th Percentile £26,750 £31,750 £24,750
25th Percentile £33,119 £41,375 £29,750
Median annual salary (50th Percentile) £47,500 £57,500 £55,000
Median % change year-on-year -17.39% +4.55% +33.33%
75th Percentile £62,500 £77,607 £65,000
90th Percentile £77,450 £95,000 £75,000
UK excluding London median annual salary £43,742 £47,500 £51,500
% change year-on-year -7.91% -7.77% +37.33%

All Process and Methodology Skills
UK

Proactive Management is in the Processes and Methodologies category. The following table is for comparison with the above and provides summary statistics for all permanent job vacancies with a requirement for process or methodology skills.

Permanent vacancies with a requirement for process or methodology skills 84,460 100,219 147,325
As % of all permanent jobs advertised in the UK 86.03% 95.64% 95.59%
Number of salaries quoted 59,759 58,822 83,132
10th Percentile £29,000 £34,000 £33,500
25th Percentile £40,000 £45,000 £43,750
Median annual salary (50th Percentile) £55,000 £62,000 £60,000
Median % change year-on-year -11.29% +3.33% +9.09%
75th Percentile £72,500 £82,500 £80,000
90th Percentile £92,500 £100,000 £96,250
UK excluding London median annual salary £50,000 £55,000 £52,500
% change year-on-year -9.09% +4.76% +9.38%

Proactive Management
Job Vacancy Trend

Job postings citing Proactive Management as a proportion of all IT jobs advertised.
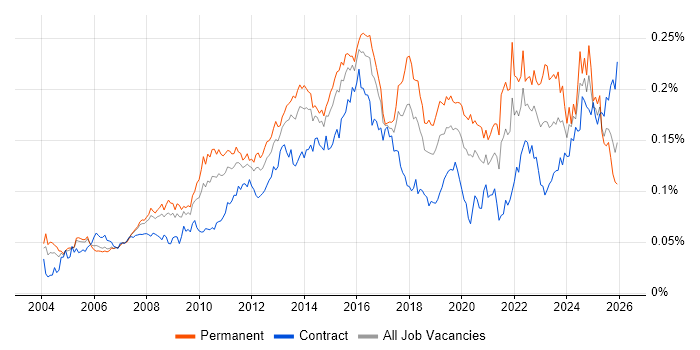
Job vacancy trend for Proactive Management in the UK

Proactive Management
Salary Trend

3-month moving average salary quoted in jobs citing Proactive Management.

Salary trend for Proactive Management in the UK

Proactive Management
Salary Histogram

Salary distribution for jobs citing Proactive Management over the 6 months to 26 April 2024.

Salary histogram for Proactive Management in the UK

Proactive Management
Top 15 Job Locations

The table below looks at the demand and provides a guide to the median salaries quoted in IT jobs citing Proactive Management within the UK over the 6 months to 26 April 2024. The 'Rank Change' column provides an indication of the change in demand within each location based on the same 6 month period last year.

Location Rank Change
on Same Period
Last Year
Matching
Permanent
IT Job Ads
Median Salary
Past 6 Months
Median Salary
% Change
on Same Period
Last Year
Live
Jobs
England +113 142 £47,500 -13.64% 43
UK excluding London -10 104 £43,742 -7.91% 32
Work from Home +45 45 £47,500 -20.20% 10
London +120 38 £75,000 - 14
Midlands +13 34 £40,000 -15.79% 3
South East +31 31 £40,912 -11.06% 9
North of England +46 23 £45,000 -24.40% 9
East Midlands -7 20 £29,000 -47.27% 2
West Midlands +23 14 £60,000 +71.43% 1
North West +10 14 £45,000 -4.09% 5
South West -14 13 £48,750 -0.03% 5
Yorkshire +94 8 £43,742 -33.70% 4
East of England +20 2 - -
Scotland -67 1 - - 5
North East - 1 - -

Proactive Management
Co-occurring Skills and Capabilities by Category

The follow tables expand on the table above by listing co-occurrences grouped by category. The same employment type, locality and period is covered with up to 20 co-occurrences shown in each of the following categories:

Application Platforms
1 10 (6.94%) SAS
2 5 (3.47%) CMS
2 5 (3.47%) Kentico
3 3 (2.08%) IBM Notes
3 3 (2.08%) SharePoint
4 1 (0.69%) Microsoft Exchange
Applications
1 25 (17.36%) Microsoft Office
2 12 (8.33%) Microsoft Excel
3 10 (6.94%) Microsoft PowerPoint
Business Applications
1 3 (2.08%) Primavera
2 2 (1.39%) NetSuite
Cloud Services
1 18 (12.50%) Azure
1 18 (12.50%) Microsoft 365
2 6 (4.17%) AWS
3 5 (3.47%) Basecamp
3 5 (3.47%) Kontent
3 5 (3.47%) Power Platform
4 3 (2.08%) Collibra
4 3 (2.08%) PaaS
5 1 (0.69%) Azure AKS
5 1 (0.69%) Azure Sentinel
5 1 (0.69%) SaaS
Communications & Networking
1 10 (6.94%) Remote Desktop
2 4 (2.78%) DHCP
2 4 (2.78%) DNS
2 4 (2.78%) TCP/IP
3 2 (1.39%) Internet
4 1 (0.69%) Firewall
4 1 (0.69%) LAN
4 1 (0.69%) Network Security
4 1 (0.69%) WAN
4 1 (0.69%) Wi-Fi
Database & Business Intelligence
1 5 (3.47%) Power BI
2 3 (2.08%) Metadata
2 3 (2.08%) SQL Server
3 1 (0.69%) Power Query
Development Applications
1 6 (4.17%) JIRA
2 2 (1.39%) Team Foundation Server
3 1 (0.69%) SonarQube
General
1 87 (60.42%) Social Skills
2 60 (41.67%) Finance
3 23 (15.97%) Analytical Skills
4 17 (11.81%) Organisational Skills
5 16 (11.11%) Banking
6 15 (10.42%) Legal
7 13 (9.03%) Investment Banking
8 12 (8.33%) Inclusion and Diversity
8 12 (8.33%) Influencing Skills
9 10 (6.94%) Billing
10 9 (6.25%) Marketing
11 8 (5.56%) Financial Institution
11 8 (5.56%) Retail
12 4 (2.78%) Pharmaceutical
13 3 (2.08%) French Language
13 3 (2.08%) Local Government
13 3 (2.08%) Manufacturing
13 3 (2.08%) Norwegian Language
14 2 (1.39%) Back Office
14 2 (1.39%) Telecoms
Job Titles
1 38 (26.39%) Analyst
2 17 (11.81%) Infrastructure Manager
3 14 (9.72%) Project Manager
4 13 (9.03%) Senior
5 11 (7.64%) Senior Analyst
6 10 (6.94%) Credit Analyst
6 10 (6.94%) Credit Risk Analyst
6 10 (6.94%) Lead
6 10 (6.94%) Risk Analyst
6 10 (6.94%) Senior Credit Risk Analyst
6 10 (6.94%) Senior Risk Analyst
7 9 (6.25%) IT Manager
8 8 (5.56%) Associate Director
8 8 (5.56%) Environment Manager
8 8 (5.56%) Problem Analyst
8 8 (5.56%) Risk Officer
9 7 (4.86%) Change Analyst
9 7 (4.86%) Incident Analyst
9 7 (4.86%) Incident and Problem Analyst
9 7 (4.86%) IT Engineer
Libraries, Frameworks & Software Standards
1 5 (3.47%) .NET
2 1 (0.69%) SailPoint
Miscellaneous
1 26 (18.06%) Self-Motivation
2 15 (10.42%) Hedge funds
3 10 (6.94%) Credit Risk
4 9 (6.25%) Data Centre
5 7 (4.86%) Management Information System
6 6 (4.17%) Blog
7 5 (3.47%) NHS
7 5 (3.47%) Replication
8 3 (2.08%) Driving Licence
8 3 (2.08%) EPoS
8 3 (2.08%) Mobile App
8 3 (2.08%) Operational Technology
8 3 (2.08%) Product Ownership
9 2 (1.39%) Cyber Threat
9 2 (1.39%) PKI
10 1 (0.69%) Algorithms
10 1 (0.69%) Cyberattack
10 1 (0.69%) Cybercrime
10 1 (0.69%) Onboarding
10 1 (0.69%) Pricing Data
Operating Systems
1 15 (10.42%) Windows
2 4 (2.78%) Windows Server
3 2 (1.39%) Linux
4 1 (0.69%) Android
4 1 (0.69%) Apple iOS
Processes & Methodologies
1 35 (24.31%) Problem Management
2 33 (22.92%) Stakeholder Management
3 29 (20.14%) Customer Service
4 28 (19.44%) Risk Management
5 27 (18.75%) Project Management
5 27 (18.75%) Service Delivery
6 26 (18.06%) Incident Management
7 25 (17.36%) ITIL
8 20 (13.89%) Project Delivery
9 18 (12.50%) ITSM
9 18 (12.50%) Service Management
10 17 (11.81%) Continuous Improvement
10 17 (11.81%) Problem-Solving
11 16 (11.11%) Change Control
11 16 (11.11%) Change Management
12 14 (9.72%) Agile
12 14 (9.72%) Customer Experience
13 12 (8.33%) Business Strategy
13 12 (8.33%) Coaching
13 12 (8.33%) Line Management
Programming Languages
1 16 (11.11%) SQL
2 3 (2.08%) PowerShell
Qualifications
1 28 (19.44%) Degree
2 8 (5.56%) CRISC
3 6 (4.17%) DBS Check
4 5 (3.47%) Security Cleared
5 3 (2.08%) SC Cleared
6 2 (1.39%) DV Cleared
6 2 (1.39%) HNC
6 2 (1.39%) HND
6 2 (1.39%) PRINCE2 Practitioner
7 1 (0.69%) CISA
7 1 (0.69%) CISM
7 1 (0.69%) CISSP
7 1 (0.69%) PMI Certification
7 1 (0.69%) PMP
7 1 (0.69%) PRINCE2 Certification
Quality Assurance & Compliance
1 13 (9.03%) SLA
2 7 (4.86%) Data Quality
3 6 (4.17%) GDPR
4 5 (3.47%) PMO
5 4 (2.78%) PCI DSS
6 3 (2.08%) Accessibility
6 3 (2.08%) Cyber Essentials
7 2 (1.39%) GAAP
7 2 (1.39%) IFRS
7 2 (1.39%) NEBOSH
8 1 (0.69%) COBIT
8 1 (0.69%) HIPAA
8 1 (0.69%) Sarbanes-Oxley
System Software
1 9 (6.25%) Active Directory
2 1 (0.69%) VMware Infrastructure
Systems Management
1 3 (2.08%) Single Sign-On
2 2 (1.39%) Ansible
2 2 (1.39%) Puppet
3 1 (0.69%) Backup Exec
3 1 (0.69%) Kubernetes
3 1 (0.69%) Microsoft Data Protection Manager
3 1 (0.69%) Terraform
Vendors
1 32 (22.22%) Microsoft
2 9 (6.25%) Citrix
2 9 (6.25%) VMware
3 7 (4.86%) ServiceNow
4 5 (3.47%) Veeam
5 4 (2.78%) Datix
5 4 (2.78%) Dell
6 3 (2.08%) BT
6 3 (2.08%) Cisco
6 3 (2.08%) Lotus
7 2 (1.39%) Oracle
8 1 (0.69%) AlienVault
8 1 (0.69%) CheckPoint
8 1 (0.69%) Commvault
8 1 (0.69%) CyberArk
8 1 (0.69%) IBM
8 1 (0.69%) QinetiQ
8 1 (0.69%) Qualys
8 1 (0.69%) Salesforce
8 1 (0.69%) Sonatype