Bash Jobs in England

Bash Shell
UK > England

The following table provides summary statistics for permanent job vacancies advertised in England with a requirement for Bash skills. Included is a benchmarking guide to the salaries offered in vacancies that have cited Bash over the 6 months to 24 April 2024 with a comparison to the same period in the previous 2 years.

6 months to
24 Apr 2024
Same period 2023 Same period 2022
Rank 193 161 175
Rank change year-on-year -32 +14 -4
Permanent jobs citing Bash 1,277 2,194 3,030
As % of all permanent jobs advertised in England 1.51% 2.33% 2.32%
As % of the Programming Languages category 4.63% 5.35% 4.35%
Number of salaries quoted 809 1,300 1,716
10th Percentile £41,700 £42,874 £41,250
25th Percentile £47,500 £52,500 £50,875
Median annual salary (50th Percentile) £60,000 £70,000 £70,000
Median % change year-on-year -14.29% - +16.67%
75th Percentile £80,000 £90,000 £86,250
90th Percentile £92,750 £117,236 £100,000
UK median annual salary £60,000 £70,000 £70,000
% change year-on-year -14.29% - +16.67%

All Programming Languages
England

Bash is in the Programming Languages category. The following table is for comparison with the above and provides summary statistics for all permanent job vacancies advertised in England with a requirement for coding skills.

Permanent vacancies with a requirement for coding skills 27,568 41,005 69,644
As % of all permanent jobs advertised in England 32.53% 43.62% 53.31%
Number of salaries quoted 22,537 26,197 39,731
10th Percentile £35,200 £39,750 £37,500
25th Percentile £45,000 £50,000 £46,250
Median annual salary (50th Percentile) £60,000 £65,000 £62,500
Median % change year-on-year -7.69% +4.00% +8.70%
75th Percentile £80,000 £87,500 £83,750
90th Percentile £100,000 £108,250 £100,000
UK median annual salary £60,000 £65,000 £62,500
% change year-on-year -7.69% +4.00% +13.64%

Bash
Job Vacancy Trend in England

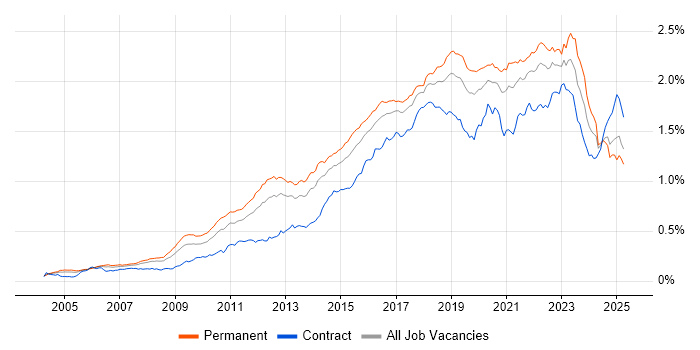
Job postings citing Bash as a proportion of all IT jobs advertised in England.

Job vacancy trend for Bash in England

Bash
Salary Trend in England

3-month moving average salary quoted in jobs citing Bash in England.

Salary trend for Bash in England

Bash
Salary Histogram in England

Salary distribution for jobs citing Bash in England over the 6 months to 24 April 2024.

Salary histogram for Bash in England

Bash
Job Locations in England

The table below looks at the demand and provides a guide to the median salaries quoted in IT jobs citing Bash within the England region over the 6 months to 24 April 2024. The 'Rank Change' column provides an indication of the change in demand within each location based on the same 6 month period last year.

Location Rank Change
on Same Period
Last Year
Matching
Permanent
IT Job Ads
Median Salary
Past 6 Months
Median Salary
% Change
on Same Period
Last Year
Live
Jobs
London -10 504 £73,750 -4.84% 135
South West +13 296 £55,000 -18.52% 33
South East 0 238 £55,000 +10.00% 33
North of England -164 103 £60,000 -1.93% 33
Midlands -1 69 £56,250 -13.46% 20
East of England +16 55 £65,000 +23.81% 22
North West -82 54 £61,391 +11.86% 15
West Midlands +24 38 £60,000 -11.11% 11
Yorkshire -97 37 £53,750 -16.91% 15
East Midlands -15 31 £50,000 +8.11% 9
North East -9 12 £45,000 -37.93% 3
Bash
UK

Bash
Co-occurring Skills and Capabilities in England by Category

The follow tables expand on the table above by listing co-occurrences grouped by category. The same employment type, locality and period is covered with up to 20 co-occurrences shown in each of the following categories:

Application Platforms
1 49 (3.84%) nginx
2 46 (3.60%) Microsoft Exchange
3 38 (2.98%) Apache
4 36 (2.82%) Confluence
5 28 (2.19%) SharePoint
6 19 (1.49%) Jupyter
7 18 (1.41%) Apache Spark
8 13 (1.02%) OpenStack
9 8 (0.63%) CMS
10 6 (0.47%) Oracle Workflow
11 4 (0.31%) WordPress
12 3 (0.23%) Drupal
12 3 (0.23%) JBoss
13 2 (0.16%) IIS
13 2 (0.16%) Tomcat
14 1 (0.078%) Apache Airflow
14 1 (0.078%) WebSphere
Applications
1 11 (0.86%) MS Visio
2 10 (0.78%) Microsoft Office
3 5 (0.39%) Microsoft Excel
4 2 (0.16%) Abaqus
5 1 (0.078%) AutoCAD
5 1 (0.078%) Microsoft Project
5 1 (0.078%) PTC Creo
5 1 (0.078%) SOLIDWORKS
Business Applications
1 16 (1.25%) Fidessa
2 6 (0.47%) NEC Housing
3 4 (0.31%) SAP Business One
4 3 (0.23%) Oracle Cash Management
4 3 (0.23%) Remedy ITSM
Cloud Services
1 562 (44.01%) Azure
2 358 (28.03%) AWS
3 246 (19.26%) Entra ID
4 100 (7.83%) Azure DevOps
5 91 (7.13%) GCP
6 88 (6.89%) GitHub
6 88 (6.89%) Microsoft 365
7 85 (6.66%) OpenShift
8 73 (5.72%) Serverless
9 65 (5.09%) SaaS
10 54 (4.23%) Amazon S3
11 50 (3.92%) AWS CloudFormation
11 50 (3.92%) IaaS
12 38 (2.98%) PaaS
13 37 (2.90%) AWS Lambda
14 35 (2.74%) Azure AKS
14 35 (2.74%) Cloud Computing
15 33 (2.58%) Amazon EC2
16 29 (2.27%) Azure Monitor
17 28 (2.19%) Amazon CloudWatch
Communications & Networking
1 220 (17.23%) Broadband
2 212 (16.60%) 5G
3 183 (14.33%) Firewall
4 130 (10.18%) DNS
5 118 (9.24%) TCP/IP
6 72 (5.64%) DHCP
7 54 (4.23%) WAN
8 52 (4.07%) LAN
9 46 (3.60%) HTTP
10 38 (2.98%) VPN
11 33 (2.58%) Network Security
12 27 (2.11%) Internet
12 27 (2.11%) Wireless
13 25 (1.96%) SAN
14 19 (1.49%) NAS
15 18 (1.41%) PBX
16 17 (1.33%) Cisco ASA
16 17 (1.33%) SNMP
16 17 (1.33%) VSAN
17 16 (1.25%) FIX Connectivity
Database & Business Intelligence
1 82 (6.42%) MySQL
2 78 (6.11%) PostgreSQL
3 72 (5.64%) MongoDB
4 69 (5.40%) SQL Server
5 38 (2.98%) Relational Database
6 32 (2.51%) Amazon RDS
7 25 (1.96%) Elasticsearch
7 25 (1.96%) RDBMS
8 22 (1.72%) Oracle Database
9 21 (1.64%) Big Data
10 20 (1.57%) Hadoop
10 20 (1.57%) MariaDB
11 19 (1.49%) Presto
11 19 (1.49%) Redis
12 18 (1.41%) InfluxDB
13 15 (1.17%) Amazon Aurora
14 9 (0.70%) Azure SQL Database
14 9 (0.70%) Data Mining
15 7 (0.55%) Apache Cassandra
15 7 (0.55%) Ingres
Development Applications
1 202 (15.82%) Git
2 200 (15.66%) Jenkins
3 72 (5.64%) GitLab
4 67 (5.25%) JIRA
5 28 (2.19%) TeamCity
6 24 (1.88%) Bitbucket
7 21 (1.64%) JDeveloper
7 21 (1.64%) Subversion
8 19 (1.49%) Atlassian Bamboo
9 17 (1.33%) Octopus Deploy
9 17 (1.33%) Team Foundation Server
9 17 (1.33%) Visual Studio
10 14 (1.10%) SonarQube
11 10 (0.78%) GNU Toolchain
11 10 (0.78%) Robot Framework
12 8 (0.63%) CMake
12 8 (0.63%) Sonatype Nexus
13 7 (0.55%) Eclipse
13 7 (0.55%) Selenium
13 7 (0.55%) TestRail
General
1 333 (26.08%) Analytical Skills
2 253 (19.81%) Inclusion and Diversity
3 231 (18.09%) Social Skills
4 196 (15.35%) Finance
5 68 (5.32%) Banking
6 47 (3.68%) Public Sector
7 46 (3.60%) Aerospace
8 29 (2.27%) Manufacturing
9 27 (2.11%) Marketing
10 25 (1.96%) Retail
11 24 (1.88%) Investment Banking
11 24 (1.88%) Telecoms
12 22 (1.72%) Organisational Skills
13 21 (1.64%) Electronics
14 17 (1.33%) Games
15 14 (1.10%) Documentation Skills
16 13 (1.02%) Law
17 8 (0.63%) Presentation Skills
18 7 (0.55%) Tech for Good
19 5 (0.39%) Aviation
Job Titles
1 352 (27.56%) Senior
2 213 (16.68%) Linux Specialist
3 212 (16.60%) Technical Specialist
4 188 (14.72%) DevOps Engineer
5 150 (11.75%) Software Engineer
6 134 (10.49%) Infrastructure Engineer
7 129 (10.10%) Senior Data Warehouse Specialist
7 129 (10.10%) Senior Linux Specialist
8 127 (9.95%) Senior Technical Specialist
8 127 (9.95%) Senior Unix Technical Specialist
9 107 (8.38%) Linux Engineer
10 81 (6.34%) Administrator
11 66 (5.17%) AWS Engineer
12 65 (5.09%) Cloud Engineer
13 63 (4.93%) Systems Engineer
14 60 (4.70%) Embedded Engineer
14 60 (4.70%) Senior Infrastructure Engineer
15 59 (4.62%) Embedded Software Engineer
16 57 (4.46%) Platform Engineer
17 53 (4.15%) Azure Engineer
Libraries, Frameworks & Software Standards
1 58 (4.54%) Elastic Stack
2 56 (4.39%) React
3 49 (3.84%) Node.js
4 37 (2.90%) HTML
4 37 (2.90%) YAML
5 35 (2.74%) ARM Templates
6 26 (2.04%) .NET
7 22 (1.72%) RabbitMQ
8 19 (1.49%) Apache NiFi
9 18 (1.41%) ActiveMQ
10 17 (1.33%) FIX Protocol
10 17 (1.33%) REST
11 16 (1.25%) Middleware
12 13 (1.02%) Fluent Bit
12 13 (1.02%) XML
13 12 (0.94%) CSS
13 12 (0.94%) EDI
13 12 (0.94%) LDAP
13 12 (0.94%) Qt
14 11 (0.86%) HTML5
Miscellaneous
1 210 (16.44%) Social Media
2 71 (5.56%) Linux Command Line
3 43 (3.37%) Public Cloud
4 36 (2.82%) Hybrid Cloud
4 36 (2.82%) Management Information System
4 36 (2.82%) Self-Motivation
5 33 (2.58%) Data Centre
5 33 (2.58%) IoT
6 30 (2.35%) PKI
7 29 (2.27%) Clustering
8 26 (2.04%) Onboarding
9 20 (1.57%) Algorithms
9 20 (1.57%) Cloud Native
10 16 (1.25%) Embedded Systems
10 16 (1.25%) Eurex
10 16 (1.25%) Virtual Team
11 14 (1.10%) Cyber Defence
11 14 (1.10%) Replication
12 13 (1.02%) CUDA
12 13 (1.02%) Mobile App
Operating Systems
1 875 (68.52%) Linux
2 391 (30.62%) Windows
3 271 (21.22%) Ubuntu
4 134 (10.49%) Red Hat Enterprise Linux
5 104 (8.14%) CentOS
6 95 (7.44%) Windows Server
7 89 (6.97%) Unix
8 59 (4.62%) Embedded Linux
9 49 (3.84%) Windows Server 2016
10 48 (3.76%) Debian
11 47 (3.68%) Windows Server 2019
12 46 (3.60%) Mac OS
13 39 (3.05%) Windows Server 2012
14 25 (1.96%) Solaris
15 20 (1.57%) Windows 10
16 19 (1.49%) CoreOS
17 13 (1.02%) SUSE
18 11 (0.86%) Oracle Linux
19 9 (0.70%) Mac OS X
19 9 (0.70%) VMS
Processes & Methodologies
1 477 (37.35%) DevOps
2 398 (31.17%) Cybersecurity
3 294 (23.02%) CI/CD
4 272 (21.30%) Problem-Solving
5 263 (20.60%) Artificial Intelligence
6 228 (17.85%) Infrastructure as Code
7 221 (17.31%) IT Strategy
8 218 (17.07%) CRM
8 218 (17.07%) Technology Strategy
9 201 (15.74%) Software Engineering
10 193 (15.11%) Containerisation
11 156 (12.22%) Agile
12 146 (11.43%) Infrastructure Engineering
13 129 (10.10%) Configuration Management
14 107 (8.38%) Actionable Insight
15 104 (8.14%) Continuous Integration
16 91 (7.13%) Mentoring
17 85 (6.66%) ITIL
17 85 (6.66%) Task Automation
18 81 (6.34%) Open Source
Programming Languages
1 839 (65.70%) Python
2 495 (38.76%) PowerShell
3 155 (12.14%) SQL
4 132 (10.34%) Java
5 131 (10.26%) Perl
6 129 (10.10%) C
7 100 (7.83%) JavaScript
8 98 (7.67%) Ruby
9 72 (5.64%) C++
10 71 (5.56%) Go
11 63 (4.93%) C#
12 57 (4.46%) Rust
13 53 (4.15%) Embedded C
14 51 (3.99%) Shell Script
15 38 (2.98%) Bicep
16 29 (2.27%) PHP
17 20 (1.57%) Fortran
18 19 (1.49%) Korn
19 18 (1.41%) TypeScript
20 13 (1.02%) Groovy
Qualifications
1 290 (22.71%) Security Cleared
2 171 (13.39%) Degree
3 121 (9.48%) DV Cleared
4 90 (7.05%) SC Cleared
5 48 (3.76%) Computer Science Degree
6 45 (3.52%) Cisco Certification
7 38 (2.98%) CCNA
8 25 (1.96%) AWS Certification
9 20 (1.57%) PhD
10 19 (1.49%) CISSP
11 18 (1.41%) Master's Degree
12 16 (1.25%) Azure Certification
13 14 (1.10%) Microsoft Certification
14 13 (1.02%) AWS Certified Solutions Architect
15 11 (0.86%) AWS Certified DevOps Engineer
16 10 (0.78%) GIAC
16 10 (0.78%) OSCP
17 8 (0.63%) CEH
17 8 (0.63%) CompTIA Security+
18 7 (0.55%) MCSE
Quality Assurance & Compliance
1 46 (3.60%) ISO/IEC 27001
2 25 (1.96%) Data Quality
3 23 (1.80%) QA
4 22 (1.72%) SLA
5 20 (1.57%) Cyber Essentials
6 16 (1.25%) PMO
7 11 (0.86%) SOC 2
8 10 (0.78%) PCI DSS
9 8 (0.63%) NIST
10 7 (0.55%) GDPR
10 7 (0.55%) NCSC
11 4 (0.31%) Accessibility
11 4 (0.31%) HIPAA
11 4 (0.31%) ISO 9000
11 4 (0.31%) ISO/IEC 27002 (supersedes ISO/IEC 17799)
12 1 (0.078%) Actionable Recommendations
12 1 (0.078%) Cyber Essentials PLUS
12 1 (0.078%) MISRA
System Software
1 360 (28.19%) Active Directory
2 273 (21.38%) Docker
3 141 (11.04%) VMware Infrastructure
4 64 (5.01%) Hyper-V
5 53 (4.15%) Virtual Machines
6 33 (2.58%) VMware ESXi
7 25 (1.96%) vSphere
8 10 (0.78%) Firmware
9 9 (0.70%) NFS
10 7 (0.55%) Virtual Desktop
11 6 (0.47%) Virtual Servers
11 6 (0.47%) VMware Server
12 5 (0.39%) Citrix Hypervisor
13 4 (0.31%) Embedded Firmware
13 4 (0.31%) VMware NSX
14 3 (0.23%) Slurm Workload Manager
14 3 (0.23%) VirtualBox
15 2 (0.16%) Ceph
15 2 (0.16%) Lustre
15 2 (0.16%) PowerHA
Systems Management
1 300 (23.49%) Kubernetes
2 291 (22.79%) Ansible
3 262 (20.52%) Terraform
4 235 (18.40%) Microsoft Intune
5 220 (17.23%) Jamf Pro
6 176 (13.78%) Puppet
7 91 (7.13%) Grafana
8 70 (5.48%) Prometheus
9 58 (4.54%) Progress Chef
10 32 (2.51%) vCenter Server
11 29 (2.27%) HAProxy
12 24 (1.88%) Single Sign-On
13 19 (1.49%) Nagios
14 18 (1.41%) Red Hat Satellite
15 14 (1.10%) Istio
15 14 (1.10%) logstash
16 13 (1.02%) Fluentd
17 12 (0.94%) Graphite
18 11 (0.86%) SCCM
19 9 (0.70%) Salt
Vendors
1 435 (34.06%) Microsoft
2 216 (16.91%) CyberArk
3 210 (16.44%) Tanium
4 200 (15.66%) Red Hat
5 194 (15.19%) VMware
6 117 (9.16%) Oracle
7 78 (6.11%) Cisco
8 33 (2.58%) Google
8 33 (2.58%) Palo Alto
9 32 (2.51%) Atlassian
10 31 (2.43%) Splunk
11 19 (1.49%) New Relic
12 17 (1.33%) Apple
12 17 (1.33%) Bloomberg
12 17 (1.33%) TOWER Software
13 16 (1.25%) CQG
13 16 (1.25%) ION Trading
13 16 (1.25%) Patsystems
13 16 (1.25%) Reuters
13 16 (1.25%) Sun