Time Management Jobs in England

Time Management
UK > England

The table below provides summary statistics for permanent job vacancies advertised in England requiring Time Management skills. It includes a benchmarking guide to the annual salaries offered in vacancies that cited Time Management over the 6 months leading up to 18 May 2025, comparing them to the same period in the previous two years.

6 months to
18 May 2025
Same period 2024 Same period 2023
Rank 168 122 182
Rank change year-on-year -46 +60 +14
Permanent jobs citing Time Management 965 1,986 1,792
As % of all permanent jobs advertised in England 1.95% 2.30% 2.03%
As % of the Processes & Methodologies category 2.07% 2.70% 2.12%
Number of salaries quoted 475 1,232 868
10th Percentile £25,800 £23,500 £23,425
25th Percentile £30,625 £27,500 £32,000
Median annual salary (50th Percentile) £47,500 £40,000 £50,000
Median % change year-on-year +18.75% -20.00% +5.26%
75th Percentile £59,500 £55,000 £67,500
90th Percentile £75,600 £72,500 £83,250
UK median annual salary £45,000 £40,000 £50,000
% change year-on-year +12.50% -20.00% +5.26%

All Process and Methodology Skills
England

Time Management falls under the Processes and Methodologies category. For comparison with the information above, the following table provides summary statistics for all permanent job vacancies requiring process or methodology skills in England.

Permanent vacancies with a requirement for process or methodology skills 46,644 73,553 84,428
As % of all permanent jobs advertised in England 94.10% 85.14% 95.62%
Number of salaries quoted 23,839 53,945 50,143
10th Percentile £30,000 £29,000 £34,324
25th Percentile £42,000 £40,000 £46,000
Median annual salary (50th Percentile) £57,500 £55,000 £62,500
Median % change year-on-year +4.55% -12.00% +4.17%
75th Percentile £75,000 £73,250 £82,500
90th Percentile £98,474 £93,750 £102,500
UK median annual salary £57,500 £55,000 £61,000
% change year-on-year +4.55% -9.84% +1.67%

Time Management
Job Vacancy Trend in England

Job postings citing Time Management as a proportion of all IT jobs advertised in England.
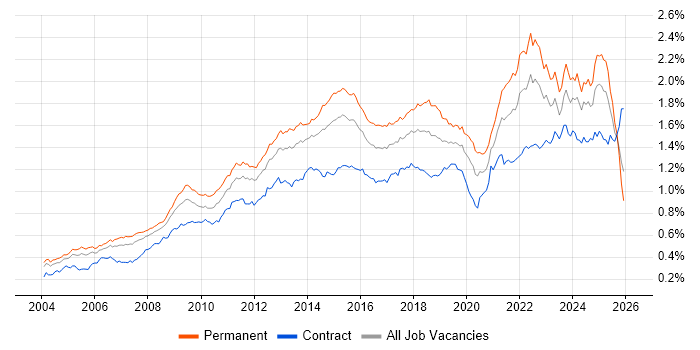
Job vacancy trend for Time Management in England

Time Management
Salary Trend in England

3-month moving average salary quoted in jobs citing Time Management in England.

Salary trend for Time Management in England

Time Management
Salary Histogram in England

Salary distribution for jobs citing Time Management in England over the 6 months to 18 May 2025.

Salary histogram for Time Management in England

Time Management
Job Locations in England

The table below looks at the demand and provides a guide to the median salaries quoted in IT jobs citing Time Management within the England region over the 6 months to 18 May 2025. The 'Rank Change' column provides an indication of the change in demand within each location based on the same 6 month period last year.

Location Rank Change
on Same Period
Last Year
Matching
Permanent
IT Job Ads
Median Salary
Past 6 Months
Median Salary
% Change
on Same Period
Last Year
Live
Jobs
London +14 307 £57,500 +13.86% 650
North of England -57 197 £34,448 -8.14% 214
South East -14 195 £49,134 +22.84% 296
North West -62 148 £36,250 +11.54% 125
East of England -13 103 £54,250 +80.83% 87
Midlands -72 91 £45,000 +38.46% 139
South West -30 67 £34,500 -18.82% 101
East Midlands +1 53 £42,500 +30.77% 45
Yorkshire -18 44 £33,500 -21.18% 66
West Midlands -89 38 £55,000 +69.23% 84
North East +18 5 - - 23
Time Management
UK

Time Management
Co-occurring Skills and Capabilities in England by Category

The follow tables expand on the table above by listing co-occurrences grouped by category. The same employment type, locality and period is covered with up to 20 co-occurrences shown in each of the following categories:

Application Platforms
1 32 (3.32%) SharePoint
2 31 (3.21%) Microsoft Exchange
3 15 (1.55%) IBM Domino
4 14 (1.45%) CMS
5 10 (1.04%) Confluence
6 9 (0.93%) WordPress
7 4 (0.41%) Apache Spark
8 3 (0.31%) OpenEdge
9 2 (0.21%) Drupal
10 1 (0.10%) IIS
10 1 (0.10%) Oracle Workflow
10 1 (0.10%) Sitefinity
Applications
1 149 (15.44%) Microsoft Office
2 135 (13.99%) Microsoft Excel
3 33 (3.42%) Microsoft PowerPoint
4 18 (1.87%) Photoshop
5 13 (1.35%) Adobe After Effects
5 13 (1.35%) Adobe Premiere
6 11 (1.14%) MS Visio
7 9 (0.93%) CapCut
8 5 (0.52%) Adobe Illustrator
8 5 (0.52%) Trello
9 4 (0.41%) Adobe Creative Suite
9 4 (0.41%) Microsoft Project
10 3 (0.31%) AutoCAD
10 3 (0.31%) Final Cut Pro
10 3 (0.31%) Spreadsheet
11 2 (0.21%) Adobe XD
11 2 (0.21%) InDesign
11 2 (0.21%) Revit
11 2 (0.21%) SOLIDWORKS
12 1 (0.10%) Zeplin
Business Applications
1 23 (2.38%) SAP S/4HANA
2 16 (1.66%) Shopify
3 15 (1.55%) SAP HCM
3 15 (1.55%) SAP Payroll
4 14 (1.45%) Dynamics NAV
5 13 (1.35%) SAP HR
6 12 (1.24%) Dynamics AX
7 10 (1.04%) Raiser’s Edge
8 5 (0.52%) Elite 3E
8 5 (0.52%) Exchequer
9 4 (0.41%) Carpe Diem
10 2 (0.21%) Dynamics CRM
10 2 (0.21%) SAP ERP
11 1 (0.10%) NetSuite
11 1 (0.10%) Oracle Financials
11 1 (0.10%) Oracle iProcurement
11 1 (0.10%) Primavera
11 1 (0.10%) SAP Business One
11 1 (0.10%) SAP MDM
11 1 (0.10%) SAP MM
Cloud Services
1 105 (10.88%) Power Platform
2 88 (9.12%) Microsoft 365
3 85 (8.81%) Azure
4 35 (3.63%) AWS
5 28 (2.90%) Entra ID
6 25 (2.59%) SaaS
7 24 (2.49%) Google Analytics
8 21 (2.18%) Azure Logic Apps
9 19 (1.97%) Dynamics 365
10 17 (1.76%) Azure Sentinel
10 17 (1.76%) Google Drive
11 16 (1.66%) Google Ads
12 15 (1.55%) Dropbox
13 14 (1.45%) Canva
13 14 (1.45%) SuccessFactors
14 13 (1.35%) Azure Data Factory
14 13 (1.35%) Google Tag Manager
15 12 (1.24%) Serverless
16 11 (1.14%) AWS Lambda
16 11 (1.14%) OneDrive
Communications & Networking
1 49 (5.08%) Firewall
2 32 (3.32%) DNS
3 28 (2.90%) DHCP
4 27 (2.80%) VLAN
5 25 (2.59%) VoIP
6 21 (2.18%) LAN
6 21 (2.18%) SAN
6 21 (2.18%) TCP/IP
7 19 (1.97%) Wi-Fi
8 17 (1.76%) WAN
9 13 (1.35%) Wireless
10 11 (1.14%) MPLS
10 11 (1.14%) VPN
11 10 (1.04%) Network Security
12 6 (0.62%) Cisco IOS
13 4 (0.41%) HTTP
13 4 (0.41%) HTTPS
13 4 (0.41%) NAS
13 4 (0.41%) WebEx
14 3 (0.31%) Unified Communications
Database & Business Intelligence
1 100 (10.36%) Power BI
2 49 (5.08%) Big Data
3 14 (1.45%) SQL Server
4 11 (1.14%) Tableau
5 10 (1.04%) Metadata
6 7 (0.73%) Azure SQL Database
6 7 (0.73%) Data Warehouse
6 7 (0.73%) Relational Database
7 6 (0.62%) Data Mining
8 5 (0.52%) MySQL
9 4 (0.41%) PostgreSQL
10 3 (0.31%) Amazon RDS
10 3 (0.31%) GIS
10 3 (0.31%) NoSQL
10 3 (0.31%) SQL Server Integration Services
11 2 (0.21%) Elasticsearch
11 2 (0.21%) Looker
11 2 (0.21%) Pentaho
11 2 (0.21%) SAP HANA
11 2 (0.21%) SQL Server Reporting Services
Development Applications
1 30 (3.11%) JIRA
2 24 (2.49%) Git
3 5 (0.52%) Jenkins
3 5 (0.52%) Postman
3 5 (0.52%) SpecFlow
4 4 (0.41%) Jasmine
4 4 (0.41%) Karma Test Runner
4 4 (0.41%) Selenium
4 4 (0.41%) SoapUI
5 3 (0.31%) Eclipse
6 2 (0.21%) GitLab
7 1 (0.10%) Ant
7 1 (0.10%) Artifactory
7 1 (0.10%) Bitbucket
7 1 (0.10%) Carbide.c++
7 1 (0.10%) gulp
7 1 (0.10%) Oracle Forms
7 1 (0.10%) SonarQube
7 1 (0.10%) Visual Studio Code
7 1 (0.10%) webpack
General
1 652 (67.56%) Social Skills
2 241 (24.97%) Organisational Skills
3 212 (21.97%) Analytical Skills
4 196 (20.31%) Finance
5 135 (13.99%) Marketing
6 94 (9.74%) Inclusion and Diversity
7 81 (8.39%) Presentation Skills
8 71 (7.36%) Advertising
9 54 (5.60%) Legal
10 52 (5.39%) Banking
11 49 (5.08%) Retail
12 38 (3.94%) Manufacturing
13 37 (3.83%) Public Sector
14 25 (2.59%) Law
15 24 (2.49%) Telecoms
16 21 (2.18%) Influencing Skills
17 20 (2.07%) Documentation Skills
18 18 (1.87%) Pharmaceutical
19 16 (1.66%) Publishing
20 13 (1.35%) General Ledger
Job Titles
1 176 (18.24%) Analyst
2 167 (17.31%) Senior
3 67 (6.94%) Senior Manager
4 57 (5.91%) Account Manager
5 54 (5.60%) Support Analyst
6 53 (5.49%) Consultant
7 52 (5.39%) Digital Analyst
8 49 (5.08%) Business Manager
8 49 (5.08%) Senior Account Manager
9 43 (4.46%) Business Development Manager
9 43 (4.46%) Development Manager
10 39 (4.04%) Coordinator
11 36 (3.73%) Administrator
12 35 (3.63%) IT Support
13 34 (3.52%) Developer
14 31 (3.21%) IT Analyst
15 30 (3.11%) Account Executive
15 30 (3.11%) Auditor
15 30 (3.11%) Graduate
15 30 (3.11%) Junior
Libraries, Frameworks & Software Standards
1 23 (2.38%) HTML
2 17 (1.76%) CSS
3 15 (1.55%) .NET
4 14 (1.45%) SAP Fiori
5 12 (1.24%) RESTful
6 11 (1.14%) AngularJS
6 11 (1.14%) XML
7 9 (0.93%) REST
8 7 (0.73%) HTML5
8 7 (0.73%) React
9 6 (0.62%) Sass
10 5 (0.52%) .NET Core
10 5 (0.52%) ASP.NET
10 5 (0.52%) EDI
10 5 (0.52%) Elastic Stack
10 5 (0.52%) JSON
10 5 (0.52%) SailPoint
10 5 (0.52%) SOAP
10 5 (0.52%) Web Services
11 4 (0.41%) Laravel
Miscellaneous
1 78 (8.08%) Self-Motivation
2 56 (5.80%) Management Information System
3 55 (5.70%) Digital Media
4 54 (5.60%) Social Media
5 50 (5.18%) Driving Licence
6 49 (5.08%) Marketing Technology
7 34 (3.52%) CCTV
8 27 (2.80%) Onboarding
9 20 (2.07%) Video Conferencing
10 17 (1.76%) Video Editing
11 15 (1.55%) Algorithms
11 15 (1.55%) Product Ownership
12 14 (1.45%) EPoS
12 14 (1.45%) Graphic Design
13 13 (1.35%) Team-Oriented Environment
14 10 (1.04%) Blog
15 7 (0.73%) Data Centre
15 7 (0.73%) Security Posture
15 7 (0.73%) Social Network
16 6 (0.62%) Renewable Energy
Operating Systems
1 128 (13.26%) Windows
2 55 (5.70%) Windows Server
3 28 (2.90%) Windows 10
4 26 (2.69%) Linux
5 19 (1.97%) Android
6 15 (1.55%) Windows Vista
7 13 (1.35%) Windows Server 2019
8 12 (1.24%) Windows Server 2016
9 11 (1.14%) Apple iOS
10 8 (0.83%) Mac OS
10 8 (0.83%) Mac OS X
11 5 (0.52%) AIX
12 4 (0.41%) Unix
12 4 (0.41%) Windows 7
12 4 (0.41%) Windows Server 2012
13 2 (0.21%) Red Hat Enterprise Linux
14 1 (0.10%) CentOS
14 1 (0.10%) CoreOS
14 1 (0.10%) VMS
14 1 (0.10%) Windows Server 2008
Processes & Methodologies
1 292 (30.26%) Problem-Solving
2 169 (17.51%) Customer Service
3 157 (16.27%) Agile
4 144 (14.92%) Project Management
5 138 (14.30%) Analytics
6 121 (12.54%) Artificial Intelligence
7 111 (11.50%) Continuous Improvement
8 103 (10.67%) Business Intelligence
9 98 (10.16%) Collaborative Working
10 95 (9.84%) Project Delivery
11 89 (9.22%) Business Development
12 85 (8.81%) Data Analytics
13 81 (8.39%) Strategic Thinking
14 79 (8.19%) Digital Marketing
15 75 (7.77%) Process Improvement
16 73 (7.56%) CRM
17 71 (7.36%) Service Delivery
18 70 (7.25%) Mentoring
19 68 (7.05%) Marketing Strategy
20 64 (6.63%) Decision-Making
Programming Languages
1 77 (7.98%) SQL
2 62 (6.42%) Python
3 25 (2.59%) JavaScript
4 21 (2.18%) Java
4 21 (2.18%) PowerShell
5 17 (1.76%) C#
6 15 (1.55%) ABAP
7 13 (1.35%) Kusto Query Language
8 11 (1.14%) C++
9 8 (0.83%) Bash
9 8 (0.83%) C
9 8 (0.83%) Delphi
10 7 (0.73%) PHP
11 6 (0.62%) PL/SQL
11 6 (0.62%) T-SQL
11 6 (0.62%) TypeScript
12 5 (0.52%) VBA
13 4 (0.41%) Kotlin
13 4 (0.41%) Objective-C
14 3 (0.31%) R
Qualifications
1 228 (23.63%) Degree
2 44 (4.56%) DBS Check
3 33 (3.42%) Master's Degree
4 25 (2.59%) ACCA
4 25 (2.59%) CIMA
5 22 (2.28%) MRICS
6 21 (2.18%) Security Cleared
7 19 (1.97%) CCAB
7 19 (1.97%) CIPFA
7 19 (1.97%) ICAEW
8 14 (1.45%) ITIL Foundation Certificate
9 13 (1.35%) Computer Science Degree
10 12 (1.24%) Cisco Certification
11 11 (1.14%) Microsoft Certification
11 11 (1.14%) SC Cleared
12 10 (1.04%) DV Cleared
13 9 (0.93%) CISSP
13 9 (0.93%) ISTQB
14 7 (0.73%) CCNA
15 6 (0.62%) CCSP
Quality Assurance & Compliance
1 44 (4.56%) GDPR
2 38 (3.94%) SLA
3 37 (3.83%) QA
4 16 (1.66%) PMO
5 11 (1.14%) Accessibility
5 11 (1.14%) ISO/IEC 27001
6 10 (1.04%) Data Quality
7 9 (0.93%) NIST
8 7 (0.73%) Cyber Essentials
9 5 (0.52%) ISO 22301
10 3 (0.31%) GMP
10 3 (0.31%) Government Security Classifications
10 3 (0.31%) GxP
11 2 (0.21%) ISO 9001
11 2 (0.21%) ISO/IEC 27002 (supersedes ISO/IEC 17799)
11 2 (0.21%) PCI DSS
11 2 (0.21%) Sarbanes-Oxley
11 2 (0.21%) SOC 2
12 1 (0.10%) Cyber Essentials PLUS
12 1 (0.10%) GRC
System Software
1 72 (7.46%) Active Directory
2 38 (3.94%) VMware Infrastructure
3 24 (2.49%) Docker
4 17 (1.76%) VMware ESXi
5 13 (1.35%) Hyper-V
5 13 (1.35%) Virtual Desktop
6 4 (0.41%) Firmware
6 4 (0.41%) VMware NSX
7 2 (0.21%) vSphere
8 1 (0.10%) Citrix Hypervisor
8 1 (0.10%) Forefront TMG
8 1 (0.10%) ISA Server
8 1 (0.10%) KVM
8 1 (0.10%) VirtualBox
Systems Management
1 19 (1.97%) SCCM
2 18 (1.87%) Microsoft Intune
3 7 (0.73%) Progress Chef
4 6 (0.62%) Ansible
4 6 (0.62%) PaperCut
4 6 (0.62%) Puppet
4 6 (0.62%) vCenter Server
5 5 (0.52%) AirWatch
5 5 (0.52%) EMC NetWorker
6 4 (0.41%) Kubernetes
6 4 (0.41%) VxRail
7 3 (0.31%) Avamar
7 3 (0.31%) Grafana
8 2 (0.21%) Kibana
8 2 (0.21%) logstash
8 2 (0.21%) MIIS
8 2 (0.21%) Single Sign-On
8 2 (0.21%) Terraform
9 1 (0.10%) NetBackup
9 1 (0.10%) Systems Management Server (SMS)
Vendors
1 274 (28.39%) Microsoft
2 60 (6.22%) Google
3 57 (5.91%) Alteryx
4 45 (4.66%) SAP
5 39 (4.04%) VMware
6 29 (3.01%) Salesforce
6 29 (3.01%) Sun
7 27 (2.80%) YouTube
8 26 (2.69%) Adobe
9 25 (2.59%) Cisco
10 23 (2.38%) Facebook
11 20 (2.07%) ServiceNow
12 16 (1.66%) TikTok
13 15 (1.55%) Instagram
13 15 (1.55%) Veeam
14 13 (1.35%) Citrix
15 12 (1.24%) Apple
16 11 (1.14%) Pinterest
17 9 (0.93%) Dell
17 9 (0.93%) Riverbed