Task Automation
UK

The following table provides summary statistics for permanent job vacancies with a requirement for Task Automation skills. Included is a benchmarking guide to the salaries offered in vacancies that have cited Task Automation over the 6 months to 28 November 2023 with a comparison to the same period in the previous 2 years.

6 months to
28 Nov 2023
Same period 2022 Same period 2021
Rank 357 500 518
Rank change year-on-year +143 +18 -157
Permanent jobs citing Task Automation 434 781 705
As % of all permanent jobs advertised in the UK 0.80% 0.62% 0.55%
As % of the Processes & Methodologies category 0.85% 0.65% 0.58%
Number of salaries quoted 311 460 374
10th Percentile £41,750 £40,000 £36,975
25th Percentile £46,007 £46,250 £45,000
Median annual salary (50th Percentile) £60,000 £60,000 £55,000
Median % change year-on-year - +9.09% -8.33%
75th Percentile £73,000 £82,813 £75,000
90th Percentile £85,000 £95,000 £90,000
UK excluding London median annual salary £51,750 £52,500 £47,750
% change year-on-year -1.43% +9.95% -16.96%

All Process and Methodology Skills
UK

Task Automation is in the Processes and Methodologies category. The following table is for comparison with the above and provides summary statistics for all permanent job vacancies with a requirement for process or methodology skills.

Permanent vacancies with a requirement for process or methodology skills 51,121 120,104 122,523
As % of all permanent jobs advertised in the UK 94.09% 95.72% 95.43%
Number of salaries quoted 36,956 73,203 81,032
10th Percentile £32,500 £34,313 £32,500
25th Percentile £43,750 £45,000 £42,500
Median annual salary (50th Percentile) £60,000 £60,000 £59,000
Median % change year-on-year - +1.69% +7.27%
75th Percentile £80,000 £81,250 £77,500
90th Percentile £98,750 £100,000 £95,000
UK excluding London median annual salary £52,500 £53,000 £50,000
% change year-on-year -0.94% +6.00% +4.17%

Task Automation
Job Vacancy Trend

Job postings citing Task Automation as a proportion of all IT jobs advertised.
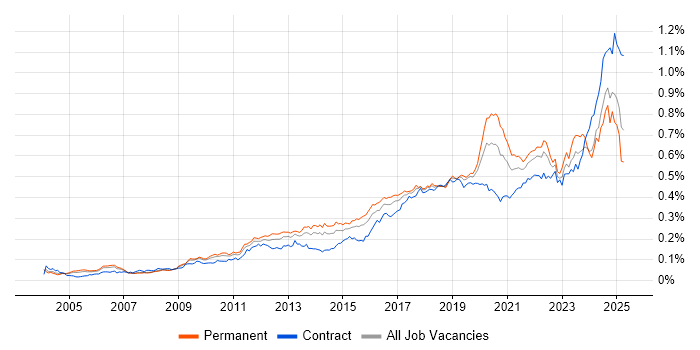
Job vacancy trend for Task Automation in the UK

Task Automation
Salary Trend

3-month moving average salary quoted in jobs citing Task Automation.

Salary trend for Task Automation in the UK

Task Automation
Salary Histogram

Salary distribution for jobs citing Task Automation over the 6 months to 28 November 2023.

Salary histogram for Task Automation in the UK

Task Automation
Top 16 Job Locations

The table below looks at the demand and provides a guide to the median salaries quoted in IT jobs citing Task Automation within the UK over the 6 months to 28 November 2023. The 'Rank Change' column provides an indication of the change in demand within each location based on the same 6 month period last year.

Location Rank Change
on Same Period
Last Year
Matching
Permanent
IT Job Ads
Median Salary
Past 6 Months
Median Salary
% Change
on Same Period
Last Year
Live
Jobs
England +144 399 £60,000 - 163
UK excluding London +136 250 £51,750 -1.43% 90
London +122 162 £70,000 -6.67% 88
Work from Home +66 148 £62,500 +8.70% 64
South East +159 78 £50,000 +11.11% 38
North of England +127 54 £52,500 +2.44% 13
South West +24 52 £56,000 +1.82% 12
North West +116 28 £51,250 +13.89% 10
Midlands +86 28 £44,388 -11.22% 8
Yorkshire +93 26 £55,000 -8.33% 3
West Midlands +84 21 £44,388 -2.44% 8
East of England +94 16 £44,150 +0.91% 9
Scotland +51 16 £69,000 +38.00% 11
East Midlands +39 7 £41,234 -36.56%
Northern Ireland +36 4 £60,000 -14.29%
Wales +3 2 - - 1

Task Automation
Co-occurring Skills and Capabilities by Category

The follow tables expand on the table above by listing co-occurrences grouped by category. The same employment type, locality and period is covered with up to 20 co-occurrences shown in each of the following categories:

Application Platforms
1 26 (5.99%) SharePoint
2 14 (3.23%) Confluence
3 13 (3.00%) Apache
3 13 (3.00%) IIS
3 13 (3.00%) MS Exchange
4 9 (2.07%) WebSphere
5 2 (0.46%) ColdFusion
5 2 (0.46%) Drupal
5 2 (0.46%) JBoss
5 2 (0.46%) nginx
6 1 (0.23%) ArcGIS
6 1 (0.23%) Camunda
6 1 (0.23%) OpenStack
6 1 (0.23%) Oracle Workflow
6 1 (0.23%) Red Hat Fuse
6 1 (0.23%) SAS
Applications
1 13 (3.00%) Microsoft Office
2 11 (2.53%) Microsoft Excel
3 8 (1.84%) AutoCAD
3 8 (1.84%) PTC Creo
3 8 (1.84%) SOLIDWORKS
4 7 (1.61%) Microsoft PowerPoint
Business Applications
1 3 (0.69%) Dynamics CRM
2 1 (0.23%) iTrent
Cloud Services
1 166 (38.25%) Azure
2 129 (29.72%) AWS
3 66 (15.21%) Microsoft 365
4 36 (8.29%) Azure DevOps
5 32 (7.37%) IaaS
6 28 (6.45%) Serverless
7 24 (5.53%) Entra ID
7 24 (5.53%) Power Platform
8 23 (5.30%) GCP
9 20 (4.61%) AWS Lambda
9 20 (4.61%) GitHub
9 20 (4.61%) OpenShift
10 18 (4.15%) Power Automate
11 16 (3.69%) SaaS
12 15 (3.46%) Dynamics 365
13 14 (3.23%) Cloud Computing
14 12 (2.76%) PaaS
15 11 (2.53%) Amazon EC2
15 11 (2.53%) AWS CloudFormation
16 8 (1.84%) PowerApps
Communications & Networking
1 58 (13.36%) DNS
2 47 (10.83%) Firewall
3 45 (10.37%) VPN
4 43 (9.91%) DHCP
5 39 (8.99%) IPv4
6 30 (6.91%) VLAN
7 28 (6.45%) TCP/IP
8 21 (4.84%) OSPF
9 14 (3.23%) SMTP
10 13 (3.00%) VoIP
11 12 (2.76%) PBX
12 11 (2.53%) Network Security
13 8 (1.84%) SAN
14 7 (1.61%) Internet
14 7 (1.61%) Wireless
15 6 (1.38%) NAS
15 6 (1.38%) Wi-Fi
16 5 (1.15%) Intrusion Detection
16 5 (1.15%) Reverse Proxy
16 5 (1.15%) WAN
Database & Business Intelligence
1 56 (12.90%) SQL Server
2 20 (4.61%) Power BI
3 17 (3.92%) PostgreSQL
4 15 (3.46%) MySQL
5 14 (3.23%) Amazon RDS
6 10 (2.30%) Data Lake
7 9 (2.07%) SAP HANA
8 8 (1.84%) Apache Accumulo
9 7 (1.61%) Big Data
9 7 (1.61%) Data Warehouse
10 6 (1.38%) Elasticsearch
10 6 (1.38%) Relational Database
11 4 (0.92%) Data Mining
12 3 (0.69%) Metadata
12 3 (0.69%) Microsoft Analysis Services
12 3 (0.69%) SQL Server Analysis Services
12 3 (0.69%) SQL Server Integration Services
13 2 (0.46%) Amazon Redshift
13 2 (0.46%) BigQuery
13 2 (0.46%) Looker
Development Applications
1 65 (14.98%) Jenkins
2 27 (6.22%) JIRA
3 22 (5.07%) Git
4 21 (4.84%) Selenium
5 18 (4.15%) Bitbucket
6 16 (3.69%) GitLab
7 9 (2.07%) Chocolatey
8 7 (1.61%) Cucumber
8 7 (1.61%) JMeter
8 7 (1.61%) REST Assured
8 7 (1.61%) TeamCity
8 7 (1.61%) Travis CI
9 6 (1.38%) Appium
9 6 (1.38%) Bitbucket Server
9 6 (1.38%) Cypress.io
9 6 (1.38%) Oracle APEX
9 6 (1.38%) Serenity BDD
9 6 (1.38%) SoapUI
10 4 (0.92%) Maven
11 3 (0.69%) Atlassian Bamboo
General
1 120 (27.65%) Social Skills
2 105 (24.19%) Finance
3 66 (15.21%) Analytical Skills
4 26 (5.99%) Aerospace
5 23 (5.30%) Presentation Skills
6 20 (4.61%) Public Sector
7 18 (4.15%) Inclusion and Diversity
8 16 (3.69%) Retail
9 11 (2.53%) Banking
10 9 (2.07%) Manufacturing
11 8 (1.84%) Front Office
11 8 (1.84%) Law
12 7 (1.61%) Aviation
13 6 (1.38%) Automotive
14 5 (1.15%) Telecoms
15 3 (0.69%) Legal
16 2 (0.46%) French Language
16 2 (0.46%) Games
16 2 (0.46%) Investment Banking
16 2 (0.46%) Mandarin Language
Job Titles
1 80 (18.43%) Senior
2 67 (15.44%) Infrastructure Engineer
3 66 (15.21%) DevOps Engineer
4 34 (7.83%) Lead
5 33 (7.60%) Senior Infrastructure Engineer
6 31 (7.14%) Analyst
7 26 (5.99%) Administrator
8 25 (5.76%) Support Engineer
9 24 (5.53%) Consultant
10 23 (5.30%) Asset Management Consultant
10 23 (5.30%) Configuration Management Consultant
10 23 (5.30%) Management Consultant
10 23 (5.30%) Software Consultant
11 21 (4.84%) Automation Engineer
12 19 (4.38%) Cloud Engineer
12 19 (4.38%) Systems Administrator
13 16 (3.69%) Azure Engineer
14 15 (3.46%) Support Analyst
15 14 (3.23%) Developer
15 14 (3.23%) Senior Systems Administrator
Libraries, Frameworks & Software Standards
1 19 (4.38%) .NET
2 17 (3.92%) Elastic Stack
3 16 (3.69%) REST
4 13 (3.00%) YAML
5 12 (2.76%) Web Services
6 11 (2.53%) XML
7 10 (2.30%) RESTful
8 9 (2.07%) SOAP
9 7 (1.61%) Middleware
10 6 (1.38%) JAX-RS
11 5 (1.15%) .NET Core
11 5 (1.15%) ARM Templates
11 5 (1.15%) Kafka
11 5 (1.15%) Node.js
12 4 (0.92%) FIX Protocol
13 3 (0.69%) ADO
13 3 (0.69%) CSS
13 3 (0.69%) HTML
13 3 (0.69%) LAMP
13 3 (0.69%) Velocity
Miscellaneous
1 45 (10.37%) Public Cloud
2 38 (8.76%) Product Ownership
3 33 (7.60%) Onboarding
4 23 (5.30%) Management Information System
5 15 (3.46%) Enterprise Software
5 15 (3.46%) Virtual Team
6 14 (3.23%) Operational Technology
6 14 (3.23%) Self-Motivation
7 12 (2.76%) Hybrid Cloud
8 9 (2.07%) Cloud Native
8 9 (2.07%) Cyber Threat
8 9 (2.07%) Replication
9 8 (1.84%) Mobile App
10 6 (1.38%) Distributed Systems
10 6 (1.38%) Linux Command Line
11 5 (1.15%) Data Centre
11 5 (1.15%) Mainframe
12 4 (0.92%) CMDB
12 4 (0.92%) IoT
12 4 (0.92%) NHS
Operating Systems
1 146 (33.64%) Windows
2 118 (27.19%) Linux
3 59 (13.59%) Windows Server
4 21 (4.84%) Unix
5 13 (3.00%) Mac OS
6 12 (2.76%) Windows 10
7 11 (2.53%) Windows Server 2012
8 9 (2.07%) Red Hat Enterprise Linux
9 6 (1.38%) VMS
10 5 (1.15%) CentOS
11 4 (0.92%) Data ONTAP
11 4 (0.92%) Windows Server 2016
12 3 (0.69%) Ubuntu
12 3 (0.69%) Windows Server 2019
13 1 (0.23%) Android
13 1 (0.23%) Debian
13 1 (0.23%) Fedora
13 1 (0.23%) Rocky
13 1 (0.23%) Windows Server 2008
Processes & Methodologies
1 139 (32.03%) DevOps
2 129 (29.72%) Agile
3 106 (24.42%) CI/CD
4 94 (21.66%) Infrastructure as Code
5 91 (20.97%) Problem-Solving
6 87 (20.05%) Configuration Management
7 82 (18.89%) ITIL
8 76 (17.51%) Infrastructure Engineering
9 63 (14.52%) Containerisation
10 56 (12.90%) Computer Science
11 53 (12.21%) Project Management
12 44 (10.14%) DevSecOps
13 41 (9.45%) Collaborative Working
14 40 (9.22%) Continuous Integration
15 38 (8.76%) Service Management
16 37 (8.53%) Disaster Recovery
17 36 (8.29%) Test Automation
18 35 (8.06%) SDLC
19 34 (7.83%) Artificial Intelligence
19 34 (7.83%) Roadmaps
Programming Languages
1 190 (43.78%) PowerShell
2 139 (32.03%) Bash
3 136 (31.34%) Python
4 56 (12.90%) SQL
5 33 (7.60%) Java
6 21 (4.84%) C#
6 21 (4.84%) Perl
7 20 (4.61%) JavaScript
8 11 (2.53%) Ruby
9 9 (2.07%) TypeScript
10 8 (1.84%) MATLAB
11 7 (1.61%) T-SQL
12 6 (1.38%) Go
12 6 (1.38%) VBA
13 4 (0.92%) Bicep
13 4 (0.92%) C
13 4 (0.92%) Shell Script
14 3 (0.69%) Kotlin
14 3 (0.69%) PHP
15 2 (0.46%) Kusto Query Language
Qualifications
1 94 (21.66%) Degree
2 55 (12.67%) Security Cleared
3 35 (8.06%) Computer Science Degree
4 29 (6.68%) SC Cleared
5 25 (5.76%) AWS Certification
6 22 (5.07%) HNC
7 20 (4.61%) Cisco Certification
8 18 (4.15%) CCNA
9 17 (3.92%) Microsoft Certification
10 14 (3.23%) CompTIA Security+
10 14 (3.23%) MCSA
11 12 (2.76%) Azure Certification
11 12 (2.76%) MCSE
11 12 (2.76%) RHCE
12 11 (2.53%) GIAC
13 9 (2.07%) CISSP
14 7 (1.61%) AWS Certified Solutions Architect
15 6 (1.38%) DV Cleared
16 5 (1.15%) BPSS Clearance
16 5 (1.15%) Six Sigma Black Belt
Quality Assurance & Compliance
1 22 (5.07%) QA
2 10 (2.30%) SLA
3 8 (1.84%) ISO/IEC 27001
4 7 (1.61%) NIST
5 6 (1.38%) PCI DSS
6 5 (1.15%) Data Quality
7 4 (0.92%) Accessibility
8 3 (0.69%) Cyber Essentials
8 3 (0.69%) PMO
9 1 (0.23%) CDISC
9 1 (0.23%) Good Clinical Practice
9 1 (0.23%) HAZOP
9 1 (0.23%) IEC 61508
System Software
1 79 (18.20%) Active Directory
2 74 (17.05%) Docker
3 66 (15.21%) VMware Infrastructure
4 24 (5.53%) Hyper-V
5 12 (2.76%) Virtual Machines
6 11 (2.53%) VMware ESXi
7 7 (1.61%) Firmware
7 7 (1.61%) KVM
7 7 (1.61%) XenDesktop
8 6 (1.38%) IAG
8 6 (1.38%) XenApp
9 4 (0.92%) vSphere
10 3 (0.69%) NFS
11 2 (0.46%) VMware NSX
12 1 (0.23%) Ceph
12 1 (0.23%) Gluster
12 1 (0.23%) Samba
12 1 (0.23%) Virtual Desktop
12 1 (0.23%) Virtual Servers
Systems Management
1 101 (23.27%) Ansible
2 76 (17.51%) Terraform
3 69 (15.90%) Kubernetes
4 68 (15.67%) Puppet
5 37 (8.53%) SCCM
6 34 (7.83%) Microsoft Intune
7 18 (4.15%) Grafana
8 16 (3.69%) SCOM
9 11 (2.53%) Active Directory Federation Services
9 11 (2.53%) Progress Chef
10 10 (2.30%) Prometheus
11 6 (1.38%) Nagios
12 5 (1.15%) Check_MK
13 4 (0.92%) NetBackup
13 4 (0.92%) SCSM
13 4 (0.92%) Single Sign-On
14 3 (0.69%) N-central
14 3 (0.69%) Salt
15 2 (0.46%) HAProxy
15 2 (0.46%) Kibana
Vendors
1 107 (24.65%) Microsoft
2 90 (20.74%) VMware
3 34 (7.83%) Oracle
4 29 (6.68%) ServiceNow
5 27 (6.22%) Red Hat
6 23 (5.30%) Remedy
7 21 (4.84%) Cisco
8 19 (4.38%) SolarWinds
9 18 (4.15%) Citrix
10 13 (3.00%) Meraki
10 13 (3.00%) Palo Alto
11 12 (2.76%) SAP
12 11 (2.53%) Atlassian
13 10 (2.30%) IBM
14 9 (2.07%) NetApp
14 9 (2.07%) TOWER Software
15 8 (1.84%) HP
15 8 (1.84%) MathWorks
15 8 (1.84%) McAfee
15 8 (1.84%) PTC