Test Strategy
UK

The following table provides summary statistics for permanent job vacancies with a requirement for Test Strategy skills. Included is a benchmarking guide to the salaries offered in vacancies that have cited Test Strategy over the 6 months to 28 November 2023 with a comparison to the same period in the previous 2 years.

6 months to
28 Nov 2023
Same period 2022 Same period 2021
Rank 354 239 351
Rank change year-on-year -115 +112 +2
Permanent jobs citing Test Strategy 441 1,975 1,274
As % of all permanent jobs advertised in the UK 0.81% 1.57% 0.99%
As % of the Processes & Methodologies category 0.86% 1.64% 1.04%
Number of salaries quoted 332 925 862
10th Percentile £42,500 £41,550 £36,250
25th Percentile £51,250 £48,750 £47,500
Median annual salary (50th Percentile) £70,000 £60,000 £60,000
Median % change year-on-year +16.67% - -
75th Percentile £102,500 £80,000 £80,000
90th Percentile £110,000 £97,500 £93,750
UK excluding London median annual salary £53,750 £55,000 £52,000
% change year-on-year -2.27% +5.77% +4.00%

All Process and Methodology Skills
UK

Test Strategy is in the Processes and Methodologies category. The following table is for comparison with the above and provides summary statistics for all permanent job vacancies with a requirement for process or methodology skills.

Permanent vacancies with a requirement for process or methodology skills 51,121 120,104 122,523
As % of all permanent jobs advertised in the UK 94.09% 95.72% 95.43%
Number of salaries quoted 36,956 73,203 81,032
10th Percentile £32,500 £34,313 £32,500
25th Percentile £43,750 £45,000 £42,500
Median annual salary (50th Percentile) £60,000 £60,000 £59,000
Median % change year-on-year - +1.69% +7.27%
75th Percentile £80,000 £81,250 £77,500
90th Percentile £98,750 £100,000 £95,000
UK excluding London median annual salary £52,500 £53,000 £50,000
% change year-on-year -0.94% +6.00% +4.17%

Test Strategy
Job Vacancy Trend

Job postings citing Test Strategy as a proportion of all IT jobs advertised.
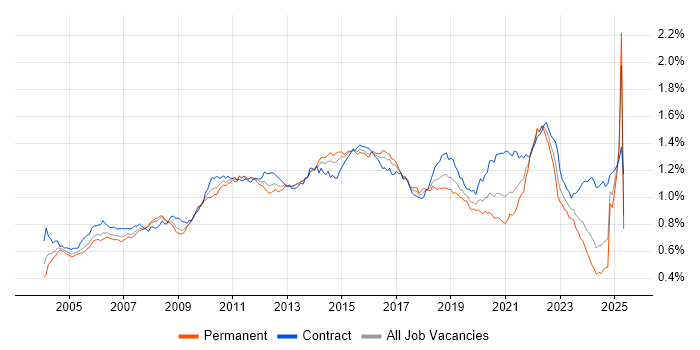
Job vacancy trend for Test Strategy in the UK

Test Strategy
Salary Trend

3-month moving average salary quoted in jobs citing Test Strategy.

Salary trend for Test Strategy in the UK

Test Strategy
Salary Histogram

Salary distribution for jobs citing Test Strategy over the 6 months to 28 November 2023.

Salary histogram for Test Strategy in the UK

Test Strategy
Top 16 Job Locations

The table below looks at the demand and provides a guide to the median salaries quoted in IT jobs citing Test Strategy within the UK over the 6 months to 28 November 2023. The 'Rank Change' column provides an indication of the change in demand within each location based on the same 6 month period last year.

Location Rank Change
on Same Period
Last Year
Matching
Permanent
IT Job Ads
Median Salary
Past 6 Months
Median Salary
% Change
on Same Period
Last Year
Live
Jobs
England -88 410 £75,000 +25.00% 168
London +29 241 £90,000 +18.03% 83
Work from Home -42 211 £80,000 +33.33% 75
UK excluding London -183 180 £53,750 -2.27% 102
North of England -75 39 £60,000 +17.65% 24
South East -19 38 £58,500 +1.74% 34
South West -24 37 £61,250 +11.36% 7
Midlands -34 33 £39,000 -25.71% 18
West Midlands -9 22 £39,500 -24.76% 14
Yorkshire -9 21 £58,750 +23.68% 9
East of England +39 17 £65,000 +18.18% 13
North West -6 16 £81,250 +47.73% 13
Scotland -13 15 £44,033 -11.94% 2
East Midlands -8 10 £34,875 -36.59% 4
Wales -24 3 £50,000 -9.09% 5
North East +7 1 - - 2

Test Strategy
Co-occurring Skills and Capabilities by Category

The follow tables expand on the table above by listing co-occurrences grouped by category. The same employment type, locality and period is covered with up to 20 co-occurrences shown in each of the following categories:

Application Platforms
1 13 (2.95%) Confluence
2 5 (1.13%) WebSphere
2 5 (1.13%) WebSphere Application Server
3 3 (0.68%) CMS
3 3 (0.68%) IIS
4 1 (0.23%) Apache
4 1 (0.23%) JBoss
4 1 (0.23%) nginx
4 1 (0.23%) Oracle SOA Suite
4 1 (0.23%) Tomcat
4 1 (0.23%) Tornado
Applications
1 2 (0.45%) Microsoft Excel
1 2 (0.45%) Microsoft Office
1 2 (0.45%) Sketch
1 2 (0.45%) UXPin
1 2 (0.45%) Zeplin
2 1 (0.23%) Microsoft PowerPoint
2 1 (0.23%) MS Visio
2 1 (0.23%) Simulink
Business Applications
1 7 (1.59%) SAP S/4HANA
2 2 (0.45%) Dynamics CRM
2 2 (0.45%) Endur
2 2 (0.45%) Oracle Financials
3 1 (0.23%) MoSes
3 1 (0.23%) SAP MM
Cloud Services
1 66 (14.97%) SaaS
2 63 (14.29%) Azure
3 43 (9.75%) AWS
4 35 (7.94%) Azure DevOps
5 16 (3.63%) GCP
6 13 (2.95%) GitHub
7 10 (2.27%) Serverless
8 8 (1.81%) Azure Data Factory
9 7 (1.59%) IaaS
9 7 (1.59%) Snowflake
10 6 (1.36%) AWS Lambda
11 5 (1.13%) Entra ID
11 5 (1.13%) GitHub Actions
12 4 (0.91%) AWS CloudFormation
12 4 (0.91%) Salesforce Commerce Cloud
12 4 (0.91%) Salesforce Service Cloud
13 3 (0.68%) Amazon EC2
13 3 (0.68%) Dynamics 365
13 3 (0.68%) OpenShift
13 3 (0.68%) PaaS
Communications & Networking
1 14 (3.17%) DHCP
1 14 (3.17%) DNS
2 13 (2.95%) HTTP
3 10 (2.27%) TCP/IP
4 8 (1.81%) SSL
5 6 (1.36%) PuTTY
5 6 (1.36%) WinSCP
6 4 (0.91%) 3GPP
6 4 (0.91%) 5G
7 3 (0.68%) Kerberos
8 2 (0.45%) FTP
8 2 (0.45%) ICMP
8 2 (0.45%) Internet
8 2 (0.45%) LAN
8 2 (0.45%) MPLS
8 2 (0.45%) SMTP
8 2 (0.45%) TETRA
8 2 (0.45%) VoIP
8 2 (0.45%) Wi-Fi
8 2 (0.45%) WLAN
Database & Business Intelligence
1 24 (5.44%) SQL Server
2 13 (2.95%) SQL Server Integration Services
3 10 (2.27%) Data Warehouse
3 10 (2.27%) NoSQL
3 10 (2.27%) Relational Database
4 9 (2.04%) PostgreSQL
4 9 (2.04%) RDBMS
5 8 (1.81%) Elasticsearch
6 7 (1.59%) MongoDB
7 6 (1.36%) MySQL
8 5 (1.13%) Hadoop
9 4 (0.91%) Amazon RDS
10 3 (0.68%) OLTP
10 3 (0.68%) SQL Server Analysis Services
10 3 (0.68%) SQL Server Reporting Services
11 2 (0.45%) Data Lake
11 2 (0.45%) Enterprise Data Warehouse
11 2 (0.45%) SAP BW
11 2 (0.45%) Tableau
12 1 (0.23%) Azure SQL Data Warehouse
Development Applications
1 125 (28.34%) Selenium
2 100 (22.68%) Jenkins
3 90 (20.41%) Postman
4 87 (19.73%) Cucumber
5 50 (11.34%) JIRA
6 40 (9.07%) Cypress.io
7 38 (8.62%) JMeter
8 28 (6.35%) Git
9 21 (4.76%) JUnit
9 21 (4.76%) SoapUI
10 19 (4.31%) SpecFlow
11 14 (3.17%) Atlassian Bamboo
11 14 (3.17%) Team Foundation Server
12 13 (2.95%) WebDriver
13 12 (2.72%) Visual Studio
14 11 (2.49%) LoadRunner
15 10 (2.27%) TestNG
15 10 (2.27%) TestRail
16 8 (1.81%) SQL Server Management Studio (SSMS)
16 8 (1.81%) TestLink
General
1 91 (20.63%) Social Skills
2 75 (17.01%) Finance
3 54 (12.24%) Analytical Skills
4 33 (7.48%) Retail
5 32 (7.26%) Banking
6 26 (5.90%) Inclusion and Diversity
7 20 (4.54%) Financial Institution
8 13 (2.95%) Marketing
8 13 (2.95%) Public Sector
9 12 (2.72%) Private Banking
10 10 (2.27%) Automotive
10 10 (2.27%) Influencing Skills
11 9 (2.04%) Manufacturing
11 9 (2.04%) Tech for Good
12 7 (1.59%) Games
13 6 (1.36%) Aerospace
13 6 (1.36%) Telecoms
14 5 (1.13%) Advertising
14 5 (1.13%) Electronics
14 5 (1.13%) Legal
Job Titles
1 112 (25.40%) Senior
2 110 (24.94%) Lead
3 42 (9.52%) Analyst
3 42 (9.52%) Test Engineer
4 36 (8.16%) Tester
5 32 (7.26%) Test Manager
6 30 (6.80%) QA Engineer
6 30 (6.80%) Test Leader
7 28 (6.35%) Developer
8 24 (5.44%) Test Automation Engineer
9 21 (4.76%) Software Engineer
10 19 (4.31%) Business Analyst
11 17 (3.85%) Lead Software Engineer
12 15 (3.40%) Engineering Manager
13 14 (3.17%) Administrator
13 14 (3.17%) Senior Systems Administrator
13 14 (3.17%) Systems Administrator
14 13 (2.95%) Full Stack Developer
14 13 (2.95%) QA Tester
15 12 (2.72%) Senior Test Engineer
Libraries, Frameworks & Software Standards
1 93 (21.09%) REST
2 41 (9.30%) React
3 37 (8.39%) .NET
4 22 (4.99%) Node.js
4 22 (4.99%) Playwright
5 20 (4.54%) JSON
6 18 (4.08%) HTML
6 18 (4.08%) Kafka
6 18 (4.08%) RESTful
6 18 (4.08%) Web Services
6 18 (4.08%) WebdriverIO
7 13 (2.95%) AngularJS
7 13 (2.95%) Spring Boot
8 12 (2.72%) CSS
9 10 (2.27%) .NET Framework
9 10 (2.27%) Swagger
10 9 (2.04%) .NET Core
10 9 (2.04%) ADO
10 9 (2.04%) HTML5
11 8 (1.81%) Entity Framework
Miscellaneous
1 30 (6.80%) Product Ownership
2 20 (4.54%) Greenfield Project
3 14 (3.17%) Virtual Team
4 8 (1.81%) Algorithms
4 8 (1.81%) Management Information System
4 8 (1.81%) Mobile App
4 8 (1.81%) PKI
4 8 (1.81%) Self-Motivation
5 6 (1.36%) Enterprise Software
5 6 (1.36%) Public Cloud
6 4 (0.91%) Cloud Native
6 4 (0.91%) Distributed Applications
6 4 (0.91%) Tandem
7 3 (0.68%) Distributed Systems
7 3 (0.68%) FMCG
7 3 (0.68%) Hedge funds
7 3 (0.68%) Low-Code
7 3 (0.68%) Onboarding
8 2 (0.45%) Blockchain
8 2 (0.45%) Data Structures
Operating Systems
1 36 (8.16%) Windows
2 27 (6.12%) Linux
3 11 (2.49%) Unix
4 7 (1.59%) Android
5 6 (1.36%) Apple iOS
6 2 (0.45%) Ubuntu
6 2 (0.45%) Windows Server
7 1 (0.23%) Debian
Processes & Methodologies
1 217 (49.21%) Test Automation
2 200 (45.35%) Agile
3 146 (33.11%) CI/CD
4 110 (24.94%) Software Testing
5 104 (23.58%) DevOps
6 101 (22.90%) API Testing
7 94 (21.32%) BDD
8 89 (20.18%) SDET
9 66 (14.97%) Problem-Solving
10 63 (14.29%) Clean Code
11 53 (12.02%) Scrum
12 51 (11.56%) Mentoring
13 49 (11.11%) TDD
13 49 (11.11%) Test Scripting
14 47 (10.66%) Regression Testing
15 46 (10.43%) Software Engineering
16 41 (9.30%) Performance Testing
17 40 (9.07%) User Acceptance Testing
18 38 (8.62%) Continuous Improvement
19 36 (8.16%) Test Planning
Programming Languages
1 116 (26.30%) Java
2 79 (17.91%) Python
3 72 (16.33%) SQL
4 70 (15.87%) JavaScript
5 51 (11.56%) C#
6 23 (5.22%) TypeScript
7 18 (4.08%) PowerShell
7 18 (4.08%) T-SQL
8 11 (2.49%) C++
9 10 (2.27%) Bash
10 7 (1.59%) Ruby
11 6 (1.36%) PHP
12 4 (0.91%) Shell Script
13 3 (0.68%) Go
14 2 (0.45%) C
14 2 (0.45%) COBOL
14 2 (0.45%) Groovy
14 2 (0.45%) HLASM
14 2 (0.45%) REXX
14 2 (0.45%) VBA
Qualifications
1 43 (9.75%) Degree
2 41 (9.30%) ISTQB
3 24 (5.44%) Security Cleared
4 16 (3.63%) SC Cleared
5 14 (3.17%) CompTIA Security+
6 12 (2.72%) ISEB
7 8 (1.81%) Computer Science Degree
8 7 (1.59%) ISTQB Foundation Certification
9 4 (0.91%) BPSS Clearance
9 4 (0.91%) ISTQB Advanced Certification
9 4 (0.91%) ITIL Certification
10 3 (0.68%) CISM
10 3 (0.68%) CISSP
10 3 (0.68%) DV Cleared
10 3 (0.68%) HNC
10 3 (0.68%) HND
10 3 (0.68%) Master's Degree
11 2 (0.45%) AWS Certification
11 2 (0.45%) AWS Certified DevOps Engineer
11 2 (0.45%) Six Sigma Black Belt
Quality Assurance & Compliance
1 200 (45.35%) QA
2 19 (4.31%) Accessibility
3 9 (2.04%) Data Quality
4 6 (1.36%) NIST
5 4 (0.91%) NCSC
6 3 (0.68%) Def Stans
6 3 (0.68%) ISO 9001
6 3 (0.68%) Software Quality Assurance
7 2 (0.45%) COBIT
7 2 (0.45%) ISO 26262
7 2 (0.45%) ISO/IEC 15288
7 2 (0.45%) PMO
7 2 (0.45%) SLA
7 2 (0.45%) WCAG
8 1 (0.23%) Actionable Recommendations
8 1 (0.23%) GDPR
8 1 (0.23%) HIPAA
8 1 (0.23%) ISO 9000
8 1 (0.23%) Sarbanes-Oxley
System Software
1 29 (6.58%) Docker
2 17 (3.85%) VMware Infrastructure
3 16 (3.63%) Active Directory
4 2 (0.45%) Firmware
4 2 (0.45%) VMware ESXi
5 1 (0.23%) Embedded Firmware
5 1 (0.23%) Hyper-V
Systems Management
1 28 (6.35%) Kubernetes
2 19 (4.31%) Terraform
3 14 (3.17%) SCCM
4 12 (2.72%) Ansible
5 4 (0.91%) HP Quality Center
6 2 (0.45%) Grafana
6 2 (0.45%) vCenter Server
7 1 (0.23%) Backup Exec
7 1 (0.23%) Consul
7 1 (0.23%) Fortio
7 1 (0.23%) HP ALM
7 1 (0.23%) Istio
7 1 (0.23%) Kiali
7 1 (0.23%) Microsoft Data Protection Manager
7 1 (0.23%) Packer
7 1 (0.23%) Progress Chef
7 1 (0.23%) Puppet
Vendors
1 29 (6.58%) Microsoft
2 17 (3.85%) Salesforce
2 17 (3.85%) VMware
3 16 (3.63%) SAP
4 15 (3.40%) Google
5 14 (3.17%) SolarWinds
6 10 (2.27%) HP
7 9 (2.04%) Oracle
8 6 (1.36%) Dynatrace
8 6 (1.36%) Splunk
9 4 (0.91%) Salesforce Marketing Cloud
9 4 (0.91%) ServiceNow
9 4 (0.91%) UiPath
10 3 (0.68%) Atlassian
10 3 (0.68%) OpenAI
11 2 (0.45%) Ariba
11 2 (0.45%) Aruba
11 2 (0.45%) F5
11 2 (0.45%) Infoblox
11 2 (0.45%) Wrike