DevOps Engineer Jobs with Hybrid/Remote/WFH Options

Development Operations Engineer
UK > Work from Home

The median Development Operations Engineer salary for remote or hybrid work is £87,500 per year, according to job vacancies posted during the 6 months leading to 1 May 2025.

The table below provides salary benchmarking and summary statistics, comparing them to the same period in the previous two years.

6 months to
1 May 2025
Same period 2024 Same period 2023
Rank 175 210 103
Rank change year-on-year +35 -107 +5
Permanent jobs requiring a DevOps Engineer 263 519 1,321
As % of all permanent jobs with a WFH option 1.76% 1.53% 3.09%
As % of the Job Titles category 1.94% 1.60% 3.22%
Number of salaries quoted 232 404 1,068
10th Percentile £56,375 £49,125 £52,500
25th Percentile £70,097 £55,000 £61,232
Median annual salary (50th Percentile) £87,500 £70,000 £75,000
Median % change year-on-year +25.00% -6.67% +3.45%
75th Percentile £115,000 £83,750 £91,250
90th Percentile £138,750 £98,181 £102,500
UK median annual salary £82,500 £70,576 £75,000
% change year-on-year +16.90% -5.90% +3.45%

All Permanent IT Job Vacancies
Work from Home

For comparison with the information above, the following table provides summary statistics for all permanent IT job vacancies with WFH or hybrid options. Most job vacancies include a discernible job title that can be normalized. As such, the figures in the second row provide an indication of the number of permanent jobs in our overall sample.

Permanent vacancies in Work from Home with a recognized job title 13,554 32,482 41,080
% of permanent jobs with a recognized job title 90.64% 95.99% 96.08%
Number of salaries quoted 9,860 24,960 29,208
10th Percentile £30,000 £33,000 £36,500
25th Percentile £43,750 £42,500 £47,250
Median annual salary (50th Percentile) £60,000 £56,000 £62,500
Median % change year-on-year +7.14% -10.40% +4.17%
75th Percentile £77,500 £75,000 £81,250
90th Percentile £100,000 £92,500 £100,000
UK median annual salary £57,500 £52,777 £60,000
% change year-on-year +8.95% -12.04% -

DevOps Engineer
Trend for Jobs with a WFH Option

Job vacancies with remote working options which featured DevOps Engineer in the job title as a proportion of all IT jobs advertised.
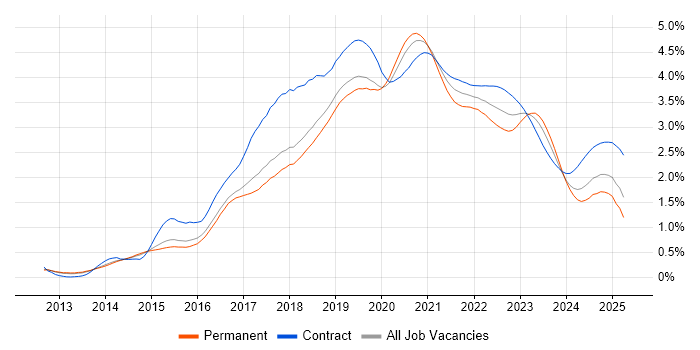
DevOps Engineer trend for jobs with Hybrid/Remote/WFH options

DevOps Engineer
Salary Trend for Jobs with a WFH Option

3-month moving average salary quoted in job vacancies with remote working options citing DevOps Engineer.

DevOps Engineer salary trend for jobs with a WFH option

DevOps Engineer
Salary Histogram for Jobs with a WFH Option

Salary distribution for jobs with remote working options citing DevOps Engineer over the 6 months to 1 May 2025.

DevOps Engineer salary histogram for jobs with a WFH option

DevOps Engineer Skill Set
Top 30 Co-occurring Skills and Capabilities in Job Vacancies with WFH Options

For the 6 months to 1 May 2025, DevOps Engineer job roles required the following skills and capabilities in order of popularity. The figures indicate the absolute number co-occurrences and as a proportion of all permanent jobs with hybrid or remote work options featuring DevOps Engineer in the job title.

1 263 (100.00%) DevOps
2 202 (76.81%) Kubernetes
3 201 (76.43%) CI/CD
4 199 (75.67%) Terraform
5 188 (71.48%) AWS
6 184 (69.96%) Docker
7 182 (69.20%) Python
8 156 (59.32%) Finance
9 139 (52.85%) Agile
10 116 (44.11%) Site Reliability Engineering
11 114 (43.35%) Serverless
11 114 (43.35%) Software Engineering
12 104 (39.54%) AWS Lambda
13 102 (38.78%) Amazon ECS
14 99 (37.64%) Asset Management
14 99 (37.64%) Front Office
15 92 (34.98%) Go
16 91 (34.60%) Java
17 89 (33.84%) Azure
18 83 (31.56%) Kafka
19 78 (29.66%) Open Source
20 77 (29.28%) OpenShift
21 76 (28.90%) Artifactory
21 76 (28.90%) Apache
22 75 (28.52%) Data Engineering
23 74 (28.14%) dbt
24 73 (27.76%) Dremio
24 73 (27.76%) Apache Iceberg
24 73 (27.76%) Amazon Athena
24 73 (27.76%) Apache Airflow

DevOps Engineer Skill Set
Co-occurring Skills and Capabilities with WFH Options by Category

The follow tables expand on the table above by listing co-occurrences grouped by category. The same employment type, locality and period is covered with up to 20 co-occurrences shown in each of the following categories:

Application Platforms
1 76 (28.90%) Apache
2 73 (27.76%) Apache Airflow
3 71 (27.00%) Apache Spark
4 14 (5.32%) Confluence
5 11 (4.18%) nginx
6 10 (3.80%) Apache Solr
7 1 (0.38%) CICS
7 1 (0.38%) Drupal
Business Applications
1 1 (0.38%) SAP Oil and Gas
Cloud Services
1 188 (71.48%) AWS
2 114 (43.35%) Serverless
3 104 (39.54%) AWS Lambda
4 102 (38.78%) Amazon ECS
5 89 (33.84%) Azure
6 77 (29.28%) OpenShift
7 74 (28.14%) dbt
8 53 (20.15%) Azure DevOps
9 42 (15.97%) GitHub
10 37 (14.07%) AWS CloudFormation
11 36 (13.69%) Amazon EC2
12 33 (12.55%) Amazon S3
13 29 (11.03%) GCP
14 26 (9.89%) Amazon SQS
15 24 (9.13%) GitHub Actions
16 18 (6.84%) Azure AKS
16 18 (6.84%) SaaS
17 14 (5.32%) Amazon EKS
18 11 (4.18%) Azure Monitor
18 11 (4.18%) Datadog
Communications & Networking
1 12 (4.56%) DNS
2 11 (4.18%) HTTPS
3 10 (3.80%) IPsec
3 10 (3.80%) TCP/IP
4 5 (1.90%) HTTP
5 4 (1.52%) Firewall
5 4 (1.52%) Network Security
6 3 (1.14%) Internet
7 2 (0.76%) SSH
8 1 (0.38%) FTP
8 1 (0.38%) SSL
8 1 (0.38%) VPN
Database & Business Intelligence
1 73 (27.76%) Amazon Athena
1 73 (27.76%) Apache Iceberg
1 73 (27.76%) Dremio
2 71 (27.00%) Apache Arrow
2 71 (27.00%) Apache Ignite
3 27 (10.27%) Amazon RDS
3 27 (10.27%) Amazon Redshift
4 17 (6.46%) MySQL
5 11 (4.18%) NoSQL
6 10 (3.80%) Couchbase
7 9 (3.42%) PostgreSQL
8 6 (2.28%) MongoDB
8 6 (2.28%) Relational Database
9 3 (1.14%) Elasticsearch
10 2 (0.76%) Data Lake
10 2 (0.76%) Redis
11 1 (0.38%) Amazon Aurora
11 1 (0.38%) BigQuery
11 1 (0.38%) InfluxDB
11 1 (0.38%) Power BI
Development Applications
1 76 (28.90%) Artifactory
2 41 (15.59%) Jenkins
3 37 (14.07%) SonarQube
4 28 (10.65%) Git
5 25 (9.51%) GitLab
6 17 (6.46%) JIRA
7 15 (5.70%) Sonatype Nexus
8 13 (4.94%) Selenium
9 8 (3.04%) IBM UrbanCode
10 4 (1.52%) Atlassian Bamboo
11 3 (1.14%) AppScan
11 3 (1.14%) Bitbucket
11 3 (1.14%) Cucumber
12 2 (0.76%) Octopus Deploy
12 2 (0.76%) TeamCity
13 1 (0.38%) Locust
13 1 (0.38%) Postman
13 1 (0.38%) Robot Framework
13 1 (0.38%) Spinnaker
13 1 (0.38%) TestRail
General
1 156 (59.32%) Finance
2 99 (37.64%) Front Office
3 53 (20.15%) Banking
4 27 (10.27%) Social Skills
5 11 (4.18%) Public Sector
6 8 (3.04%) Inclusion and Diversity
7 6 (2.28%) Presentation Skills
8 5 (1.90%) Retail
9 4 (1.52%) Back Office
10 3 (1.14%) Manufacturing
11 2 (0.76%) Analytical Skills
11 2 (0.76%) Marketing
12 1 (0.38%) Advertising
12 1 (0.38%) Aviation
12 1 (0.38%) Electronics
12 1 (0.38%) Games
12 1 (0.38%) Health Technology
12 1 (0.38%) Influencing Skills
12 1 (0.38%) Law
12 1 (0.38%) Telecoms
Libraries, Frameworks & Software Standards
1 83 (31.56%) Kafka
2 71 (27.00%) J2EE
2 71 (27.00%) PySpark
3 15 (5.70%) REST
4 13 (4.94%) RabbitMQ
5 12 (4.56%) Azure Blueprints
6 11 (4.18%) Elastic Stack
7 10 (3.80%) ARM Templates
7 10 (3.80%) React
8 4 (1.52%) YAML
9 3 (1.14%) AWS CDK
9 3 (1.14%) AWS SAM
9 3 (1.14%) Django
9 3 (1.14%) FastAPI
9 3 (1.14%) Flask
9 3 (1.14%) JSON
9 3 (1.14%) Playwright
10 2 (0.76%) .NET
10 2 (0.76%) LAMP
10 2 (0.76%) Loki
Miscellaneous
1 18 (6.84%) Management Information System
2 13 (4.94%) Cloud Native
3 9 (3.42%) Onboarding
4 6 (2.28%) Self-Motivation
5 5 (1.90%) Distributed Computing
5 5 (1.90%) Distributed Systems
5 5 (1.90%) Security Posture
6 4 (1.52%) Mainframe
7 3 (1.14%) Data Centre
7 3 (1.14%) Data Protection Act
7 3 (1.14%) Foreign Exchange (FX)
7 3 (1.14%) IoT
8 2 (0.76%) Hybrid Cloud
8 2 (0.76%) Private Cloud
8 2 (0.76%) Product Ownership
8 2 (0.76%) Public Cloud
8 2 (0.76%) Renewable Energy
9 1 (0.38%) Distributed Architecture
9 1 (0.38%) Legacy Systems
9 1 (0.38%) Linux Command Line
Operating Systems
1 35 (13.31%) Linux
2 12 (4.56%) Windows
3 9 (3.42%) Unix
4 5 (1.90%) VMS
5 3 (1.14%) CentOS
5 3 (1.14%) Debian
6 2 (0.76%) Embedded Linux
6 2 (0.76%) Red Hat Enterprise Linux
6 2 (0.76%) Windows Server
7 1 (0.38%) AIX
7 1 (0.38%) Amazon Linux
7 1 (0.38%) Oracle Linux
7 1 (0.38%) Ubuntu
7 1 (0.38%) Windows Server 2016
7 1 (0.38%) zOS
Processes & Methodologies
1 263 (100.00%) DevOps
2 201 (76.43%) CI/CD
3 139 (52.85%) Agile
4 116 (44.11%) Site Reliability Engineering
5 114 (43.35%) Software Engineering
6 99 (37.64%) Asset Management
7 78 (29.66%) Open Source
8 75 (28.52%) Data Engineering
9 62 (23.57%) Infrastructure as Code
10 61 (23.19%) Containerisation
11 40 (15.21%) Platform Engineering
12 30 (11.41%) Fintech
13 27 (10.27%) Mentoring
14 26 (9.89%) DevSecOps
14 26 (9.89%) Test Automation
15 25 (9.51%) Release Management
16 24 (9.13%) Deployment Automation
16 24 (9.13%) Software Delivery
17 23 (8.75%) Continuous Improvement
18 20 (7.60%) Problem-Solving
Programming Languages
1 182 (69.20%) Python
2 92 (34.98%) Go
3 91 (34.60%) Java
4 36 (13.69%) JavaScript
5 34 (12.93%) Bash
6 26 (9.89%) PowerShell
7 13 (4.94%) PHP
8 9 (3.42%) SQL
8 9 (3.42%) TypeScript
9 6 (2.28%) Groovy
10 5 (1.90%) Bicep
10 5 (1.90%) Perl
11 3 (1.14%) C#
11 3 (1.14%) C++
11 3 (1.14%) Shell Script
12 2 (0.76%) C
13 1 (0.38%) AWK
13 1 (0.38%) JCL
13 1 (0.38%) Korn
13 1 (0.38%) Ruby
Qualifications
1 28 (10.65%) Security Cleared
2 12 (4.56%) SC Cleared
3 8 (3.04%) BPSS Clearance
4 7 (2.66%) AWS Certification
5 5 (1.90%) Azure Certification
6 4 (1.52%) (ISC)2 CCSP
6 4 (1.52%) CCSP
6 4 (1.52%) Cisco Certification
6 4 (1.52%) CISSP
7 3 (1.14%) Degree
7 3 (1.14%) OCP
7 3 (1.14%) Oracle Certification
8 2 (0.76%) AWS Certified DevOps Engineer
8 2 (0.76%) DV Cleared
9 1 (0.38%) Master's Degree
9 1 (0.38%) PhD
9 1 (0.38%) RHCE
9 1 (0.38%) RHCSA
Quality Assurance & Compliance
1 12 (4.56%) QA
2 8 (3.04%) NCSC
3 5 (1.90%) GDPR
4 4 (1.52%) FINRA
4 4 (1.52%) NIST
4 4 (1.52%) PCI DSS
4 4 (1.52%) Sarbanes-Oxley
4 4 (1.52%) SLA
5 3 (1.14%) ISO/IEC 27001
6 1 (0.38%) Basel III
6 1 (0.38%) IFRS
6 1 (0.38%) IFRS 9
6 1 (0.38%) PMO
6 1 (0.38%) SOC 2
System Software
1 184 (69.96%) Docker
2 11 (4.18%) Virtual Machines
3 3 (1.14%) VMware Infrastructure
4 2 (0.76%) Active Directory
4 2 (0.76%) vSphere
5 1 (0.38%) Hyper-V
5 1 (0.38%) KVM
5 1 (0.38%) Postfix
5 1 (0.38%) Sendmail
Systems Management
1 202 (76.81%) Kubernetes
2 199 (75.67%) Terraform
3 61 (23.19%) Ansible
4 20 (7.60%) Prometheus
5 15 (5.70%) Grafana
6 14 (5.32%) Istio
7 9 (3.42%) Puppet
8 7 (2.66%) Progress Chef
9 5 (1.90%) Nagios
10 4 (1.52%) Argo
10 4 (1.52%) CASB
10 4 (1.52%) linkerd
10 4 (1.52%) Packer
11 3 (1.14%) Active Directory Federation Services
11 3 (1.14%) Kibana
12 2 (0.76%) Salt
12 2 (0.76%) Single Sign-On
13 1 (0.38%) Check_MK
13 1 (0.38%) Kustomize
13 1 (0.38%) Opsgenie
Vendors
1 17 (6.46%) Microsoft
2 11 (4.18%) Atlassian
3 8 (3.04%) IBM
4 7 (2.66%) Confluent
5 6 (2.28%) Red Hat
6 5 (1.90%) Splunk
6 5 (1.90%) VMware
7 4 (1.52%) AppDynamics
7 4 (1.52%) Google
8 3 (1.14%) Dynatrace
9 2 (0.76%) Commvault
9 2 (0.76%) Cribl.io
9 2 (0.76%) Rapid7
9 2 (0.76%) SAP
10 1 (0.38%) Databricks
10 1 (0.38%) Okta
10 1 (0.38%) Oracle
10 1 (0.38%) Salesforce
10 1 (0.38%) Tenable
10 1 (0.38%) YouTube