Performance Monitoring Jobs in England

Performance Monitoring
UK > England

The table below provides summary statistics for permanent job vacancies advertised in England requiring Performance Monitoring skills. It includes a benchmarking guide to the annual salaries offered in vacancies that cited Performance Monitoring over the 6 months leading up to 28 May 2025, comparing them to the same period in the previous two years.

6 months to
28 May 2025
Same period 2024 Same period 2023
Rank 466 541 590
Rank change year-on-year +75 +49 +95
Permanent jobs citing Performance Monitoring 225 313 351
As % of all permanent jobs advertised in England 0.47% 0.35% 0.40%
As % of the Processes & Methodologies category 0.49% 0.42% 0.42%
Number of salaries quoted 109 192 205
10th Percentile £29,700 £31,250 £35,500
25th Percentile £46,250 £39,938 £38,750
Median annual salary (50th Percentile) £57,670 £50,000 £55,000
Median % change year-on-year +15.34% -9.09% -8.33%
75th Percentile £70,000 £60,000 £71,250
90th Percentile £75,000 £97,500 £90,000
UK median annual salary £57,500 £50,000 £55,000
% change year-on-year +15.00% -9.09% -1.79%

All Process and Methodology Skills
England

Performance Monitoring falls under the Processes and Methodologies category. For comparison with the information above, the following table provides summary statistics for all permanent job vacancies requiring process or methodology skills in England.

Permanent vacancies with a requirement for process or methodology skills 45,477 74,482 83,229
As % of all permanent jobs advertised in England 94.01% 84.24% 95.56%
Number of salaries quoted 22,533 54,432 49,691
10th Percentile £29,625 £29,000 £34,375
25th Percentile £41,250 £40,000 £46,105
Median annual salary (50th Percentile) £57,500 £55,000 £62,500
Median % change year-on-year +4.55% -12.00% +4.17%
75th Percentile £75,000 £72,500 £82,500
90th Percentile £98,695 £93,750 £102,500
UK median annual salary £57,500 £55,000 £61,000
% change year-on-year +4.55% -9.84% +1.67%

Performance Monitoring
Job Vacancy Trend in England

Job postings citing Performance Monitoring as a proportion of all IT jobs advertised in England.
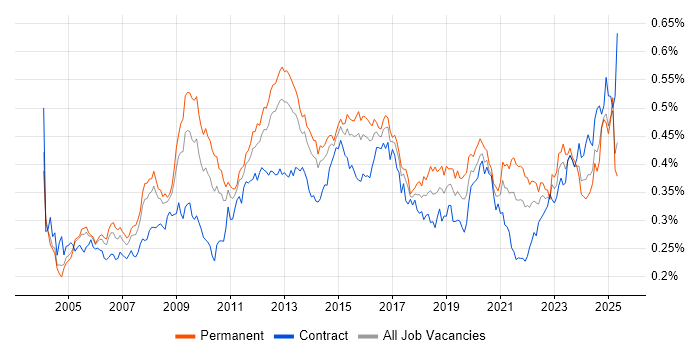
Job vacancy trend for Performance Monitoring in England

Performance Monitoring
Salary Trend in England

3-month moving average salary quoted in jobs citing Performance Monitoring in England.

Salary trend for Performance Monitoring in England

Performance Monitoring
Salary Histogram in England

Salary distribution for jobs citing Performance Monitoring in England over the 6 months to 28 May 2025.

Salary histogram for Performance Monitoring in England

Performance Monitoring
Job Locations in England

The table below looks at the demand and provides a guide to the median salaries quoted in IT jobs citing Performance Monitoring within the England region over the 6 months to 28 May 2025. The 'Rank Change' column provides an indication of the change in demand within each location based on the same 6 month period last year.

Location Rank Change
on Same Period
Last Year
Matching
Permanent
IT Job Ads
Median Salary
Past 6 Months
Median Salary
% Change
on Same Period
Last Year
Live
Jobs
London +160 98 £69,384 -0.88% 188
South East +73 49 £57,500 -2.54% 204
North of England +34 37 £65,000 +30.00% 152
North West +4 28 £65,000 +23.81% 75
Midlands +23 22 £32,551 -34.90% 98
East Midlands +37 12 £25,103 -28.28% 36
West Midlands +29 10 £66,250 +32.50% 54
South West +74 9 £55,971 +29.95% 58
East of England +19 8 £57,500 +9.52% 74
Yorkshire +52 6 £50,750 +61.11% 57
North East +48 3 £69,384 +60.61% 21
Performance Monitoring
UK

Performance Monitoring
Co-occurring Skills and Capabilities in England by Category

The follow tables expand on the table above by listing co-occurrences grouped by category. The same employment type, locality and period is covered with up to 20 co-occurrences shown in each of the following categories:

Application Platforms
1 5 (2.22%) Microsoft Exchange
2 4 (1.78%) SharePoint
3 3 (1.33%) nginx
4 2 (0.89%) Exchange Server 2010
4 2 (0.89%) SAS
4 2 (0.89%) Skype for Business
5 1 (0.44%) Apache
5 1 (0.44%) CMS
5 1 (0.44%) IIS
Applications
1 13 (5.78%) Microsoft Excel
2 7 (3.11%) Microsoft Office
3 2 (0.89%) Trello
4 1 (0.44%) Spreadsheet
Business Applications
1 10 (4.44%) Raiser’s Edge
2 2 (0.89%) Infor CloudSuite
2 2 (0.89%) Infor CloudSuite Industrial (formerly SyteLine)
3 1 (0.44%) Dynamics NAV
3 1 (0.44%) Oracle Applications
3 1 (0.44%) Oracle EBS
3 1 (0.44%) Oracle Payables
3 1 (0.44%) SAP Oil and Gas
3 1 (0.44%) SAP S/4HANA
3 1 (0.44%) Shopify
Cloud Services
1 80 (35.56%) Azure
2 52 (23.11%) AWS
3 39 (17.33%) GCP
4 31 (13.78%) SaaS
5 21 (9.33%) PaaS
6 19 (8.44%) AWS CloudFormation
7 18 (8.00%) Cloud Computing
7 18 (8.00%) Serverless
8 16 (7.11%) AWS Lambda
8 16 (7.11%) Azure Data Factory
9 15 (6.67%) Vertex AI
10 14 (6.22%) Azure Synapse Analytics
11 13 (5.78%) Amazon CloudWatch
12 12 (5.33%) Google Analytics
13 11 (4.89%) Amazon EC2
13 11 (4.89%) Amazon S3
13 11 (4.89%) Azure AI
13 11 (4.89%) Microsoft Copilot
14 10 (4.44%) Amazon ECR
14 10 (4.44%) Amazon OpenSearch
Communications & Networking
1 15 (6.67%) TCP/IP
2 12 (5.33%) DNS
3 11 (4.89%) Cisco ISE
3 11 (4.89%) Ethernet
3 11 (4.89%) MPLS
4 8 (3.56%) DHCP
4 8 (3.56%) Firewall
5 5 (2.22%) SAN
6 4 (1.78%) iSCSI
6 4 (1.78%) LAN
6 4 (1.78%) NAS
7 3 (1.33%) HTTP
7 3 (1.33%) Internet
7 3 (1.33%) Network Security
8 2 (0.89%) Skype
8 2 (0.89%) SMTP
8 2 (0.89%) SSH
8 2 (0.89%) VLAN
9 1 (0.44%) FTP
9 1 (0.44%) OpenScape
Database & Business Intelligence
1 24 (10.67%) Data Mining
2 21 (9.33%) Amazon RDS
3 17 (7.56%) DynamoDB
4 15 (6.67%) Data Warehouse
5 14 (6.22%) PostgreSQL
6 12 (5.33%) Elasticsearch
7 10 (4.44%) Redis
8 9 (4.00%) NoSQL
9 8 (3.56%) Power BI
10 5 (2.22%) Electronic Patient Records
11 4 (1.78%) Tableau
12 3 (1.33%) Metadata
12 3 (1.33%) SQL Server Integration Services
13 2 (0.89%) Azure SQL Data Warehouse
13 2 (0.89%) MySQL
13 2 (0.89%) Oracle Database
13 2 (0.89%) Oracle Reports
13 2 (0.89%) SQL Server
13 2 (0.89%) SQL Server Analysis Services
14 1 (0.44%) Kdb+
Development Applications
1 25 (11.11%) Jenkins
2 21 (9.33%) Git
3 10 (4.44%) GitLab
4 8 (3.56%) CircleCI
5 4 (1.78%) JIRA
6 3 (1.33%) Babel
6 3 (1.33%) gulp
6 3 (1.33%) webpack
General
1 97 (43.11%) Social Skills
2 56 (24.89%) Law
3 54 (24.00%) Analytical Skills
4 47 (20.89%) Finance
5 41 (18.22%) Retail
6 18 (8.00%) Inclusion and Diversity
7 17 (7.56%) Marketing
8 15 (6.67%) Banking
8 15 (6.67%) Telecoms
9 9 (4.00%) Advertising
10 7 (3.11%) Public Sector
11 5 (2.22%) Games
11 5 (2.22%) Pharmaceutical
12 4 (1.78%) Fire and Rescue
13 3 (1.33%) Front Office
13 3 (1.33%) Manufacturing
13 3 (1.33%) Publishing
14 2 (0.89%) Legal
14 2 (0.89%) Military
14 2 (0.89%) Police
Job Titles
1 68 (30.22%) Senior
2 28 (12.44%) Lead
3 22 (9.78%) Architect
4 21 (9.33%) Analyst
5 20 (8.89%) Cloud Engineer
6 19 (8.44%) Developer
7 16 (7.11%) Senior Cloud Engineer
8 12 (5.33%) Software Engineer
9 11 (4.89%) Artificial Intelligence Architect
9 11 (4.89%) Solutions Architect
10 10 (4.44%) Database Manager
11 8 (3.56%) Applications Support
11 8 (3.56%) Infrastructure Engineer
11 8 (3.56%) Site Engineer
11 8 (3.56%) Site Reliability Engineer
12 7 (3.11%) Administrator
12 7 (3.11%) Network Architect
12 7 (3.11%) PPC Analyst
13 6 (2.67%) Applications Manager
13 6 (2.67%) Support Engineer
Libraries, Frameworks & Software Standards
1 19 (8.44%) Node.js
2 14 (6.22%) React
3 11 (4.89%) RESTful
4 10 (4.44%) Django
5 8 (3.56%) gRPC
5 8 (3.56%) Kafka
5 8 (3.56%) RabbitMQ
5 8 (3.56%) web3js
6 6 (2.67%) Spring
7 5 (2.22%) Amazon Corretto
7 5 (2.22%) Lightning Web Components
8 4 (1.78%) CSS
8 4 (1.78%) HTML
8 4 (1.78%) OAuth
8 4 (1.78%) Spring Boot
9 3 (1.33%) Next.js
9 3 (1.33%) REST
9 3 (1.33%) Sass
9 3 (1.33%) Svelte
9 3 (1.33%) Vue
Miscellaneous
1 37 (16.44%) Algorithms
2 30 (13.33%) Management Information System
3 15 (6.67%) Public Cloud
4 13 (5.78%) Cloud Native
5 11 (4.89%) Enterprise Software
6 10 (4.44%) Social Media
7 8 (3.56%) Blockchain
7 8 (3.56%) Distributed Systems
7 8 (3.56%) Self-Motivation
7 8 (3.56%) Web3
8 6 (2.67%) e-Learning
9 5 (2.22%) Distributed Architecture
9 5 (2.22%) NHS
9 5 (2.22%) PACS
9 5 (2.22%) Replication
10 4 (1.78%) Data Centre
11 3 (1.33%) Lidar
11 3 (1.33%) Linux Command Line
11 3 (1.33%) Smart City
12 2 (0.89%) Legacy Systems
Operating Systems
1 57 (25.33%) Linux
2 35 (15.56%) Windows
3 19 (8.44%) Red Hat Enterprise Linux
4 14 (6.22%) Unix
5 13 (5.78%) Windows Server
6 4 (1.78%) Windows Server 2016
7 3 (1.33%) Apple iOS
7 3 (1.33%) Mac OS
7 3 (1.33%) Ubuntu
8 1 (0.44%) AIX
8 1 (0.44%) CentOS
8 1 (0.44%) Oracle Linux
8 1 (0.44%) Solaris
8 1 (0.44%) VMS
8 1 (0.44%) Windows 10
8 1 (0.44%) Windows Server 2019
Processes & Methodologies
1 88 (39.11%) DevOps
2 81 (36.00%) Analytics
3 75 (33.33%) Problem-Solving
4 60 (26.67%) Agile
5 53 (23.56%) CI/CD
6 45 (20.00%) Incident Management
7 41 (18.22%) Artificial Intelligence
7 41 (18.22%) Roadmaps
8 40 (17.78%) Computer Science
8 40 (17.78%) Data Science
9 38 (16.89%) Machine Learning
10 35 (15.56%) Continuous Delivery
10 35 (15.56%) Infrastructure as Code
10 35 (15.56%) MLOps
10 35 (15.56%) Natural Language Processing
11 31 (13.78%) Customer-Centricity
11 31 (13.78%) Visualisation
12 30 (13.33%) High Availability
13 29 (12.89%) Continuous Improvement
14 28 (12.44%) Continuous Integration
Programming Languages
1 57 (25.33%) Python
2 19 (8.44%) SQL
3 14 (6.22%) Java
4 12 (5.33%) Bash
4 12 (5.33%) TypeScript
5 9 (4.00%) PowerShell
6 8 (3.56%) Go
7 7 (3.11%) JavaScript
8 6 (2.67%) R
9 4 (1.78%) C#
9 4 (1.78%) Perl
10 3 (1.33%) Swift
11 2 (0.89%) Bicep
11 2 (0.89%) PHP
11 2 (0.89%) T-SQL
12 1 (0.44%) AWK
12 1 (0.44%) Korn
12 1 (0.44%) MATLAB
12 1 (0.44%) PL/SQL
12 1 (0.44%) VBScript
Qualifications
1 58 (25.78%) Degree
2 26 (11.56%) Security Cleared
3 24 (10.67%) Computer Science Degree
4 22 (9.78%) SC Cleared
5 18 (8.00%) Azure Certification
6 11 (4.89%) DBS Check
6 11 (4.89%) DV Cleared
7 7 (3.11%) Master's Degree
8 6 (2.67%) RHCSA
9 5 (2.22%) Microsoft Certification
10 3 (1.33%) HNC
10 3 (1.33%) HND
10 3 (1.33%) ITIL Certification
11 2 (0.89%) Cisco Certification
11 2 (0.89%) CISM
11 2 (0.89%) CISSP
11 2 (0.89%) MCITP
11 2 (0.89%) PMI Certification
11 2 (0.89%) PMP
12 1 (0.44%) Network+ Certification
Quality Assurance & Compliance
1 29 (12.89%) GDPR
2 12 (5.33%) QA
3 11 (4.89%) California Consumer Privacy Act
4 9 (4.00%) ISO/IEC 27001
5 4 (1.78%) Data Quality
5 4 (1.78%) PCI DSS
6 3 (1.33%) SLA
7 2 (0.89%) IFRS
7 2 (0.89%) IFRS 9
7 2 (0.89%) NIST
8 1 (0.44%) Accessibility
8 1 (0.44%) PSD2
System Software
1 24 (10.67%) Docker
2 18 (8.00%) VMware Infrastructure
3 10 (4.44%) Active Directory
4 4 (1.78%) Hyper-V
4 4 (1.78%) VMware ESXi
5 2 (0.89%) Firmware
5 2 (0.89%) Squid
6 1 (0.44%) KVM
6 1 (0.44%) LXC
6 1 (0.44%) Postfix
6 1 (0.44%) Samba
6 1 (0.44%) Sendmail
6 1 (0.44%) Virtual Machines
Systems Management
1 45 (20.00%) Terraform
2 32 (14.22%) Kubernetes
3 17 (7.56%) Ansible
3 17 (7.56%) Prometheus
4 10 (4.44%) AWS Copilot
4 10 (4.44%) Grafana
5 7 (3.11%) Nagios
6 2 (0.89%) Kibana
6 2 (0.89%) Progress Chef
6 2 (0.89%) Puppet
6 2 (0.89%) SCOM
7 1 (0.44%) Microsoft Intune
7 1 (0.44%) Nessus
7 1 (0.44%) Oracle RMAN
7 1 (0.44%) Single Sign-On
Vendors
1 80 (35.56%) Microsoft
2 49 (21.78%) Google
3 26 (11.56%) OpenAI
4 20 (8.89%) Red Hat
5 19 (8.44%) VMware
6 17 (7.56%) ServiceNow
7 14 (6.22%) Cisco
8 13 (5.78%) SAP
9 12 (5.33%) Workday
10 11 (4.89%) Juniper
10 11 (4.89%) SevOne
10 11 (4.89%) SolarWinds
11 9 (4.00%) Databricks
12 6 (2.67%) Facebook
13 5 (2.22%) Liquidlogic
13 5 (2.22%) Salesforce
14 4 (1.78%) Veeam
15 3 (1.33%) Oracle
16 2 (0.89%) Apple
16 2 (0.89%) Splunk