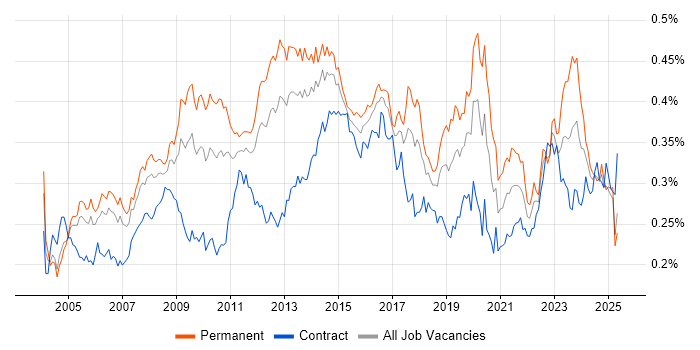
Server Management Jobs

Server Management
UK

The table below provides summary statistics for permanent job vacancies requiring Server Management skills. It includes a benchmarking guide to the annual salaries offered in vacancies that cited Server Management over the 6 months leading up to 26 July 2024, comparing them to the same period in the previous two years.

6 months to
26 Jul 2024
Same period 2023 Same period 2022
Rank 572 638 871
Rank change year-on-year +66 +233 -206
Permanent jobs citing Server Management 282 258 415
As % of all permanent jobs advertised in the UK 0.31% 0.32% 0.24%
As % of the Processes & Methodologies category 0.38% 0.34% 0.25%
Number of salaries quoted 221 148 254
10th Percentile £31,250 £29,300 £31,750
25th Percentile £38,750 £35,938 £38,563
Median annual salary (50th Percentile) £47,500 £47,125 £50,086
Median % change year-on-year +0.80% -5.91% +0.17%
75th Percentile £59,000 £58,750 £64,688
90th Percentile £76,250 £75,000 £77,500
UK excluding London median annual salary £47,000 £42,500 £46,223
% change year-on-year +10.59% -8.05% +2.72%

All Process and Methodology Skills
UK

Server Management falls under the Processes and Methodologies category. For comparison with the information above, the following table provides summary statistics for all permanent job vacancies requiring process or methodology skills.

Permanent vacancies with a requirement for process or methodology skills 73,969 76,929 168,958
As % of all permanent jobs advertised in the UK 81.84% 95.34% 96.40%
Number of salaries quoted 48,628 50,249 85,709
10th Percentile £30,000 £33,750 £33,750
25th Percentile £40,000 £45,000 £44,250
Median annual salary (50th Percentile) £55,000 £60,000 £60,000
Median % change year-on-year -8.33% - +9.09%
75th Percentile £73,750 £80,000 £80,000
90th Percentile £93,750 £100,000 £96,250
UK excluding London median annual salary £50,000 £55,000 £52,500
% change year-on-year -9.09% +4.76% +6.06%

Server Management
Job Vacancy Trend

Job postings citing Server Management as a proportion of all IT jobs advertised.

Job vacancy trend for Server Management in the UK

Server Management
Salary Trend

3-month moving average salary quoted in jobs citing Server Management.

Salary trend for Server Management in the UK

Server Management
Salary Histogram

Salary distribution for jobs citing Server Management over the 6 months to 26 July 2024.

Salary histogram for Server Management in the UK

Server Management
Top 16 Job Locations

The table below looks at the demand and provides a guide to the median salaries quoted in IT jobs citing Server Management within the UK over the 6 months to 26 July 2024. The 'Rank Change' column provides an indication of the change in demand within each location based on the same 6 month period last year.

Location Rank Change
on Same Period
Last Year
Matching
Permanent
IT Job Ads
Median Salary
Past 6 Months
Median Salary
% Change
on Same Period
Last Year
Live
Jobs
England +51 260 £47,500 - 43
UK excluding London +3 239 £47,000 +10.59% 43
Work from Home +43 94 £55,000 +10.00% 21
Midlands +23 75 £50,000 +2.56% 7
North of England +32 61 £42,500 +27.44% 15
West Midlands +25 55 £52,500 +5.00% 5
London +70 37 £57,500 -6.12% 9
South East -2 36 £52,500 +10.53% 6
North West +13 31 £46,411 +28.03% 7
South West -32 28 £51,250 +36.67% 5
East of England +2 23 £40,000 -30.43% 3
Yorkshire +54 20 £42,500 +30.77% 8
East Midlands -12 20 £40,000 -5.88% 2
Scotland -41 11 £46,000 +64.29% 3
North East -5 10 £42,250 +23.63%
Wales +31 5 £50,000 +100.00% 1

Server Management
Co-occurring Skills and Capabilities by Category

The follow tables expand on the table above by listing co-occurrences grouped by category. The same employment type, locality and period is covered with up to 20 co-occurrences shown in each of the following categories:

Application Platforms
1 42 (14.89%) Microsoft Exchange
2 40 (14.18%) IIS
3 31 (10.99%) Apache
4 27 (9.57%) Tomcat
5 25 (8.87%) SharePoint
6 13 (4.61%) CMS
7 10 (3.55%) Umbraco
8 7 (2.48%) nginx
8 7 (2.48%) WordPress
9 4 (1.42%) Exchange Server 2013
10 3 (1.06%) Orchard CMS
11 2 (0.71%) Oracle Application Server
11 2 (0.71%) SharePoint Server
11 2 (0.71%) WebLogic
12 1 (0.35%) Blackberry Enterprise Server
12 1 (0.35%) Exchange Server 2010
12 1 (0.35%) SAS
12 1 (0.35%) Skype for Business
Applications
1 3 (1.06%) Microsoft Office
1 3 (1.06%) MS Visio
2 2 (0.71%) Spreadsheet
Business Applications
1 27 (9.57%) NEC Housing
2 6 (2.13%) Shopify
3 2 (0.71%) Remedy ITSM
Cloud Services
1 122 (43.26%) Azure
2 86 (30.50%) Microsoft 365
3 61 (21.63%) AWS
4 25 (8.87%) Entra ID
5 21 (7.45%) GCP
6 20 (7.09%) SaaS
7 14 (4.96%) Cloud Computing
7 14 (4.96%) PaaS
8 11 (3.90%) GitHub
8 11 (3.90%) IaaS
9 10 (3.55%) Nutanix
10 8 (2.84%) Azure Data Factory
10 8 (2.84%) Azure DevOps
10 8 (2.84%) Power Platform
11 6 (2.13%) Amazon ECS
11 6 (2.13%) Datadog
11 6 (2.13%) OneDrive
11 6 (2.13%) Slack
11 6 (2.13%) Zapier
12 4 (1.42%) Power Automate
Communications & Networking
1 57 (20.21%) Firewall
2 34 (12.06%) SAN
3 32 (11.35%) DNS
4 30 (10.64%) WAN
5 29 (10.28%) DHCP
6 21 (7.45%) VPN
7 19 (6.74%) LAN
7 19 (6.74%) VLAN
8 14 (4.96%) NAS
8 14 (4.96%) SD-WAN
9 13 (4.61%) Network Security
10 12 (4.26%) iSCSI
11 9 (3.19%) Wireless
12 8 (2.84%) Internet
12 8 (2.84%) SNMP
13 6 (2.13%) PBX
14 4 (1.42%) Fibre Channel
14 4 (1.42%) Modbus
14 4 (1.42%) VoIP
14 4 (1.42%) Wi-Fi
Database & Business Intelligence
1 32 (11.35%) Oracle Database
2 23 (8.16%) SQL Server
3 16 (5.67%) MySQL
4 8 (2.84%) Amazon RDS
4 8 (2.84%) Crystal Reports
4 8 (2.84%) Power BI
5 7 (2.48%) Data Lake
6 5 (1.77%) Big Data
7 4 (1.42%) Elasticsearch
8 2 (0.71%) PostgreSQL
9 1 (0.35%) Apache Cassandra
9 1 (0.35%) Data Warehouse
Development Applications
1 17 (6.03%) Git
2 12 (4.26%) GitLab
3 7 (2.48%) Jenkins
4 6 (2.13%) RStudio
5 4 (1.42%) Toad
6 3 (1.06%) Bitbucket
6 3 (1.06%) Team Foundation Server
7 2 (0.71%) JIRA
8 1 (0.35%) Grunt
8 1 (0.35%) Octopus Deploy
8 1 (0.35%) PHPUnit
8 1 (0.35%) webpack
General
1 78 (27.66%) Social Skills
2 54 (19.15%) Finance
3 37 (13.12%) Public Sector
4 27 (9.57%) Local Government
4 27 (9.57%) Police
5 12 (4.26%) Analytical Skills
6 11 (3.90%) Retail
7 10 (3.55%) Law
8 9 (3.19%) Manufacturing
9 8 (2.84%) Games
10 5 (1.77%) Legal
10 5 (1.77%) Military
11 4 (1.42%) Aerospace
11 4 (1.42%) Aviation
11 4 (1.42%) Japanese Language
11 4 (1.42%) Organisational Skills
12 3 (1.06%) Automotive
12 3 (1.06%) Documentation Skills
13 2 (0.71%) Presentation Skills
14 1 (0.35%) Influencing Skills
Job Titles
1 50 (17.73%) Infrastructure Engineer
2 41 (14.54%) Lead
3 34 (12.06%) Developer
4 32 (11.35%) IT Engineer
5 30 (10.64%) IT Manager
6 28 (9.93%) Applications Support
7 23 (8.16%) Senior
8 17 (6.03%) IT Support
9 13 (4.61%) Team Leader
10 12 (4.26%) Lead Developer
11 11 (3.90%) Architect
11 11 (3.90%) IT Infrastructure Engineer
12 10 (3.55%) 2nd Line Support
12 10 (3.55%) Administrator
12 10 (3.55%) Cloud Architect
12 10 (3.55%) Infrastructure Manager
12 10 (3.55%) Systems Engineer
13 9 (3.19%) IT Support Engineer
13 9 (3.19%) Project Engineer
13 9 (3.19%) Support Engineer
Libraries, Frameworks & Software Standards
1 28 (9.93%) Web Services
2 22 (7.80%) HTML
3 21 (7.45%) CSS
4 19 (6.74%) .NET
5 17 (6.03%) Vue
6 11 (3.90%) Laravel
7 10 (3.55%) ASP.NET
8 9 (3.19%) Middleware
9 8 (2.84%) jQuery
9 8 (2.84%) REST
10 7 (2.48%) ASP.NET Core
10 7 (2.48%) React
11 6 (2.13%) .NET Core
11 6 (2.13%) Unity (Game Engine)
12 5 (1.77%) AngularJS
12 5 (1.77%) Sass
13 4 (1.42%) EDI
13 4 (1.42%) RESTful
13 4 (1.42%) Symfony
14 3 (1.06%) Swagger
Miscellaneous
1 37 (13.12%) Public Cloud
2 36 (12.77%) Data Centre
3 28 (9.93%) Management Information System
4 13 (4.61%) Mobile App
4 13 (4.61%) Self-Motivation
5 9 (3.19%) Cloud Native
6 7 (2.48%) Driving Licence
7 6 (2.13%) Augmented Reality
7 6 (2.13%) Clustering
7 6 (2.13%) Cyberattack
7 6 (2.13%) e-Learning
7 6 (2.13%) IoT
7 6 (2.13%) PMI
7 6 (2.13%) Virtual Reality
8 5 (1.77%) Greenfield Project
8 5 (1.77%) Private Cloud
8 5 (1.77%) Replication
9 4 (1.42%) Distributed Systems
9 4 (1.42%) Hybrid Cloud
9 4 (1.42%) Raspberry Pi
Operating Systems
1 158 (56.03%) Windows
2 102 (36.17%) Linux
3 76 (26.95%) Windows Server
4 47 (16.67%) Unix
5 37 (13.12%) Solaris
6 25 (8.87%) Windows 10
6 25 (8.87%) Windows Server 2019
7 16 (5.67%) Ubuntu
8 12 (4.26%) Windows Server 2016
9 10 (3.55%) VMS
10 9 (3.19%) Red Hat Enterprise Linux
10 9 (3.19%) Windows Server 2008
11 6 (2.13%) Windows Server 2012
12 5 (1.77%) CentOS
13 4 (1.42%) Windows 7
13 4 (1.42%) Windows XP
14 3 (1.06%) Android
14 3 (1.06%) Apple iOS
14 3 (1.06%) Mac OS
15 1 (0.35%) SUSE
Processes & Methodologies
1 73 (25.89%) Problem-Solving
2 67 (23.76%) Infrastructure Engineering
3 43 (15.25%) Cybersecurity
3 43 (15.25%) Project Management
4 37 (13.12%) ITIL
5 35 (12.41%) Network Architecture
6 33 (11.70%) Data Security
6 33 (11.70%) Task Automation
7 28 (9.93%) Storage Management
8 27 (9.57%) Computer Science
9 26 (9.22%) Continuous Improvement
10 25 (8.87%) DevOps
10 25 (8.87%) Disaster Recovery
11 24 (8.51%) Agile
12 22 (7.80%) Analytics
13 21 (7.45%) Mentoring
13 21 (7.45%) Project Delivery
14 20 (7.09%) ERP
14 20 (7.09%) Incident Management
14 20 (7.09%) Information Security
Programming Languages
1 35 (12.41%) SQL
2 32 (11.35%) Shell Script
3 25 (8.87%) PowerShell
4 23 (8.16%) JavaScript
5 19 (6.74%) PHP
6 17 (6.03%) C#
7 11 (3.90%) Python
8 9 (3.19%) R
9 6 (2.13%) Bash
9 6 (2.13%) Java
10 4 (1.42%) Perl
10 4 (1.42%) PL/SQL
10 4 (1.42%) TypeScript
11 2 (0.71%) ActionScript
11 2 (0.71%) C++
11 2 (0.71%) Korn
12 1 (0.35%) C
Qualifications
1 71 (25.18%) Degree
2 49 (17.38%) Security Cleared
3 21 (7.45%) Microsoft Certification
4 19 (6.74%) Computer Science Degree
5 18 (6.38%) SC Cleared
6 16 (5.67%) Azure Certification
7 15 (5.32%) AWS Certification
8 14 (4.96%) CCNA
8 14 (4.96%) Cisco Certification
8 14 (4.96%) MCSE
9 12 (4.26%) DV Cleared
10 9 (3.19%) AWS Certified Solutions Architect
11 6 (2.13%) AWS Certified DevOps Engineer
11 6 (2.13%) MCSA
11 6 (2.13%) PMI Certification
12 5 (1.77%) CCNP
13 4 (1.42%) CTC Cleared
14 3 (1.06%) VMware Certified Professional (VCP)
15 2 (0.71%) A+ Certification
16 1 (0.35%) ITIL Certification
Quality Assurance & Compliance
1 31 (10.99%) Accessibility
2 13 (4.61%) Cyber Essentials
3 12 (4.26%) ISO/IEC 27001
4 7 (2.48%) Data Quality
5 6 (2.13%) SOC 2
6 5 (1.77%) GDPR
6 5 (1.77%) SLA
6 5 (1.77%) SOC 1
7 4 (1.42%) NIST
8 3 (1.06%) JSP 440
9 2 (0.71%) Cyber Essentials PLUS
9 2 (0.71%) PCI DSS
10 1 (0.35%) ISO/IEC 27002 (supersedes ISO/IEC 17799)
10 1 (0.35%) NCSC
10 1 (0.35%) PMO
System Software
1 90 (31.91%) Active Directory
2 61 (21.63%) VMware Infrastructure
3 38 (13.48%) Hyper-V
4 24 (8.51%) Docker
5 20 (7.09%) Virtual Machines
6 11 (3.90%) vSphere
7 9 (3.19%) Virtual Servers
8 8 (2.84%) Virtual Desktop
8 8 (2.84%) VMware ESXi
9 5 (1.77%) pfSense
10 3 (1.06%) Firmware
11 1 (0.35%) Microsoft Virtual Server
11 1 (0.35%) NFS
11 1 (0.35%) Veritas Cluster Server
Systems Management
1 36 (12.77%) Microsoft Intune
2 16 (5.67%) SCCM
3 14 (4.96%) Terraform
4 12 (4.26%) Kubernetes
5 11 (3.90%) vCenter Server
6 10 (3.55%) SCOM
7 8 (2.84%) Active Directory Federation Services
8 7 (2.48%) Nagios
8 7 (2.48%) ZABBIX
9 6 (2.13%) Ansible
9 6 (2.13%) Consul
9 6 (2.13%) EMC NetWorker
9 6 (2.13%) Opsgenie
9 6 (2.13%) Puppet
9 6 (2.13%) VxRail
10 5 (1.77%) Grafana
10 5 (1.77%) NetBackup
11 4 (1.42%) Cacti
11 4 (1.42%) Oracle Enterprise Manager
11 4 (1.42%) WSUS
Vendors
1 136 (48.23%) Microsoft
2 68 (24.11%) VMware
3 39 (13.83%) Oracle
4 36 (12.77%) Cisco
5 27 (9.57%) NEC
6 24 (8.51%) Veeam
7 22 (7.80%) Dell
8 18 (6.38%) HP
9 12 (4.26%) Red Hat
10 11 (3.90%) Fortinet
11 9 (3.19%) Citrix
11 9 (3.19%) EMC
11 9 (3.19%) NetApp
12 8 (2.84%) Epicor
12 8 (2.84%) Google
12 8 (2.84%) SolarWinds
13 7 (2.48%) Databricks
13 7 (2.48%) Meraki
13 7 (2.48%) Symantec
13 7 (2.48%) WooCommerce