Configuration Management Database (CMDB)
UK

The table below looks at the prevalence of the term CMDB in permanent job vacancies. Included is a benchmarking guide to the salaries offered in vacancies that have cited CMDB over the 6 months to 4 December 2023 with a comparison to the same period over the previous 2 years.

6 months to
4 Dec 2023
Same period 2022 Same period 2021
Rank 547 706 853
Rank change year-on-year +159 +147 -204
Permanent jobs citing CMDB 196 393 249
As % of all permanent jobs advertised in the UK 0.37% 0.32% 0.19%
As % of the Miscellaneous category 1.00% 0.73% 0.44%
Number of salaries quoted 162 235 172
10th Percentile £26,050 £32,759 £25,750
25th Percentile £32,500 £39,250 £36,250
Median annual salary (50th Percentile) £52,250 £52,500 £50,750
Median % change year-on-year -0.48% +3.45% -2.40%
75th Percentile £83,438 £73,750 £70,000
90th Percentile £88,750 £88,750 £82,500
UK excluding London median annual salary £34,000 £50,000 £42,500
% change year-on-year -32.00% +17.65% -21.30%

All Generic Skills
UK

CMDB is in the General and Transferable Skills category. The following table is for comparison with the above and provides summary statistics for all permanent job vacancies with a requirement for generic IT skills.

Permanent vacancies with a requirement for generic IT skills 19,607 53,764 56,466
As % of all permanent jobs advertised in the UK 36.83% 43.38% 44.03%
Number of salaries quoted 14,348 29,746 33,691
10th Percentile £33,250 £34,875 £33,750
25th Percentile £45,000 £46,250 £45,000
Median annual salary (50th Percentile) £62,500 £63,500 £60,000
Median % change year-on-year -1.57% +5.83% -
75th Percentile £84,056 £85,000 £82,500
90th Percentile £107,500 £105,000 £100,000
UK excluding London median annual salary £55,000 £55,000 £50,000
% change year-on-year - +10.00% -

CMDB
Job Vacancy Trend

Job postings citing CMDB as a proportion of all IT jobs advertised.
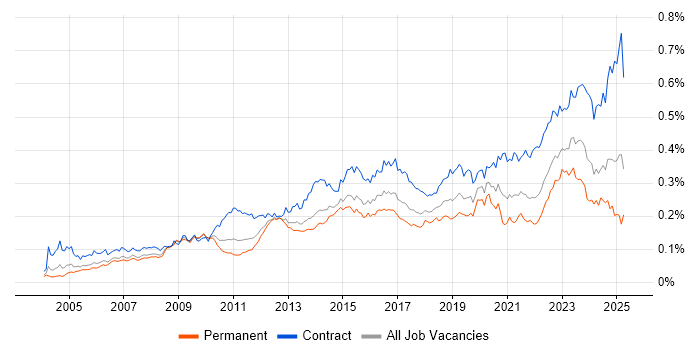
Job vacancy trend for CMDB in the UK

CMDB
Salary Trend

3-month moving average salary quoted in jobs citing CMDB.

Salary trend for CMDB in the UK

CMDB
Salary Histogram

Salary distribution for jobs citing CMDB over the 6 months to 4 December 2023.

Salary histogram for CMDB in the UK

CMDB
Top 15 Job Locations

The table below looks at the demand and provides a guide to the median salaries quoted in IT jobs citing CMDB within the UK over the 6 months to 4 December 2023. The 'Rank Change' column provides an indication of the change in demand within each location based on the same 6 month period last year.

Location Rank Change
on Same Period
Last Year
Matching
Permanent
IT Job Ads
Median Salary
Past 6 Months
Median Salary
% Change
on Same Period
Last Year
Live
Jobs
England +159 182 £52,000 -0.95% 78
UK excluding London +161 105 £34,000 -32.00% 41
London +172 77 £82,500 +46.04% 32
Work from Home +192 63 £82,500 +55.66% 28
North of England +162 43 £32,000 -11.72% 11
South East +136 36 £33,000 -37.74% 13
Yorkshire +111 23 £45,000 - 4
West Midlands +127 15 £57,500 +13.66%
Midlands +109 15 £57,500 +9.52% 2
North East +48 13 £26,000 -25.71% 2
North West +101 8 £51,000 +36.00% 5
South West +54 7 £48,250 -3.50% 6
East of England +111 2 - - 4
Wales +21 2 £33,426 +48.56%
Scotland +44 1 £47,557 -18.01% 7

CMDB
Co-occurring Skills and Capabilities by Category

The follow tables expand on the table above by listing co-occurrences grouped by category. The same employment type, locality and period is covered with up to 20 co-occurrences shown in each of the following categories:

Application Platforms
1 25 (12.76%) IIS
2 6 (3.06%) SharePoint
3 5 (2.55%) CMS
4 3 (1.53%) nginx
5 2 (1.02%) Confluence
6 1 (0.51%) Exchange Server 2013
6 1 (0.51%) MS Exchange
Applications
1 13 (6.63%) Microsoft Office
2 1 (0.51%) Microsoft Excel
Business Applications
1 27 (13.78%) Remedy ITSM
Cloud Services
1 48 (24.49%) Azure
2 28 (14.29%) SaaS
3 20 (10.20%) Microsoft 365
4 13 (6.63%) AWS
5 7 (3.57%) Cloud Computing
6 6 (3.06%) Entra ID
6 6 (3.06%) PaaS
7 5 (2.55%) IaaS
8 3 (1.53%) Power Platform
9 2 (1.02%) Azure Monitor
9 2 (1.02%) GCP
9 2 (1.02%) OneDrive
10 1 (0.51%) Azure AKS
10 1 (0.51%) Power Automate
10 1 (0.51%) WhatsApp
Communications & Networking
1 38 (19.39%) Firewall
2 32 (16.33%) DNS
3 30 (15.31%) DHCP
4 27 (13.78%) SSL
5 26 (13.27%) VPN
6 25 (12.76%) SNMP
7 9 (4.59%) LAN
7 9 (4.59%) WAN
8 5 (2.55%) Ethernet
8 5 (2.55%) Internet
8 5 (2.55%) SAN
9 4 (2.04%) MPLS
9 4 (2.04%) VoIP
9 4 (2.04%) Wireless
10 3 (1.53%) BGP
10 3 (1.53%) NAS
10 3 (1.53%) SD-WAN
11 2 (1.02%) Cisco IOS
11 2 (1.02%) OSPF
11 2 (1.02%) TCP/IP
Database & Business Intelligence
1 13 (6.63%) SQL Server
2 7 (3.57%) Amazon Redshift
3 4 (2.04%) Data Warehouse
3 4 (2.04%) Oracle Database
3 4 (2.04%) Relational Database
4 3 (1.53%) PostgreSQL
5 2 (1.02%) Azure SQL Database
6 1 (0.51%) Amazon RDS
6 1 (0.51%) MySQL
6 1 (0.51%) Power BI
Development Applications
1 6 (3.06%) GitLab
2 5 (2.55%) JIRA
General
1 31 (15.82%) Analytical Skills
2 27 (13.78%) Social Skills
3 24 (12.24%) Finance
4 16 (8.16%) Law
5 10 (5.10%) Inclusion and Diversity
6 6 (3.06%) Banking
7 5 (2.55%) Legal
8 4 (2.04%) Telecoms
9 3 (1.53%) Influencing Skills
9 3 (1.53%) Public Sector
9 3 (1.53%) Publishing
10 2 (1.02%) Aviation
10 2 (1.02%) Military
10 2 (1.02%) Retail
11 1 (0.51%) Financial Institution
11 1 (0.51%) International Banking
11 1 (0.51%) Social Housing
Job Titles
1 36 (18.37%) Senior
2 30 (15.31%) Consultant
3 29 (14.80%) ServiceNow Consultant
4 28 (14.29%) Analyst
5 26 (13.27%) Systems Engineer
5 26 (13.27%) Windows Engineer
6 25 (12.76%) Technical Consultant
6 25 (12.76%) Windows Systems Engineer
7 24 (12.24%) ITSM Consultant
7 24 (12.24%) Senior Consultant
7 24 (12.24%) Senior ITSM Consultant
7 24 (12.24%) Senior ServiceNow Consultant
7 24 (12.24%) Senior Technical Consultant
8 12 (6.12%) ITSM Analyst
9 10 (5.10%) Data Centre Engineer
9 10 (5.10%) ITSM Specialist
10 9 (4.59%) IT Analyst
10 9 (4.59%) IT Support
11 8 (4.08%) Configuration Manager
11 8 (4.08%) IT Engineer
Libraries, Frameworks & Software Standards
1 33 (16.84%) Web Services
2 31 (15.82%) HTML
3 29 (14.80%) SOAP
4 28 (14.29%) CSS
5 27 (13.78%) Ajax
5 27 (13.78%) LDAP
6 26 (13.27%) XML
7 6 (3.06%) Elastic Stack
7 6 (3.06%) Kafka
8 4 (2.04%) AngularJS
8 4 (2.04%) FIX Protocol
8 4 (2.04%) Middleware
9 3 (1.53%) DHTML
9 3 (1.53%) JAX-WS
9 3 (1.53%) WSDL
9 3 (1.53%) XHTML
10 2 (1.02%) JSON
10 2 (1.02%) REST
11 1 (0.51%) Twitter Bootstrap
11 1 (0.51%) XSLT
Miscellaneous
1 19 (9.69%) Data Centre
2 8 (4.08%) Fibre Optics
3 7 (3.57%) Distributed Systems
3 7 (3.57%) Self-Motivation
4 6 (3.06%) Management Information System
5 5 (2.55%) Onboarding
6 3 (1.53%) Enterprise Software
6 3 (1.53%) Hybrid Cloud
6 3 (1.53%) iPhone
6 3 (1.53%) Mobile App
7 2 (1.02%) Security Operations Centre
7 2 (1.02%) Smartphone
7 2 (1.02%) Virtual Team
8 1 (0.51%) Data Protection Act
8 1 (0.51%) Device Driver
8 1 (0.51%) Digital Media
8 1 (0.51%) Enterprise Cloud
8 1 (0.51%) PKI
8 1 (0.51%) SWIFT Messaging Network
8 1 (0.51%) Video Conferencing
Operating Systems
1 63 (32.14%) Windows
2 42 (21.43%) Linux
3 38 (19.39%) Windows Server
4 17 (8.67%) Windows 10
5 6 (3.06%) Red Hat Enterprise Linux
5 6 (3.06%) Windows Server 2016
6 5 (2.55%) Windows 7
7 4 (2.04%) Windows Server 2012
8 2 (1.02%) Android
8 2 (1.02%) Apple iOS
Processes & Methodologies
1 95 (48.47%) ITIL
2 83 (42.35%) Configuration Management
3 79 (40.31%) ITSM
4 58 (29.59%) Service Management
5 47 (23.98%) Agile
6 36 (18.37%) Asset Management
7 32 (16.33%) IT Asset Management
8 29 (14.80%) Release Management
8 29 (14.80%) Waterfall
9 26 (13.27%) Customer Requirements
10 25 (12.76%) Presales
11 24 (12.24%) Customer Engagement
11 24 (12.24%) Technical Architecture
11 24 (12.24%) Thought Leadership
12 23 (11.73%) Problem Management
13 21 (10.71%) Customer Service
14 20 (10.20%) Incident Management
15 19 (9.69%) Change Management
15 19 (9.69%) Process Improvement
15 19 (9.69%) Roadmaps
Programming Languages
1 38 (19.39%) SQL
2 29 (14.80%) JavaScript
3 14 (7.14%) PowerShell
4 13 (6.63%) Bash
5 10 (5.10%) Python
6 8 (4.08%) Java
7 6 (3.06%) Kotlin
8 4 (2.04%) C
8 4 (2.04%) Perl
9 1 (0.51%) VBScript
Qualifications
1 65 (33.16%) Security Cleared
2 62 (31.63%) SC Cleared
3 40 (20.41%) Degree
4 25 (12.76%) DV Cleared
5 16 (8.16%) ITIL Certification
6 4 (2.04%) CCNA
6 4 (2.04%) Cisco Certification
7 3 (1.53%) BPSS Clearance
7 3 (1.53%) ITIL Foundation Certificate
8 2 (1.02%) AWS Certification
8 2 (1.02%) OCP
8 2 (1.02%) Oracle Certification
9 1 (0.51%) ISEB
9 1 (0.51%) ISEB Practitioner
9 1 (0.51%) JNCIA
9 1 (0.51%) PMI Certification
9 1 (0.51%) PMP
Quality Assurance & Compliance
1 8 (4.08%) SLA
2 3 (1.53%) QA
3 2 (1.02%) Cyber Essentials
3 2 (1.02%) Cyber Essentials PLUS
3 2 (1.02%) ISO/IEC 27001
3 2 (1.02%) NIST
3 2 (1.02%) NIST 800
4 1 (0.51%) COBIT
4 1 (0.51%) Data Quality
4 1 (0.51%) GDPR
4 1 (0.51%) GRC
4 1 (0.51%) PMO
System Software
1 48 (24.49%) Active Directory
2 7 (3.57%) Docker
3 5 (2.55%) VMware Infrastructure
4 2 (1.02%) IAG
4 2 (1.02%) Virtual Machines
5 1 (0.51%) BitLocker
5 1 (0.51%) DFS Replication
5 1 (0.51%) Hyper-V
5 1 (0.51%) VMware ESXi
Systems Management
1 25 (12.76%) SCOM
2 24 (12.24%) HP UCMDB
3 13 (6.63%) SCCM
4 7 (3.57%) Kubernetes
5 6 (3.06%) Ansible
5 6 (3.06%) Microsoft Intune
5 6 (3.06%) Puppet
6 4 (2.04%) Nagios
7 3 (1.53%) Single Sign-On
8 2 (1.02%) Active Directory Federation Services
8 2 (1.02%) Packer
8 2 (1.02%) Terraform
9 1 (0.51%) IBM BigFix
9 1 (0.51%) Jamf Pro
9 1 (0.51%) Nmap
9 1 (0.51%) vCenter Server
Vendors
1 85 (43.37%) ServiceNow
2 51 (26.02%) Microsoft
3 36 (18.37%) HP
4 29 (14.80%) Remedy
5 27 (13.78%) BMC
6 25 (12.76%) Dynatrace
7 16 (8.16%) Cisco
8 9 (4.59%) CheckPoint
9 8 (4.08%) F5
9 8 (4.08%) Riverbed
10 6 (3.06%) Oracle
10 6 (3.06%) VMware
11 4 (2.04%) Infoblox
11 4 (2.04%) Salesforce
11 4 (2.04%) Snow
12 3 (1.53%) MuleSoft
12 3 (1.53%) SnapLogic
13 2 (1.02%) Fortinet
13 2 (1.02%) iManage
13 2 (1.02%) Meraki