Senior Consultant
UK
The median Senior Consultant salary in the UK is £75,000 per year, according to job vacancies posted during the 6 months leading to 23 May 2025.
The table below provides salary benchmarking and summary statistics, comparing them to the same period in the previous two years.
| 6 months to 23 May 2025 |
Same period 2024 | Same period 2023 | |
|---|---|---|---|
| Rank | 505 | 435 | 477 |
| Rank change year-on-year | -70 | +42 | +199 |
| Permanent jobs requiring a Senior Consultant | 209 | 557 | 603 |
| As % of all permanent jobs advertised in the UK | 0.38% | 0.56% | 0.61% |
| As % of the Job Titles category | 0.42% | 0.59% | 0.67% |
| Number of salaries quoted | 170 | 373 | 359 |
| 10th Percentile | £40,000 | £46,250 | £52,250 |
| 25th Percentile | £59,125 | £55,000 | £60,000 |
| Median annual salary (50th Percentile) | £75,000 | £70,000 | £72,500 |
| Median % change year-on-year | +7.14% | -3.45% | +3.57% |
| 75th Percentile | £94,688 | £82,500 | £85,625 |
| 90th Percentile | £104,375 | £97,500 | £97,500 |
| UK excluding London median annual salary | £75,000 | £60,000 | £67,500 |
| % change year-on-year | +25.00% | -11.11% | -3.57% |
All Permanent IT Job Vacancies
UK
For comparison with the information above, the following table provides summary statistics for all permanent IT job vacancies. Most job vacancies include a discernible job title that can be normalized. As such, the figures in the second row provide an indication of the number of permanent jobs in our overall sample.
| Permanent vacancies in the UK with a recognized job title | 49,357 | 94,770 | 90,282 |
| % of permanent jobs with a recognized job title | 90.42% | 94.70% | 91.49% |
| Number of salaries quoted | 25,605 | 67,694 | 56,964 |
| 10th Percentile | £29,000 | £28,500 | £32,500 |
| 25th Percentile | £41,250 | £38,500 | £45,000 |
| Median annual salary (50th Percentile) | £56,000 | £52,500 | £60,000 |
| Median % change year-on-year | +6.67% | -12.50% | - |
| 75th Percentile | £73,750 | £70,622 | £80,000 |
| 90th Percentile | £96,250 | £90,000 | £100,000 |
| UK excluding London median annual salary | £51,645 | £50,000 | £53,438 |
| % change year-on-year | +3.29% | -6.43% | +6.88% |
Senior Consultant
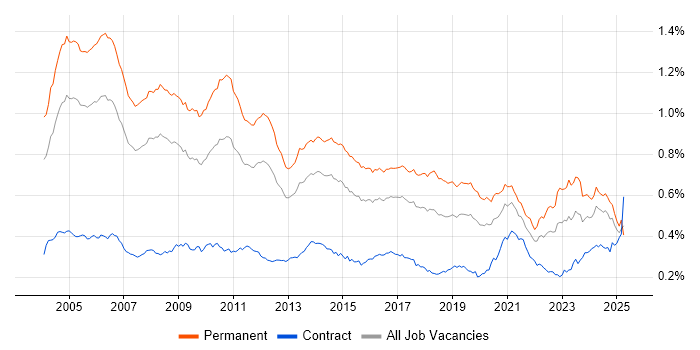
Job Vacancy Trend
Job postings that featured Senior Consultant in the job title as a proportion of all IT jobs advertised.

Senior Consultant
Salary Trend
3-month moving average salary quoted in jobs citing Senior Consultant.
Senior Consultant
Salary Histogram
Salary distribution for jobs citing Senior Consultant over the 6 months to 23 May 2025.
Senior Consultant
Top 18 Job Locations
The table below looks at the demand and provides a guide to the median salaries quoted in IT jobs citing Senior Consultant within the UK over the 6 months to 23 May 2025. The 'Rank Change' column provides an indication of the change in demand within each location based on the same 6 month period last year.
| Location | Rank Change on Same Period Last Year |
Matching Permanent IT Job Ads |
Median Salary Past 6 Months |
Median Salary % Change on Same Period Last Year |
Live Jobs |
|---|---|---|---|---|---|
| England | -50 | 190 | £75,000 | +7.14% | 2,095 |
| London | +8 | 103 | £72,500 | -3.33% | 395 |
| Work from Home | -11 | 92 | £75,000 | +7.14% | 1,149 |
| UK excluding London | +4 | 87 | £75,000 | +25.00% | 1,946 |
| Midlands | +43 | 25 | £80,000 | +33.33% | 351 |
| West Midlands | +49 | 23 | £80,000 | +28.00% | 193 |
| North of England | -4 | 23 | £80,000 | +23.08% | 444 |
| South West | +90 | 16 | £40,000 | -33.33% | 226 |
| South East | +50 | 14 | £75,000 | +39.53% | 520 |
| North West | -40 | 14 | £77,500 | +10.71% | 216 |
| Yorkshire | +55 | 7 | £80,000 | +45.45% | 175 |
| Scotland | +102 | 4 | £80,000 | +14.29% | 91 |
| Northern Ireland | +36 | 3 | £100,000 | +17.65% | 32 |
| North East | +48 | 2 | £80,000 | +14.29% | 53 |
| East Midlands | +26 | 2 | £29,000 | -22.67% | 135 |
| Wales | +20 | 2 | £74,552 | +56.95% | 48 |
| East of England | +15 | 1 | £67,500 | +50.00% | 293 |
| Channel Islands | - | 1 | £97,500 | - | 15 |
Senior Consultant Skill Set
Top 30 Co-occurring Skills and Capabilities
For the 6 months to 23 May 2025, Senior Consultant job roles required the following skills and capabilities in order of popularity. The figures indicate the absolute number co-occurrences and as a proportion of all permanent job ads featuring Senior Consultant in the job title.
|
|
Senior Consultant Skill Set
Co-occurring Skills and Capabilities by Category
The follow tables expand on the table above by listing co-occurrences grouped by category. The same employment type, locality and period is covered with up to 20 co-occurrences shown in each of the following categories:
|
|
||||||||||||||||||||||||||||||||||||||||||||||||||||||||||||||||||||||||||||||||||||||||||||||||||||||||||||||||||||||||||||||
|
|
||||||||||||||||||||||||||||||||||||||||||||||||||||||||||||||||||||||||||||||||||||||||||||||||||||||||||||||||||||||||||||||
|
|
||||||||||||||||||||||||||||||||||||||||||||||||||||||||||||||||||||||||||||||||||||||||||||||||||||||||||||||||||||||||||||||
|
|
||||||||||||||||||||||||||||||||||||||||||||||||||||||||||||||||||||||||||||||||||||||||||||||||||||||||||||||||||||||||||||||
|
|
||||||||||||||||||||||||||||||||||||||||||||||||||||||||||||||||||||||||||||||||||||||||||||||||||||||||||||||||||||||||||||||
|
|
||||||||||||||||||||||||||||||||||||||||||||||||||||||||||||||||||||||||||||||||||||||||||||||||||||||||||||||||||||||||||||||
|
|
||||||||||||||||||||||||||||||||||||||||||||||||||||||||||||||||||||||||||||||||||||||||||||||||||||||||||||||||||||||||||||||
|
|
||||||||||||||||||||||||||||||||||||||||||||||||||||||||||||||||||||||||||||||||||||||||||||||||||||||||||||||||||||||||||||||
|
|
||||||||||||||||||||||||||||||||||||||||||||||||||||||||||||||||||||||||||||||||||||||||||||||||||||||||||||||||||||||||||||||
